Effects of School Health Lessons on Adolescent Health Behavior Outcomes
By Reena Gupta
Honors Thesis Department of Public Policy
University of North Carolina at Chapel Hill
April 2015
Approved: __________________________ Student’s Chair
ABSTRACT
ACKNOWLEDGEMENTS
This research uses data from Add Health, a program project designed by J. Richard Udry, Peter S. Bearman, and Kathleen Mullan Harris, and funded by a grant P01-HD31921 from the Eunice Kennedy Shriver National Institute of Child Health and Human Development, with cooperative funding from 17 other agencies. Special acknowledgment is due Ronald R. Rindfuss and Barbara Entwisle for assistance in the original design. Persons interested in obtaining data files from Add Health should contact Add Health, Carolina Population Center, 123 W. Franklin Street, Chapel Hill, NC 27516-2524 ([email protected]). No direct support was received from grant P01-HD31921 for this analysis.
TABLE OF CONTENTS
CHAPTER I: SIGNIFICANCE AND SPECIFIC AIMS………...5
CHAPTER II: LITERATURE REVIEW……….….8
CHAPTER III: METHODS……….…14
CHAPTER IV: RESULTS……….…23
CHAPTER V: CONCLUSIONS………3 8 REFERENCES……….43
CHAPTER I: SIGNIFICANCE AND SPECIFIC AIMS
Statement of Problem
According to the Center for Disease Control (CDC), approximately 19.5 percent of adolescents, ages 12-17, were not in excellent or very good health in 2012. Bloom, Jones, and Freedman (2013) found that approximately 2/3 of school-aged children (5-17) missed school due to illness or injury in 2012. At least 10 million children had a health condition for which they took prescription medication regularly for at least 3 months (13%), and almost 5 million children (7%) did not have health insurance coverage in 2012 (Bloom et. al, 2013). Statistical evidence of adolescent health risk in the United States is alarming and reveals the severity of adolescent health currently in this country.
Adolescence is a trying period of accelerated growth and change that serves as a stepping stone for the transition from childhood to adulthood. This period is characterized by hormonal changes, physical and intellectual maturation, and often increased exposure to risk behaviors. Thus, adolescence is a pivotal point in an individual's life. The behaviors and attitudes adolescents learn have potential long-term consequences for their health and quality of life, as well as those they influence in the future. Adolescents experience a multitude of health pressures. These include peer pressure to have sex, use tobacco, alcohol, or other drugs, as well as the stressors that increased academic rigor, peer pressure, and societal pressure combine to provide (MacKay & Duran, 2007). Additionally, adolescents are charged with maturing, learning responsibility, handling puberty with ease, and maintaining academic excellence. With all of these forces of pressure acting upon them, it is essential to ensure adolescents have the support they need to develop healthy habits.
Many studies have conducted analyses involving the relationships of socioeconomic status, culture, or gender on health outcomes, but there remains a lack of literature on how schools can help cultivate future healthy generations through education. Adolescents spend a considerable amount of their daily time in school, thus the school environment is significant to adolescent outcomes. This study seeks to analyze the key linkages between lessons learned in schools and adolescent health outcomes, specifically outcomes related to nutrition, body image, physical fitness, and risky behaviors including smoking, drinking, drug abuse, and pregnancy.
Specifically, this study analyzes the relationship between health education (measured by student reports of learning in school) provided in school systems and the health outcomes of the students using the National Longitudinal Study of Adolescent to Adult Health (AddHealth). First, this project will outline the prevalence of specific health lessons learned in their schools, as self-reported by the students. Second, this study will consider the impact of these lessons in school systems on youth health outcomes, including nutrition, body image, fitness, and engaging in risk-behavior activities such as smoking, drinking, drug abuse, and pregnancy.
Justification of Study
The future costs associated with injuries suffered and habits sustained post-adolescence can create an economic burden on the healthcare system as well as decrease quality of life for many. Though difficult to quantify the exact financial burden, this cost would affect medical, prison, and lost future revenues (DiClemente et. al, 1996).
encourage healthier school districts that would increase lifelong individual health and economic success. This would in turn contribute to an overall greater health for families and communities in those school districts (Ruglis & Freudenberg, 2010).
Data collected from Wave I and Wave II of AddHealth provide the opportunity to examine if existing school health lessons can positively influence student health outcomes. Understanding if schools can provide an impact on adolescent health behaviors could increase overall support of school health education. Since these analyses are mainly correlational, the results alone will not support specific policy recommendations, but will instead highlight potential gaps in health education currently provided in schools. This analysis will inform future research and formation of relevant school health policies.
Summary
There are a number of biological, cognitive, and social changes that occur during adolescence that increase vulnerability to health risk-behaviors as well as adopting poor long-term habits. School environments could have the unique opportunity to provide resources, support, and education to influence better adolescent health habits in the present and into the future. Using data from Wave I and Wave II of AddHealth, this study seeks to analyze if school health education is, in fact, influential on adolescent health outcomes.
CHAPTER II: LITERATURE REVIEW
Review
Many studies have been conducted to analyze adolescent health needs, or what
adolescents require to adopt health habits. Although the literature covers a wide variety of such studies, this review will focus on eight major themes: adolescent health risks, school health education, physical activity, nutrition, smoking, alcohol, drugs, and sexual activity. The findings and background information relevant to this particular study are included in this chapter. The inclusion criteria for literature reviews were based upon the year of publication and relevance of literature reviewed. Empirical studies were evaluated on variables analyzed, location of the study, and the relevance of the sample used. The significance of the findings and limitations of the conclusions are discussed based off of these variables.
Effects of Health Education in Schools on Outcomes
Adolescence is a challenging period filled with threats to health and well-being that often result in extremely negative consequences and are a direct result of adolescent life-style practices. Use of alcohol, tobacco, and other substances is beginning at earlier ages. As a result,
adolescents are often more likely to experiment with other risk behaviors, including sexual activity. These risk behaviors can negatively impact their health in a significant way
(DiClemente, 1996). Thus, adolescence should be understood as an opportunity for intervention as it is a critical point in which health-enhancing or health-compromising practices can be learned and permanently adopted long-term. Early interventions, specifically in schools, can allow students to address these health risks in their adolescence (Caplan & Weissberg, 1989).
to adolescence on adolescent health behavior outcomes. They examined this by comparing outcomes for 3 different groups: full intervention group which received the intervention throughout elementary school, a late intervention that received programming only in grades 5 and 6 (right before adolescence), and a control group that did not receive the intervention. Participation in the full intervention resulted in lower rates of lifetime violence, drinking, and sexual behavior when measured at 18 years of age. As predicted, they found that positive outcomes were greater for the full intervention group, late intervention group, and the control group in that order.
They found that providing health education earlier on influenced adolescent health, but there have been other studies that have examined the effects of education received during adolescence. Gortmaker et. al (1999) conducted a study of Planet Health, aimed at reducing obesity among middle-school youth. They conducted a randomized, controlled field trial of 10 schools in Massachusetts, 5 of which received the intervention and 5 of which were control schools. Over 1,000 6th and 7th grade students from public schools received a school-based intervention, Planet Health, for 2 years where classroom teachers in 4 major subject and physical education incorporated curricula. These sessions focused on decreasing television viewing and consumption of high-fat foods and increasing fruit and vegetable intake and physical activity. Control schools received their typical health curricula and PE classes without any of the Planet Health program components. Obesity prevalence among female students in the control schools increased from 21.5% to 23.7% over the 2 school-year intervention periods, while the
intervention schools prevalence declined from 23.6% to 20.3%. Obesity prevalence among male students declined in both control and intervention schools, and there was no significant
students over 2 school years, affirming that school-based health education is a promising approach to reducing obesity among youth.
Other adolescent health-risk behaviors include smoking, drinking alcohol, and drug abuse. Rundall & Bruvold (1988) conducted an analysis of 47 smoking and 29 alcohol school-based interventions published after 1970. Results, overall, imply that smoking and alcohol programs have moderate effects on health behavior outcomes. Smoking interventions, however, proved to be more successful than alcohol interventions in affecting long term behavior. Each of the alcohol programs and all but one of the smoking programs improved knowledge of the risks of smoking and alcohol. Twenty-nine of the smoking studies and nineteen of the alcohol studies influenced student attitudes towards these behaviors.
To examine adolescent drug abuse, Rosenbaum & Hanson (1998) conducted a
randomized longitudinal field experiment to evaluate the short and long term effects of the Drug Abuse Resistance Education (D.A.R.E.) program on student drug use behaviors. D.A.R.E. is currently the most widely used school-based drug education program, administered in approximately 70% of the nation's school districts, and is thought to be highly effective in stopping and preventing drug abuse through awareness education. This evaluation, however, found that drug usage did not vary as a result of student completing of the D.A.R.E. program. Overall, D.A.R.E. has failed to consistently demonstrate effective prevention of drug use across the nation.
primarily focused on females and revealed that 68 percent of 15-19 year old women have
received formal education about pregnancy, and contraceptive methods, 16% have received only pregnancy education, and 16% have received no formal sexual education at all. This information is limited because the NSFG data does not provide further detail about the depth of instruction. The analysis does not show a significant association between contraceptive education and later initiation of premarital intercourse. Sex education, however, does have an effect on contraceptive knowledge and behavior. Young women who have had formal sex education programs report knowing how to use more contraceptive methods and are more likely to use them relative to young women who did not receive any education. Overall, this analysis reported that neither pregnancy nor contraceptive education influenced significant effects on the decision to engage in premarital intercourse.
National Longitudinal Study of Adolescent to Adult Health
that learned about the problems of being overweight or underweight had a greater impact on student’s weight change efforts than lessons on exercise or diet. Those that learned about the problems of being overweight were more likely to attempt weight loss than to gain weight, while those that learned about being underweight were more likely to attempt losing weight than gaining weight. They had predicted that health education would lead to healthier choices regarding weight change efforts but found that this relationship was not established for all of their measured constructs.
Summary
In this his chapter, 5 empirical studies were reviewed (Table 1). These studies concerned health interventions targeting drug abuse, pregnancy, nutrition, and exercise. Each of the
interventions were school-based and they presented varying adolescent health outcomes. The first study found that an intervention presented to students before adolescence had increased results than when presented to adolescents (Hawkins et. al, 1999). The second study found that a school-based intervention influenced obesity and fruit and vegetable consumption in girls and reduced television viewing among boys and girls (Gortmaker et. al, 1999). Rosenbaum & Hanson (1998) concluded that D.A.R.E. had no significant effects on drug use measures. Dawson (1986) found that sex education influences contraceptive knowledge and behavior but does not have significant effects on sexual activity or pregnancy. Finally, Kilpatrick et. al (1999) used AddHealth to find that learning about being overweight or underweight influenced students to lose weight.
health education and student health risk, this study also analyzes the relationship between lessons taught in schools and the health behavior outcomes of students. This research, however, focuses primarily on adolescents in grades 7-12 and uses the AddHealth data to analyze self-reported learning in school, instead of interventions.
With increased technology, peer pressure, and accessibility, adolescent health risks have only increased. Schools are seen as influential environments that can prepare students to
CHAPTER III: METHODS
Introduction
This research study analyzes the relationship between health education taught in schools and health behavior outcomes of student respondents. This chapter describes the methodology for examining the association between various health lessons on a variety of outcomes: nutrition, body image, exercise, and decisions to drink alcohol, smoke, use drugs, or engage in sexual activity. First, a cross-sectional analysis was performed using the data from Wave I of AddHealth and applying it to the following multiple regression model:
Outcomei = βo + β1HealthLessoni + β2sex + β3race + ϴigradelevel + 𝜀 (1)
In this model, outcome is the reported adolescent health behavior, and health lesson is the respective health lesson taught in school. Additional coefficients for student sex, race, and grade level are included as control variables. The coefficient (ϴ) of grade level functions as a vector of grade levels: eighth, ninth, tenth, eleventh, and twelfth grade. Grade 7 is omitted for comparison purposes.
Then a second analysis was conducted using the same multiple regression model as Equation (1) to compare the association between learning about each health lesson in Wave I to the same health behaviors of respondents in Wave II. Wave II data allows an analysis of subsequent outcomes to determine if there are changes in behavior a year later. This chapter describes the data used and details the key predictors and outcomes in each of the multiple regression models conducted.
Data
States that were followed through adolescence and adulthood (Harris et. al, 2009). The AddHealth cohort has been followed with four in-home interviews in 1994-1995, 1996, 2001-2002, and 2008-2009. This research study performs both a cross-sectional analysis using the publicly available data from Wave I of AddHealth conducted from 1994-1995 and a longitudinal study using data from both Wave I and Wave II of AddHealth.
In Wave I, the survey collected data on overall well-being of respondents in relation to their various influential relationships. Using a school-based design, AddHealth took a stratified sample of 80 high schools, defined as schools with an 11th grade and more than 30 students. Schools were stratified by region, urbanity, school type, ethnic mix, and size. For every high school selected, feeder schools were identified and recruited to also participate in the study. Ultimately, 132 schools were included in the sample all over the U.S. Adolescents received an in-school questionnaire and then random respondents were administered an in-home interview. This study will use both the in-school and in-home data to analyze relationships, but it will mainly focus on the responses of the in-home interviews.
In Wave II, the survey conducted follow-up in-home interviews with adolescents from Wave I in 1996. Respondents who were in the 12th grade during Wave I were not re-interviewed at Wave II. Additionally, 65 new adolescent who were not interviewed during Wave I were interviewed during Wave II. Though the in-home interview was similar to that of Wave I, questions about sun exposure and detailed nutrition questions were added, and the section on what students learned in schools was omitted.
connection between health education provided by school systems and their significance on health behavior outcomes of student respondents.
Sample weights
Schools and students were sampled to create a nationally representative sample population of adolescents in the United States. Sample weights are used to correct for the differences in selection probabilities of different cases, such as ethnicity or response rates across subgroups. In the analysis, I utilize the sample weights in descriptive statistics as well as regression analysis using the survey commands in STATA.
Key Predictors
In the first wave of study, AddHealth administered an in-home questionnaire, asking students about all aspects of life, including what they were taught in school. For example, students were asked: “Please tell me whether you have learned about each of the following things in a class at school.” The following items are the answer choices included in the questionnaire:
the foods you should and should not eat
the importance of exercise
smoking
the problems of being overweight
drinking
drug abuse
pregnancy
AIDS
what to do if a stranger approaches you taking care of your teeth
what to do if someone chokes on food safety at home, school, or play
stress
how to handle conflict
where to go for help with a health problem
the problems of being underweight
This analysis will provide descriptive analyses of the overall prevalence of health lessons provided by schools according to respondents, focusing on the bolded topics above.
Each of these health lessons is coded as equal to 1 if the respondent answered yes to the question, and equal to 0 if the respondent answered no. Respondents who did not answer the question are coded as missing.
Outcome Measures
This analysis will first study the association between the prevalence of health lessons taught in schools and the overall general health of the student respondent as defined by the respondent. The key predictor, or independent variable, will be whether or not each of these lessons is taught in schools. The outcome measure will be:
The response to the question, “In general, how is your health?”
Answer choices included “excellent”, “very good”, “good”, “fair”, or “poor”. The variable is recoded such that students who responded with excellent, very good, or good health are coded as 1, and students that responded with fair or poor are coded as 0. Respondents who answered the question with multiple responses are coded as missing.
The same outcome variable was measured in Wave II of AddHealth. The variable was reconstructed in the same manner to measure the association between prevalence of health lessons taught in Wave II and the general health of the student respondent as reported in Wave II. Nutrition and Fitness
learned “the foods you should and should not eat.” The outcome measure will be a constructed variable of the responses to the following questions:
“How often did you drink milk, or eat yogurt, or cheese yesterday?” “How often did you eat fruit or drink fruit juice yesterday?”
“How often did you eat vegetables yesterday?”
“How often did you eat bread, cereal, pretzels, rice, or pasta yesterday?” “How often did you eat cookies, doughnuts, pie, or cake yesterday?”
Students responded to these questions with these responses: “did not eat,” “ate once,” or “ate twice or more.” The United States Department of Agriculture’s (USDA) recommends that girls and boys 12-18 should consume approximately 3 servings (cups) of dairy, 1.5-2 servings (cups) of fruit, 2.5-3 servings (cups) of vegetables, 6-8 servings (ounces) of grains daily. The USDA also suggests that a small amount of empty calories is acceptable, but that intake should be reduced to 0-1 servings a day. Based off of these recommendations, a variable was constructed to represent respondents as those who met the USDA’s nutrition guidelines and those who did not. Respondents were coded as equal to 1 if they did follow USDA nutrition guidelines, or ate dairy twice or more, fruits twice or more, vegetables twice or more, grains twice or more, and ate empty calories once or not at all. Respondents that did not meet this criteria were coded as 0, and those who refused to answer or did not know are coded as missing.
Since a more detailed nutrition section was added to the in-home questionnaire of Wave II, the same outcome variables were not measured and, thus, this study will not consider the impact of learning about proper nutrition on the respondent’s diet in Wave II.
“How do you think of yourself in terms of weight?”
Answer choices included: “very underweight”, “slightly underweight”, “about the right weight”, “slightly overweight”, “very overweight”. This variable is reconstructed such that students that answered about the right weight are coded as 0, students that answered very underweight, slightly underweight, slightly overweight, or very overweight are coded as 1.
Then, this analysis will determine the association between health education targeting fitness and the overall fitness of the students. The relationship between whether students reporting learning about exercise in school and how many times they reported exercising in a week will be analyzed. The key predictor will be if students were taught “the importance of exercise” in school. The outcome measure will be the response to the following question:
“During the past week, how many times did you exercise, such as jogging, walking, karate, jumping rope, gymnastics or dancing?”
Answer choices included not at all, 1 or 2 times, 3 or 4 times, or 5 or more times. This variable is reconstructed such that students that responded not at all are coded as 0, and students that responded 1 or 2 times, 3 or 4 times, or 5 or more times are coded as 1. Respondents that refused to answer or did not know are coded as missing.
To better understand the associations between nutrition, fitness, and body image, this study will analyze the relationships between learning about nutrition on reported body image and learning about fitness on reported body image.
Health-Risk Behaviors
used drugs, or engaged in sexual intercourse. The key predictors are whether respondents reported learning about smoking, drinking, and drug abuse, and pregnancy in school. The outcome measures will be the answers to the following questions:
“Have you ever tried cigarette smoking, even just 1 or 2 puffs?”
“Have you ever smoked cigarettes regularly, that is, at least 1 cigarette every day for 30 days?”
“Have you had a drink of beer, wine, or liquor - not just a sip or taste of someone else's drink - more than 2 or 3 times in your life?”
“How old were you when you tried marijuana for the first time?”
“How old were you when you tried any kind of cocaine-including powder, freebase, or crack cocaine- for the first time?”
“How old were you when you tried inhalants, such as glue or solvents, for the first time?” “How old were you when you first tried any other type of illegal drug, such as LSD, PCP,
ecstasy, mushrooms, speed, ice, heroin, or pills, without a doctor's prescription?”
“Have you ever had sexual intercourse? When we say sexual intercourse, we mean when a male inserts his penis into a female's vagina?”
“Have you ever been pregnant?”
Respondents are coded 1 if they ever tried smoking and coded 0 if they have not. All other responses are coded as missing. Smoking cigarettes regularly is also binary as respondents are coded 1 if they have ever smoked cigarettes regularly and 0 if they have not. All other responses are coded as missing.
Respondents that have had a drink of beer, wine, or liquor more than 2 or 3 times are coded as 1, and those who have not are coded as 0. All other responses are coded as missing.
The drug abuse variables are recoded such that if the respondents have never tried marijuana, cocaine, inhalants, or other illegal drugs, respectively, they are coded as 0 and if they have tried it they are coded as 1. All other respondents are coded as missing.
The in-home questionnaire administered during Wave II measured the same outcome variables for smoking, drinking, drug abuse, and sexual activity. In Wave II, instead of asking if the respondent had ever engaged in any of these activities, the questionnaire asked if the student had engaged in these health-risk behaviors since the month of their last interview (excluding the question about whether the respondent had ever been pregnant). Each of these variables were reconstructed in the same manner as aforementioned to consider the association between lessons learned in Wave I on the behaviors recorded in Wave II.
Control Variables
With the understanding that adolescent health behaviors are not only influenced by lessons taught in school, this analysis conducts the regression model holding other variables constant. Control variables that have been controlled include student gender, race, and grade level. All respondents that identify as female are coded as 1, while males are coded as 0. For student race, all respondents that identify as African American are coded as 1 while all other non-African American respondents are coded as 0. For each grade level, 7-12, respondents that are in each respective grade level are coded as 1 while students who are not in that grade level are coded as 0. All other responses for each control variable are coded as missing.
Additionally, in the cases of smoking, drinking, and drug abuse, this study controls for peer effects. In both Wave I and Wave II of AddHealth, the study asked respondents if their friends also engaged in risky behaviors, posing these questions:
“Of your three best friends, how many smoke at least one cigarette a day?” “Of your three best friends, how many drink alcohol at least once a month?” “Of your three best friends, how many use marijuana at least once a month?”
CHAPTER IV: RESULTS
Introduction
The purpose of this study is to analyze the association between health education taught in schools and adolescent health behavior outcomes for 7th-12th grade students. There were eight main lesson topics and outcomes associated with each of them. Each relationship was tested with a series of regression analyses.
Descriptive Statistics
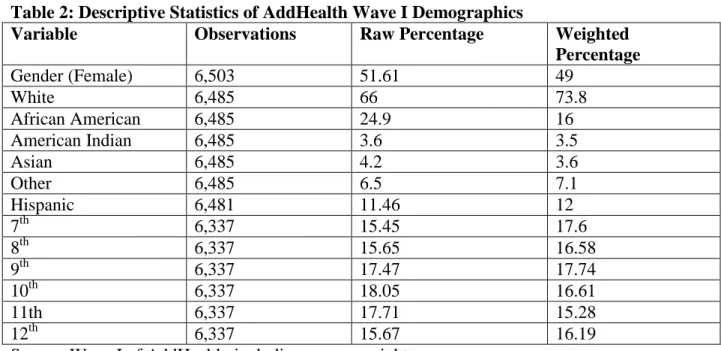
In the raw, unweighted data of Wave I respondents were 52% female, 25% African American, and 11% Hispanic. The sample of data includes a maximum 6,504 respondents from grades 7-12 (approximately ages 12 to 18). With the use of sample weights, the sample was 49% female, 16% African American, and 12% Hispanic. Approximately 98% of respondents identified as currently in school. 17% of respondents were in 7th, 17% in 8th, 18% in 9th, 17% in 10th, 15% in 11th, and 16% in 12th. This study includes the grand sample weights to account for the survey design. These results are presented in Table 2 of the Appendix.
In the raw, unweighted data of Wave II respondents were 52% female. Ethnic and racial data that did not change were not re-collected in Wave II. The sample of data includes 4,834 students from grades 7-12. With the use of sample weights, the sample was 49% female. 5% were in the seventh grade, 22% in the eighth, 24% in the ninth, 19% in the tenth, 19% in the eleventh, and 16% in the twelfth. These results are presented in Table 3 of the Appendix.
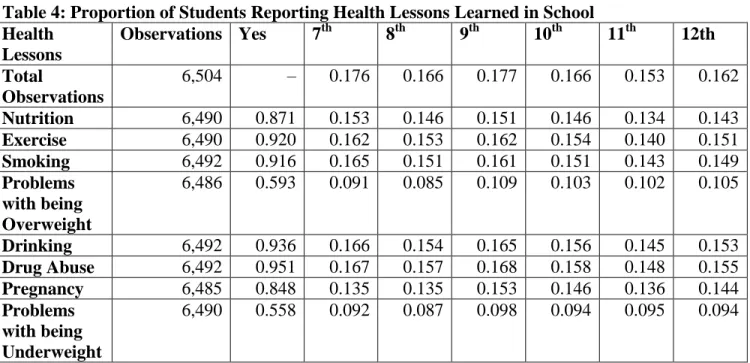
learned are about drinking and drug abuse, and the least prevalent lessons learned are problems with being overweight and problems with being underweight. Overall, 40% of respondents reported receiving all of the eight health lessons that are the focus of this study.
Regression Analyses
The results of each multiple regression can be found in Tables 5a-19d of the Appendix. Four regression analyses were performed for each association in Wave I and Wave II. The first model analyzes the association between the health lesson received and the accompanying health behavior outcome without any covariates. Models 2 and 3 include student gender and race, respectively. The final model includes all of the control variables: student gender, race, and grade-level. In my discussion of the results for Wave I, I will focus on models 1 and 4, comparing the variations after including control variables, and for Wave II I will only consider the results of model 4 compared to model 4 of Wave I. Results of all models can be found in the Appendix.
Overall Health
statistically significant (β=0.011, p<0.05). Being female or African American were negatively associated with having good health but also not statistically significant (0.006, p>0.05; β=-0.000,p>0.05).
Of the students who received all 8 health lessons in Wave I, approximately 38% reported having good, very good, or excellent health (Table 5c). As seen in Table 5d, when the same association was studied on Wave II reports of overall health, the association between receiving all health lessons and overall respondent health was positively statistically significant (β=0.023, p<0.05). This means that students who reported receiving all 8 health lessons in Wave I were 2.3 percentage points more likely to report good overall health in Wave II.
Nutrition
Of the 6,490 respondents, 87.1% of students reported learning proper nutrition in school. Based off of USDA nutrition guidelines, student responses were reconstructed to represent those that met the USDA nutrition guidelines and those that did not (as described in Chapter 3). Of the 6,496 observations, 8.17% of students met USDA nutrition guidelines. Table 6a presents that out of the students that learned about proper nutrition in schools, only 7.6 percent of them met USDA nutrition guidelines.
statistically significant (β = -0.044, p<0.05). This means that African Americans, holding all else constant, were less likely to report eating properly than their non-African American peers. As aforementioned in Chapter 3, an analysis of Wave II behavior outcomes for nutrition could not be conducted because the necessary observations were not recorded.
Body Image
Of the 6,486 respondents, 45.31% of students learned about the problems of being overweight and the problems of being underweight. 52% of respondents stated that they thought of their weight as "about the right weight," while 48% of respondents categorized their weight as slightly or very underweight or slightly or very overweight. Of the students that learned about both the problems of being overweight and underweight, about 24% reported a good body image (Table 7a).
Being female was negatively associated with reporting a good body image and statistically significant (β=-0.057, p<0.05) while being African American was positively associated with reporting a good body image and also statistically significant (β=0.061, p<0.05). This means that females are 5.7 percentage points more likely to struggle with body image than male counterparts while African American students are 6.1 percentage points more likely to have good body image compared to non-African American peers.
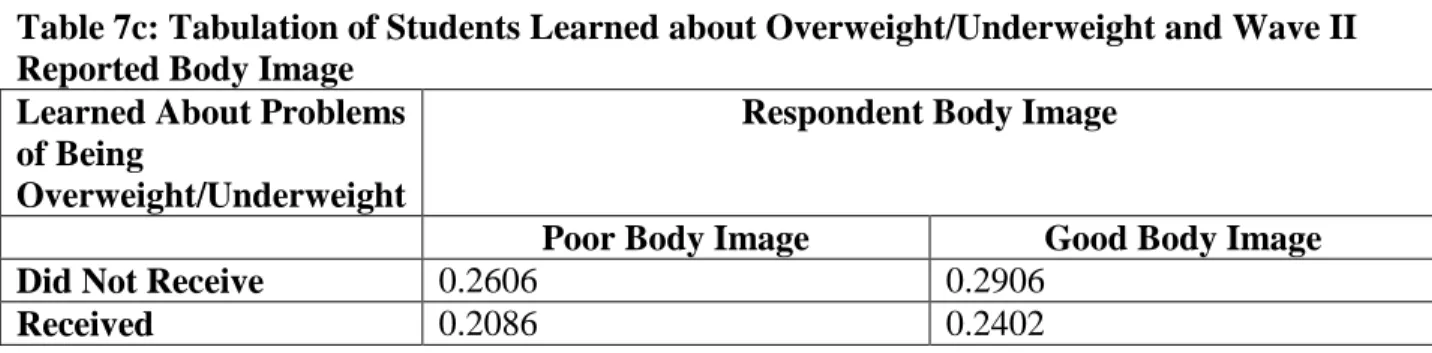
Of the students who learned about the problems of being overweight or underweight in Wave I, 24% reported a good body image (Table 7c). Table 7d shows that the association between learning about the problems of being overweight and underweight and student reported body image was not statistically significant in Wave II (β =0.026, p>0.05).
Fitness
Approximately 92% of students reported learning about fitness in school. Of 6,498 respondents, 82.7% reported exercising one or more times in the past week. Table 8a shows that of the students who learned about the importance of exercise, 76.6% of them reported having exercised that week.
Out of the respondents who reported learning about the importance of exercise in Wave I, 78% were physically active in Wave II (Table 8c). Unlike in Wave I, in Wave II of AddHealth the association between learning about fitness and student activity levels was not statistically significant (β =-0.005, p>0.05) (Table 8d).
Nutrition & Fitness on Body Image
Tables 9b and 10b show that the associations between learning about nutrition and learning about fitness in were not statistically significantly associated with body image in Wave I. Table 10d, however, shows that the association between learning about fitness in Wave was positively statistically significantly associated with student reported body image in Wave II ( =0.095, p<0.05). Thus, students who received fitness lessons in Wave I were 9.5 percentage points more likely to report a good body image in Wave II. This suggests that learning about the importance of exercise is positively correlated with a healthy body image.
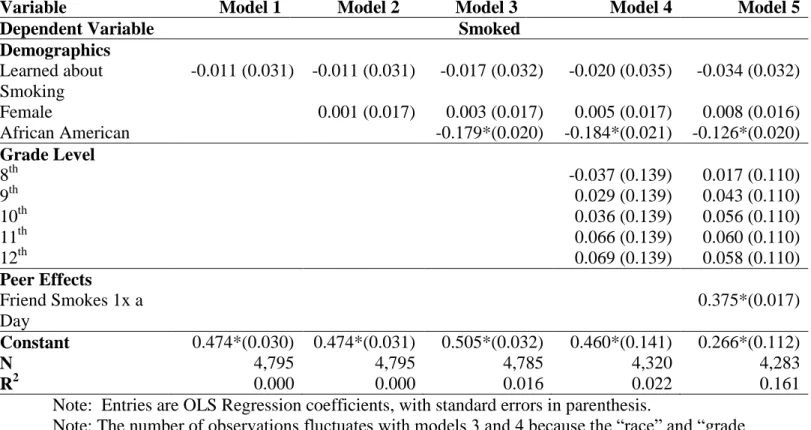
Smoking
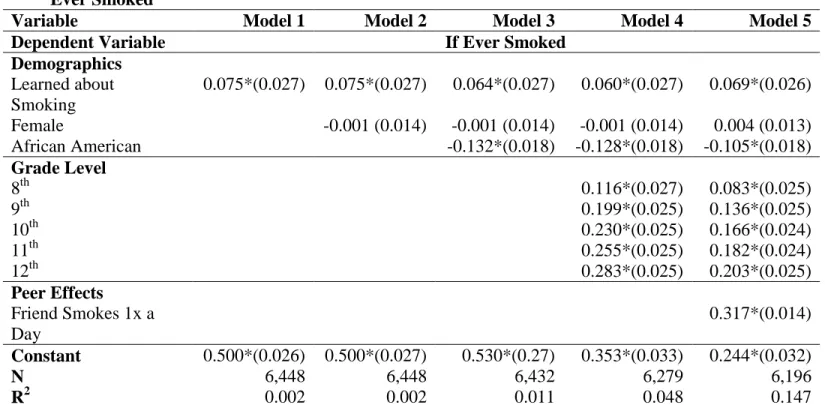
Approximately 92% of respondents reported learning about the problems of smoking in school. About 56.79% of students reported having ever smoked a cigarette at least once. Of the students who learned about smoking, 52.6% of them reported having ever smoked a cigarette (Table 11a).
In model 4, being African American was negatively associated with ever having smoked a cigarette and statistically significant (β=-0.128, p<0.05). It is interesting to note that being in 8th-12th grade is positively associated with ever having smoked compared to 7th graders, all associations statistically significant. This suggests that older students (i.e., in higher grades) have a higher propensity to smoke than their younger counterparts.
Even after adjusting for peer effects (whether the respondent had 1-3 best friends who smoked at least one cigarette a day) in model 5, the association was still positively statistically significant and the percentage points increased (β=0.069, p<0.05). In Wave II, however, the association between learning about smoking and having smoked a cigarette since the month of the respondent’s last interview was not statistically significant (β =-0.034, p>0.05), even when controlling for peer effects. Approximately 43% of respondents who had learned about smoking had smoked a cigarette since the month of their last interview (Table 11c).
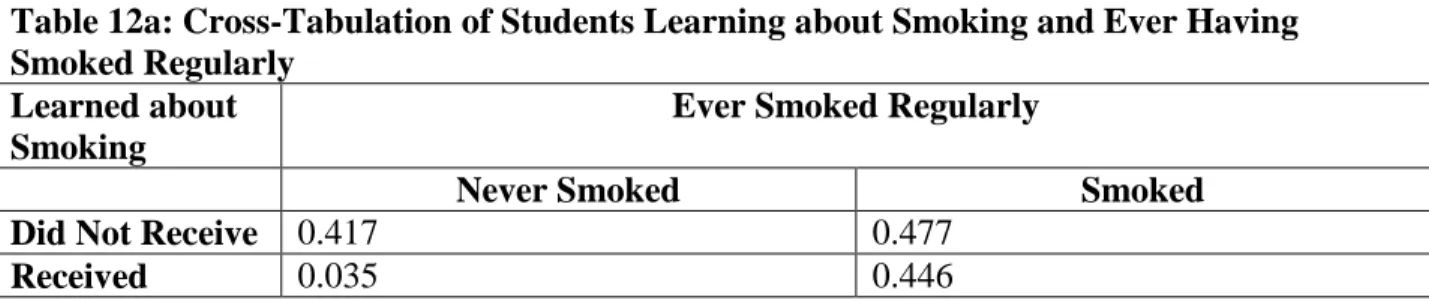
The previous regression series shows that learning about the problems of smoking in school is positively associated with adolescents ever having smoked a cigarette. To understand if learning about smoking in schools is associated with adolescents having smoked cigarettes more than once, this study analyzed students who reported smoking regularly. Students who had ever tried smoking a cigarette were then asked if they have ever smoked cigarettes regularly, as in at least 1 cigarette every day for 30 days. Approximately 48.17% of respondents reported having ever smoked cigarettes regularly. Of those students that learned about smoking, 44.6% reported having ever smoked cigarettes regularly (Table 12a).
R2=0.045, β=0.029, and p>0.05. This means that learning about smoking is positively associated with students having smoked regularly but not statistically significant..
Being African American, however, was statistically significant and negatively associated with ever having smoked a cigarette regularly. This means that African American students were 20.5 percentage points less likely to have ever regularly smoked than their non-African American peers. Again, being in 8th-12th grade is positively associated with ever having smoked regularly compared to 7th graders, all associations statistically significant.
Of students who learned about smoking, 44% reported having smoked regularly since the month of their last interview (Table 12c). Table 12d shows that the relationship was still not statistically significant in Wave II (β=0.052, p>0.05).
Drinking
Approximately 94.6% of students reported learning about drinking in a classroom, and 55.71% of students reported having tried alcohol more than 2 or 3 times. Table 13a presents that out of the students who learned about drinking, approximately 52% have ever tried alcohol. This regression analysis tested the association between learning about drinking in school and having consumed alcohol more than 2 or 3 times (Table 13b).
Model 1 of Table 13b shows that learning about drinking is positively associated with having ever tried alcohol but not statistically significant (β=0.026, p>0.05). Model 4 produced R2=0.089, β=-0.008, and p>0.05. This indicates that learning about alcohol is negatively associated with ever having tried alcohol; however, the relationship is not statistically significant.
means that students who are female or African American are less likely to have ever tried alcohol than their peers, regardless of having learned about drinking in school. Being in 8th-12th grade is positively associated with ever having tried alcohol compared to 7th graders, all associations statistically significant. This suggests a higher likelihood of drinking alcohol at higher grade levels, which could be due to increased exposure and accessibility at older ages.
After controlling for peer effects in Model 5, the relationship between learning about alcohol and ever having tried alcohol was still not statistically significant (β=-0.006, p>0.05). However, the relationship between having 1-3 friends that drank alcohol at least once a month on ever having tried alcohol was statistically significant (β=0.419, p<0.05). This suggests that peers engaging in risky behavior have an effect on student health choices.
Approximately 47% of students who had learned about drinking in Wave I reported having had alcohol since the month of their last interview (Table 13c). Table 13d shows that the association between learning about alcohol and drinking alcohol was still not statistically significant in Wave II (β=0.029, p>0.05). The association between peer engagement and trying alcohol was statistically significant (β =0.435, p<0.05).
Drug Abuse
analyses to test the association between learning about drug use and abuse in school and ever having tried marijuana, cocaine, inhalants, or other illegal drugs.
Marijuana
In model 1 of Table 14b, learning about drug abuse is positively associated with having ever tried marijuana, but it is not statistically significant (β=0.010, p>0.05). Model 4 produced R2=0.056, β=-0.004, and p>0.05. This suggests that learning about drug abuse in school is possibly negatively associated with ever having tried marijuana, but the association is not statistically significant.
In model 4, being female or African American, however, was negatively associated and statistically significant with ever having tried marijuana (β=-0.047, p<0.05; β= -0.033, p<0.05). Regardless of having learned about drug abuse in schools, female or African American students were less likely to have ever tried marijuana. Being in 8th-12th grade is positively associated with ever having tried marijuana compared to 7th graders. This indicates that the propensity to try marijuana increases in older students.
After controlling for peer effects in model 5, the association between learning about drug abuse and ever having tried marijuana was still not statistically significant (β=-0.003, p>0.05). The association between having 1-3 best friends who use marijuana at least once a month and ever having tried marijuana, however, was positively statistically significant (β=0.491, p<0.05). This suggests that peer effects are correlated with students trying marijuana.
Cocaine
In model 1 of Table 15b, learning about drug abuse is negatively associated with ever having tried cocaine, but it is not statistically significant (-0.023, p>0.05). Model 4 produced R2=0.012, β=-0.033, and p<0.05. This means that learning about drug abuse is negatively and statistically significantly associated with ever having tried cocaine. Thus, students who learned about drug abuse in school were 3.3 percentage points less likely to have ever tried cocaine than students who did not.
Being African American was also statistically significant and negatively associated with ever having tried cocaine (β=-0.031, p<0.05). It is interesting to note that being in 8th-12th grade is positively associated with ever having tried cocaine compared to 7th graders, all associations statistically significant. Again, this indicates that the propensity to try cocaine increases in older students.
Approximately 2.5% of students who learned about drug abuse in Wave I reported trying cocaine since the month of their last interview (Table 15c). Table 15d presents that learning about drug abuse and having tried cocaine were not statistically associated in Wave II (β =-0.004, p>0.05).
Inhalants
inhalants than students who did not. Being African American was also statistically significant and negatively associated with ever having tried cocaine (β=-0.045, p<0.05).
Approximately 2% of students who learned about drug abuse in Wave I reported having tried inhalants since the month of their last interview (Table 16c). Learning about drug abuse and trying inhalants were not statistically associated in Wave II (β =-0.021, p<0.05).
Other Illegal Drugs
In model 1 of Table 17b, learning about drug abuse is positively associated with ever having tried other illegal drugs but is not statistically significant (β=0.012, p<0.05). Model produced R2=0.030, β=-0.006, and p>0.05. The inclusion of control variables changed the association between learning about drug abuse and ever having tried other illegal drugs to negative, but the association is still not statistically significant. Being African American is statistically significant and negatively associated with ever having tried other illegal drugs (β=-0.084, p<0.05).
Approximately 6% of students who learned about drug abuse in Wave I reported having tried other illegal drugs since the month of their last interview (Table 17c). Learning about drug abuse and trying illegal drugs were not statistically correlated in Wave II (β =0.021, p<0.017). Pregnancy
conducts two regression analyses to test the association between learning about pregnancy in school and ever having sex or ever having been pregnant.
In model 1 of Table 18b, learning about pregnancy is positively associated and statistically significant with ever having had sex (β=0.067, p<0.05). This means that students who learned about pregnancy in school were 6.7 percentage points more likely to have had sex than those who had not learned about pregnancy in school. Model 4 produced R2=0.176, β=-0.004, and p>0.05. The inclusion of control variables changed the association between learning about pregnancy and ever having had sex to negative, but the association is not statistically significant.
Being African American is positively associated with ever having had sex and is statistically significant (β=0.221, p<0.05). This means that African American students are 22.1 percentage points more likely to have had sex than non-African American students. Being in 8th-12th grade is positively associated with ever having had sex compared to 7th graders, all associations statistically significant.
Of the students who learned about pregnancy in Wave I, 36% reported ever having sex (Table 18c). Learning about pregnancy and having sex were still not statistically significant in Wave II (β=-0.006, p>0.05).
pregnant, but it is not statistically significant. Being African American, however, is statistically significant and positively associated with ever having been pregnant (β=0.128, p<0.05). This means that African American, female students are 12.8 percentage points more likely to ever have been pregnant than non-African American female students.
Of the female students who learned about pregnancy in Wave I, 19% reported ever having been pregnant (Table 19c). Learning about pregnancy and ever having been pregnant were still not statistically significant in Wave II (β=-0.033, p>0.05).
Summary
This chapter presented the results of the 15 ordinary least squares multiple regression analyses conducted to test the associations between 8 health lessons received in schools and the respective health behavior outcomes in Wave I.
Out of the 15 multiple regression analyses conducted, 6 associations were statistically significant. Learning about proper nutrition was positively associated with eating properly. Learning about the problems of being overweight and underweight was positively associated with having a good body image. Learning about the importance of exercise was positively associated with exercising. Learning about smoking was positively associated with ever having smoked. Learning about drug abuse was negatively associated with ever having tried cocaine and also ever having tried inhalants.
Additionally, being in the 8-12th grade was positively correlated with ever having smoked, smoked regularly, tried alcohol, tried marijuana, tried cocaine, and ever had sex compared to being in the 7th grade. This could be a result of increased exposure and accessibility to these risk behaviors with age, but it suggests that more attention should be given to dissuading older students from engaging in these activities.
Additional regression analyses were conducted to understand how receiving these health lessons impacted later behaviors in Wave II. Of these analyses, 2 were statistically significant. Learning about the importance of exercise was positively correlated with a reporting a good body image, and receiving all 8 health lessons was positively associated with reporting a good overall health in Wave II.
CHAPTER V: CONCLUSIONS
Introduction
This study conducted multiple ordinary least square regression analyses using the publically available National Longitudinal Study of Adolescent to Adult Health data to determine the associations between health lessons taught in school and adolescent health behavior outcomes. Literature relevant to school-based health interventions and their outcomes were studied to understand the effectiveness of school-based health education. This study further contributes to this literature because it analyzes direct lessons taught in schools, rather than interventions, and their effects on self-reported health behavior outcomes of adolescents.
Discussion
Of the 15 multiple regression analyses conducted, 6 associations were statistically significant. The study found that relationships between learning about nutrition, fitness, smoking, and drug abuse and their associated outcomes were statistically significant. This confirms that students who learn about proper nutrition and fitness are more likely to eat a proper diet and exercise. It also means that students who learn about drug abuse are less likely to have ever tried cocaine or inhalants. Additionally, the findings showed that learning about smoking meant it was more likely that students have ever tried smoking a cigarette.
Of the Wave II analyses, 2 were statistically significant. Learning about the importance of exercise was positively correlated with reporting a health body image, receiving all 8 health lessons in Wave I was positively correlated with reporting a good overall health in Wave II. These positive correlations suggest that certain health lessons continue to have an impact over time.
This study uses the publically available data from AddHealth, which includes one-half of the core sample included in the restricted use data, chosen at random. As a result, each of the analyses conducted in this study relied on a smaller sample size than the original AddHealth data includes. The observations, however, are still nationally representative because of the use of survey weights. Additionally, the public use data did not allow for controlling for all of the ideal covariates. This study would have liked to also have controlled for parent income, neighborhood characteristics, school type, and parental variables, but this information was not available.
This study relies on data collected from questionnaires. Though questionnaires are useful for large samples, they collect self-reported data rather than observed activity. Each of the health lessons, or independent variables, were self-reported and not specific to grade level. Instead, students were asked to mark if they had ever received each health lesson, rather than if they had received a particular health lesson within a specific period of time or in a certain grade level. Thus, identifying causality was made difficult because there was not a clear direction in time.
Additionally, student health and student body image were self-reported variables, meaning that students responded with their perceptions. Perceptions do not always match reality, thus having observed data on respondent health or respondent weight would have made the analyses between receiving all health lessons and overall health and receiving lessons on problems of being overweight and underweight and body image stronger.
of weekly student activity instead of activity just within the past week would have been stronger data to analyze as well.
Finally, despite the controls included in the regression models, it is possible that omitted factors remain that are both correlated with health lessons and self-reported health behavior outcomes. Since this was primarily a cross-section analysis, I was unable to study the health lessons over a long period of time. Access to panel data information with reported health lessons also measured in Wave II and not just Wave I would have made the analyses stronger because I could have controlled for individual, specific factors. Each of these associations can only be interpreted as correlational and not necessarily causal. A causal relationship would imply that receiving a particular health lesson directly caused the respondent's health behavior outcome. There may be other omitted factors that both influence an individual’s likelihood of receiving health lessons in school that also influence the individual outcomes. Thus, I can only interpret the correlational relationship, or the extent to which the variables of receiving health lessons and the adolescent health behavior outcome move together. This weakness in my statistical analysis makes it harder to determine the direct effects of health lessons taught in school on adolescent health behavior outcomes. Thus, in what I have presented, I caution the reader about causal interpretation, and focus on the relationships between the variables as correlational.
Future Research
While existing research examines the relationships between school-based health interventions and adolescent health behavior outcomes, there is use in further researching how school health education influences adolescent health behavior outcomes.
this scale again in today’s society to account for how health education has evolved. Though AddHealth is longitudinal, it did not include the “Taught in School” section of its questionnaire after Wave I. Implementing a panel nature similar to AddHealth that follows adolescents from 7th-12th grade, asking the same questions each year, would better confirm the relationship between health lessons taught in school and the health choices adolescents make.
The most alarming result of this study was that learning about smoking had a positive association on adolescents ever having smoked a cigarette. Further research should be conducted to discover if education on smoking is actually increasing the likelihood that adolescents will every smoke a cigarette in their lifetime. Although this negative association could have been due to omitted factors in the publically available dataset, the relationship should still be analyzed again.
Policy Implications
Although not all associations were found to be significant, statistically significant findings did exist for certain health lessons (nutrition, fitness, body image, smoking, and drug abuse). Thus, certain health lessons can be generally associated with positive adolescent health behavior outcomes. Additionally, learning about exercise and receiving all 8 health lessons were positively correlated with good body image and good overall health respectively.
lessons should be structured to help students not only learn about these risky behaviors but to also learn how to deal with increased health pressures as they get older.
After understanding when these health lessons are specifically taught in schools, as in at what grade level and in which settings, and the outcomes associated with those health lessons, it will be easier to replicate the health education methods across school systems. School districts could incentivize schools in their regions to include these health lessons in their curriculum. Additionally, schools could incentivize their teachers, across all grade levels and subject matters, to integrate at least one health lesson into their curriculum once a week. School health and physical education classes could be re-examined to see if they are addressing all of the components of a holistic health education: nutrition, fitness, body image, smoking, drinking, drug abuse, and pregnancy.
Summary
REFERENCES
Bloom B, Jones LI, Freeman G. Summary health statistics for U.S. children:
National Health Interview Survey, 2012. National Center for Health Statistics. Vital Health Stat 10(258). 2013.
Caplan, M. Z., & Weissberg, R. P. (1989). Promoting social competence in early adolescence: Developmental considerations. In Social competence in developmental perspective (pp. 371-385). Springer Netherlands.
Dawson, D. A. (1986). The effects of sex education on adolescent behavior. Family Planning Perspectives, 162-170.
DiClemente, R. J., Hansen, W. B., & Ponton, L. E. (1996). Adolescents at risk. In Handbook of adolescent health risk behavior (pp. 1-4). Springer US.
Gortmaker, S. L., Peterson, K., Wiecha, J., Sobol, A. M., Dixit, S., Fox, M. K., & Laird, N.
(1999). Reducing obesity via a school-based interdisciplinary intervention among youth: Planet Health. Archives of pediatrics & adolescent medicine, 153(4), 409-418.
Harris, Kathleen Mullan, and J. Richard Udry. National Longitudinal Study of Adolescent to Adult Health (Add Health), 1994-2008 [Public Bibliographic Citation: Use].
ICPSR21600-v15. Chapel Hill, NC: Carolina Population Center,University of North Carolina-Chapel Hill/Ann Arbor, MI: Inter-university Consortium for Political and Social Research [distributors], 2014-05-14. http://doi.org/10.3886/ICPSR21600.v15
Hawkins, J. D., Catalano, R. F., Kosterman, R., Abbott, R., & Hill, K. G. (1999). Preventing adolescent health-risk behaviors by strengthening protection during childhood. Archives of pediatrics & adolescent medicine, 153(3), 226-234.
and perceptions: an analysis of the National Longitudinal Study of Adolescent Health. Journal of School Health, 69(4), 148-152.
MacKay AP, Duran C. Adolescent Health in the United States, 2007. National Center for Health Statistics. 2007
Rosenbaum, D. P., & Hanson, G. S. (1998). Assessing the effects of school-based drug education: A six-year multilevel analysis of Project DARE. Journal of Research in Crime and
Delinquency, 35(4), 381-412.
Ruglis, J., & Freudenberg, N. (2010). Toward a healthy high schools movement: strategies for mobilizing public health for educational reform.American journal of public
health, 100(9), 1565.
Rundall, T. G., & Bruvold, W. H. (1988). A meta-analysis of school-based smoking and alcohol use prevention programs. Health Education & Behavior, 15(3), 317-334.
Symons, C. W., Cinelli, B., James, T. C., & Groff, P. (1997). Bridging student health risks and academic achievement through comprehensive school health programs. Journal of school
Health, 67(6), 220-227.
Weissberg, R. P., & Elias, M. J. (1993). Enhancing young people's social competence and health behavior: An important challenge for educators, scientists, policymakers, and
APPENDIX
Table 1: Summary of Empirical Studies Included In Literature Review
Author Design Participants Intervention Outcome Measure Results Hawkins et. al
(1999)
Nonrandomized controlled trial with 6 year follow-up
5th grade students from public elementary schools in Seattle, Washington Teacher training, parent education, and social competence about adolescent health
Substance use, sexual activity, pregnancy
Full intervention: Fewer students reported heavy drinking, sexual intercourse, multiple sexual partners, and pregnancy
Late Intervention: No significant effect on health-risk behaviors Gortmaker et.
al (1999)
Randomized controlled field trial with 5 interventions and 5 control schools
1,295 ethnically diverse 6-7 grade students from public schools in Massachusetts
School-based intervention over 2 school years targeting obesity factors
Body mass index and a triceps skinfold, television viewing, consumption of high-fat foods, fruit/vegetable intake, increasing moderate/vigorous activity
Obesity among girls reduced; Reduced television viewing among boys and girls; Increased fruit/vegetable consumption among girls Rosenbaum & Hanson (1998) Randomized longitudinal field experiment
1,798 6th-12th grade students Drug Abuse Resistance Education program (D.A.R.E.) Students’ attitudes, beliefs, social skills, and drug use behaviors
D.A.R.E. had no long-term effects on a wide range of drug use measures; short-term effects dissipated by conclusion of study Dawson (1986) 1982 National Survey of Family Growth
Sample of women aged 15-44 in U.S.
Formal sex education about pregnancy and birth control
Teenager’s initiation of premarital intercourse, knowledge/use of contraceptive methods, experience with premarital pregnancy
Sex education influences contraceptive
knowledge/behavior; Other results not significant
Kilpatrick et. al (1999) National Longitudinal Study of Adolescent Health
6,500 7th-12th grade students
School Health Education
Weight Change Efforts, Diet, Exercise
Table 2: Descriptive Statistics of AddHealth Wave I Demographics
Variable Observations Raw Percentage Weighted
Percentage
Gender (Female) 6,503 51.61 49
White 6,485 66 73.8
African American 6,485 24.9 16
American Indian 6,485 3.6 3.5
Asian 6,485 4.2 3.6
Other 6,485 6.5 7.1
Hispanic 6,481 11.46 12
7th 6,337 15.45 17.6
8th 6,337 15.65 16.58
9th 6,337 17.47 17.74
10th 6,337 18.05 16.61
11th 6,337 17.71 15.28
12th 6,337 15.67 16.19
Source: Wave I of AddHealth, including survey weights
Table 3: Descriptive Statistics AddHealth Wave II Demographics
Variable Observations Raw Percentage Weighted
Percentage
Gender (Female) 4,834 52.1 49.3
7th 4,834 0.5 0.52
8th 4,834 17.1 22.05
9th 4,834 18.3 24.46
10th 4,834 18.2 19.64
11th 4,834 18.8 19.41
12th 4,834 17.3 16.92
Table 4: Proportion of Students Reporting Health Lessons Learned in School Health
Lessons
Observations Yes 7th 8th 9th 10th 11th 12th
Total
Observations
6,504 – 0.176 0.166 0.177 0.166 0.153 0.162
Nutrition 6,490 0.871 0.153 0.146 0.151 0.146 0.134 0.143
Exercise 6,490 0.920 0.162 0.153 0.162 0.154 0.140 0.151
Smoking 6,492 0.916 0.165 0.151 0.161 0.151 0.143 0.149
Problems with being Overweight
6,486 0.593 0.091 0.085 0.109 0.103 0.102 0.105
Drinking 6,492 0.936 0.166 0.154 0.165 0.156 0.145 0.153
Drug Abuse 6,492 0.951 0.167 0.157 0.168 0.158 0.148 0.155
Pregnancy 6,485 0.848 0.135 0.135 0.153 0.146 0.136 0.144
Problems with being Underweight
6,490 0.558 0.092 0.087 0.098 0.094 0.095 0.094
Table 5a: Cross-Tabulation of Students Receiving All Health Lessons and Their Reported Overall Health
All Health Lessons
Overall Health
Fair/Poor Health Good/Very Good/Excellent Health
Did Not Receive 0.0425 0.5405
Received All 0.0264 0.3906
Observations: 4,537
Source: Wave I of AddHealth, including survey weights
Table 5b: Ordinary Least Squares Regression Results of Receiving All Health Lessons on Overall Health
Variable Model 1 Model 2 Model 3 Model 4
Dependent Variable
Overall Student Health
Demographics Learned All Health Lessons
0.010 (0.009) 0.010 (0.009) 0.010 (0.009) 0.011 (0.009)
Female -0.005 (0.009) -0.005 (0.009) -0.006 (0.009)
African American 0.000 (0.011) -0.000 (0.011)
Grade Level
8th -0.022 (0.016)
9th -0.034*(0.015)
10th -0.013 (0.014)
11th -0.022 (0.014)
12th -0.015 (0.014)
Constant 0.927*(0.006) 0.929*(0.008) 0.930*(0.008) 0.947*(0.012)
N 4,537 4,537 4,528 4,475
R2 0.000 0.000 0.000 0.002
Note: Entries are OLS Regression coefficients, with standard errors in parenthesis.
Note: The number of observations fluctuates with models 3 and 4 because the “race” and “grade-level” variables are missing in some cases. 7th
grade is the omitted category of grade level. * = Significant at 0.05 p-value
Source: Wave I of AddHealth, including survey weights
Table 5c:Cross-Tabulation of Students Receiving All Health Lessons and Their Wave II
Reported Overall Health All Health
Lessons
Overall Health
Fair/Poor Health Good/Very Good/Excellent Health
Did Not Receive 0.0445 0.5571
Received All 0.019 0.3793
Observations: 4,809
Table 5d: Ordinary Least Squares Regression Results of Receiving All Health Lessons on Wave II Overall Health
Variable Model 1 Model 2 Model 3 Model 4
Dependent Variable
Overall Student Health
Demographics Learned All Health Lessons
0.026*(0.008) 0.028*(0.008) 0.027*(0.008) 0.023*(0.008)
Female -0.030*(0.008) -0.029*(0.008) -0.028*(0.008)
African American -0.011 (0.011) -0.015 (0.012)
Grade Level
8th 0.071 (0.075)
9th 0.090 (0.075
10th 0.088 (0.075)
11th 0.090 (0.075)
12th 0.099 (0.075)
Constant 0.926*(0.006) 0.940*(0.007) 0.942*(0.007) 0.861*(0.075)
N 4,809 4,809 4,799 4,332
R2 0.003 0.007 0.007 0.009
Note: Entries are OLS Regression coefficients, with standard errors in parenthesis.
Note: The number of observations fluctuates with models 3 and 4 because the “race” and “grade-level” variables are missing in some cases. 7th
grade is the omitted category of grade level. * = Significant at 0.05 p-value
Table 6a: Cross-Tabulation of Students Learning about Nutrition and Their Reported Diet Learned
Nutrition
Reported Diet
Did Not Meet USDA Guidelines Met USDA Guidelines
Did Not Receive 0.124 0.006
Received 0.795 0.076
Observations: 6,490
Source: Wave I of AddHealth, including survey weights
Table 6b: Ordinary Least Squares Regression Results of Learning about Nutrition on Reported Diet
Variable Model 1 Model 2 Model 3 Model 4
Dependent Variable
Respondent Diet
Demographics
Learned Nutrition 0.045*(0.009) 0.045*(0.009) 0.041*(0.009) 0.042*(0.009)
Female -0.008 (0.008) -0.008 (0.008) -0.010 (0.008)
African American -0.043*(0.008) -0.044*(0.008)
Grade Level
8th -0.005 (0.015)
9th -0.022 (0.014)
10th -0.022 (0.014)
11th -0.013 (0.014)
12th -0.023 (0.014)
Constant 0.042*(0.008) 0.046*(0.009) 0.055*(0.009) 0.072*(0.014)
N 6,490 6,490 6,474 6,314
R2 0.003 0.003 0.006 0.008
Note: Entries are OLS Regression coefficients, with standard errors in parenthesis.
Note: The number of observations fluctuates with models 3 and 4 because the “race” and “grade-level” variables are missing in some cases. 7th
grade is the omitted category of grade level. * = Significant at 0.05 p-value