Sharif University of Technology
Scientia IranicaTransactions E: Industrial Engineering http://scientiairanica.sharif.edu
Distribution planning of relief commodities considering
the features of demand areas: A robust multi-objective
approach
M.M. Paydar
, H. Molladavoodi, and A.S. Safaei
Department of Industrial Engineering, Babol Noshirvani University of Technology, Babol, Iran. Received 15 May 2017; received in revised form 15 August 2017; accepted 18 December 2017
KEYWORDS Relief logistics; Responsiveness; Evacuation centers; Robust optimization; Revised multi-choice goal programming.
Abstract. Logistics planning plays an important role in providing services to disaster-stricken areas. In this study, a scenario-based multi-objective model is presented to locate distribution and evacuation centers and distribute relief commodities with appropriate allocation. It aims to serve the earthquake-stricken areas that are classied according to their construction qualities. The objective functions of cost, responsiveness, and demand coverage are considered in the proposed optimization model. Moreover, due to the uncertain nature of a disaster and uncertainty in some parameters of the model, a robust optimization approach is utilized. A revised multi-choice goal programming method is applied to solve the multi-objective model. The proposed model is validated through a case study conducted in the city of Amol. The computational results show the eciency of the proposed model in a real-world disaster situation.
© 2018 Sharif University of Technology. All rights reserved.
1. Introduction
Natural disasters, such as earthquake, ood, and drought, harm thousands of people every year and damage residential areas and assets [1]. Over the last century, due to the human intervention in nature as well as deliberate cutting and burning of plants in forests or woodlands to create elds, natural disasters have occurred more frequently [2]. In recent years, many natural disasters have stricken dierent places around the world, e.g., the devastating earthquake in Bam in 2003, a huge tsunami of the Indian Ocean in 2004, which aected fourteen counties, Pakistan oods in 2010, east Azerbaijan earthquakes in 2012, and
*. Corresponding author.
E-mail addresses: [email protected] (M.M. Paydar); [email protected] (H. Molladavoodi); [email protected] (A.S. Safaei)
doi: 10.24200/sci.2017.20009
Pakistan earthquake in 2015. More specically, during 2004 to 2013, the total number of reported disasters was approximately 6,525, and the total number of people killed was 1,059,072 [3].
Earthquake may be one of the most devastating natural disasters. Unfortunately, it often strikes a large area with several regions. It should be noted that direct mortality caused by the earthquake is relatively low. However, it may signicantly increase due to lack of planning to serve the victims. In fact, the proper planning will lessen the damage of disasters; this is the ultimate purpose of \Disaster Management" dened as \all actions done by human beings to deal with disasters and their eects before, during, and after the disaster". Researchers have proposed four phases for relief actions: mitigation, preparedness, response, and recovery. Preparedness and response phases are of special importance. Moreover, relief logistics as new knowledge helps humans deal with disasters in preparedness and response phases [4].
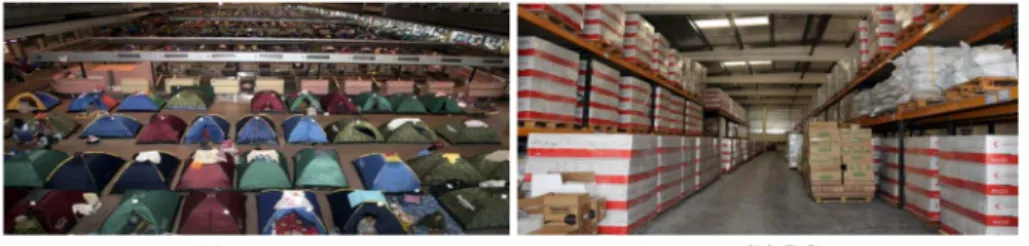
Figure 1. Evacuation Centers (ECs) and Distribution Centers (DCs).
most important features of the relief logistics problems. However, quickly responding to the victims in a situ-ation with high uncertainty is very important. Thus, relief logistics planning coordinates the relief operations with delivery of the relief commodities to reduce the response time [5,6]. Moreover, locating an appropriate location (selecting among the existing ones) in dierent situations is one of the most important decisions in order to utilize optimally the facilities during a disaster. Response time and fatality rate may increase due to the lack of preparation and planning which may translate to failure in properly identifying Evacuation Centers (ECs) and Distribution Centers (DCs), insucient supply, etc. Figure 1 illustrates an example of ECs and DCs.
Moreover, one of the decisions of logistics plan-ning that plays a strategic role in managing disasters is locating the warehouses and storing commodities. It should be noted that location and the number of these centers depend on the characteristics of each region [5]. Therefore, aected areas can be clustered according to the strength of buildings in that region. This factor is of great importance in an earthquake disaster. Likewise, the issues that have received less attention include locating the ECs before the disaster. Introducing these places to people and planning for transportation of relief supplies from the DCs to the ECs during the disaster may improve the service quality to the victims. Furthermore, determining the location and num-ber of ECs and DCs is a signicant decision that the authorities in the disaster management headquarters face. Generally, selecting appropriate locations for ECs and DCs has the following advantages for disaster control managers. It can improve the response time, minimize the intervention of the DCs to make ecient use of these centers, and appropriately assign the DCs to a region considering the setup and operating costs, responsiveness, and demand coverage under dierent scenarios [7].
In this study, a multi-objective optimization model for the supply and distribution of relief com-modities for disaster-stricken regions under environ-mental uncertainty is presented. A robust model is proposed to cope with uncertainty, and a Revised Multi-Choice Goal Programming (RMCGP) method is utilized for solving the proposed multi-objective model.
Figure 2. Diagram of solution approach for the proposed model.
Finally, the model is validated through a case study. Moreover, Figure 2 shows the procedure of applied solution approach in this research.
The rest of this paper is organized as follows. Section 2 gives an overview of the related research in the eld of relief logistics. In Section 3, a mathematical model for a three-level relief chain is formulated, and a linearization procedure is explained, too. In order to solve the proposed model under uncertainty, a robust optimization approach is explained in Section 4. In Section 5, the multi-objective model is solved through RMCGP method and the procedure is described. Com-putational results and \what if . . . ?" analyses are discussed through a case study in Section 6. Finally, conclusions and areas for further research are provided in Section 7.
2. Literature review and research gap
Operations research has been widely applied to disaster management [8]. Because of the high importance of re-lief logistics, numerous research studies have been done in this eld. Besides, plenty of decisions have been/are improvised during disasters [9]. However, only a few studies have been focused on locating the DCs and distributing relief commodities, simultaneously. Current studies related to disaster management can be categorized according to the considered objective (cost, responsiveness, covering), environmental
condi-tion (deterministic, stochastic), decision level (supply, distribution, and demand), and located facility (DCs, ECs).
Toregas et al. (1971) conducted one of the rst studies on locating the relief facilities [10]. They studied the location of the relief facilities and demand coverage in the response phase. In this eld, Alcada-Almeida et al. (2009) [11] focused on the evacuation as one of the most important centers, and proposed a model for evacuation planning during a disaster. Their proposed model includes locating shelters as well as evacuation of primary and backup paths. This model is also applicable to other cases of disaster such as oods and earthquakes.
Mete and Zabinsky (2010) [12] considered the cost and demand uncertainty and presented a stochastic model for the distribution and storage of medical products for managing a possible disaster. In their model, the location of warehouses and inventory levels were considered, too. In another research, Rawls and Turnquist (2011) [13] provided a location and distri-bution model for relief commodities under uncertainty. They proposed a two-stage approach. The rst step locates and determines the storage capacity of relief commodities, and the second step determines the ow of relief commodities in the network.
Caunhye et al. (2012) [14] reviewed the optimiza-tion models utilized in the emergency logistics. Based on this paper, since the rst adoption of research studies on maritime disaster situations in the 1970s, they have considered three separate parts: facility location, relief distribution and casualty transporta-tion, and other operations. They considered short-notice evacuation, facility location, and stock pre-positioning as the main pre-disaster operations, while relief distribution and casualty transportation were categorized as post-disaster operations.
Bozorgi-Amiri et al. (2013) [15] proposed a multi-objective robust model to minimize the total cost and unfullled demand under uncertainty in prepared-ness and response phases of a disaster. Davis et al. (2013) [16] presented a probabilistic model for the distribution of relief commodities from suppliers to their distribution networks. They considered a bi-level mathematical programming approach that solved problems in two steps. In the rst step, locating costs are minimized, and distribution and shortage costs are minimized in the second step. Naja et al. (2013) [17] proposed a dynamic model for dispatching and routing vehicles in response to an earthquake. They consid-ered a multi-objective, multimode, multi-commodity, and multi-period stochastic robust optimization model. They considered two hierarchical objective functions that are concerned with minimizing transit times for both goods and the injured people. Barzinpour and Esmaeili (2014) [18] proposed a multi-objective
mixed-integer linear programming model for preparation of disaster logistics scheduling based on demand area population and damage severity. They applied goal-programming approach to prioritize objectives in order to face the least deviation from goals. For the planning, the worst-case scenario was considered to perform the need estimation and preparation. The model showed improvement in quality of solutions when collabora-tion and cooperacollabora-tion between sub-regions were made. Rezaei-Malek and Tavakkoli-Moghaddam (2014) [19] presented an uncertain model to minimize cost and response time objectives. Their model aimed to dis-tribute relief commodities in the response phase after locating and determining inventories.
Abounacer et al. (2014) [20] considered a three-objective location-transportation problem for disaster response. Three conicting objectives that contain minimization of costs, minimization of number of agents, and minimization of non-covered demand were considered. They proposed an epsilon-constrained method for this problem, and proved that it generated the exact Pareto front. Finally, they proposed a heuristic algorithm for short computation times.
Hu et al. (2015) [21] presented a mathematical model for ood relief logistics. They considered min-imizing the total cost and shortage risk. Givler and Mitchel (2018) [22] proposed a model for the equi-table distribution of relief commodities in the response phase. It considered the risks involved in locating the DCs. Bozorgi-Amiri and Khorsi (2016) [23] proposed a multi-objective dynamic stochastic programming model for a humanitarian relief logistics problem where decisions are made to deal with pre- and post-disaster incidents. Their model proposed three objectives: min-imizing the maximum amount of shortages among the aected areas in all periods, the total travel time, and the sum of pre- and post-disaster costs. The proposed model is solved as a single-objective mixed-integer programming model by applying the "-constrained method. Gutjahr and Dzubur (2016) [24] proposed a bi-level model in order to locate the distribution center considering the distribution fairness. On the rst level, a number of distribution centers were selected with the aim of minimizing the costs and maximizing the coverage; on the second level, by using the distance and supply capacity criteria, the appropriate location for these facilities was selected. Finally, by utilizing the adaptive "-constrained, branch and bound, and Frank-Wolf methods, the Pareto solutions were found. Zokaee et al. (2016) [25] proposed a relief logistics model for a three-echelon network consisting of supply, distribu-tion, and demand point. They optimized the objectives of maximizing the responsive people and minimizing the total cost under scenario-based uncertainty by identifying the critical uncertain factors and providing a deterministic approximation. They presented a case
study of the Alborz province as an earthquake-prone region in Iran. Haghi et al. (2017) [26] developed a multi-objective programming model for locating relief goods distribution centers and health centers along with distributing relief goods and transferring the casualties to health centers, with pre/post-disaster budget constraints for goods and casualties logistics. They considered uncertainties in demand, supply, and cost parameters. Their proposed model maximizes the level of response to medical needs of the casualties while targeting the justly distribution of relief goods and minimizing the total costs of preparedness and response phases. Their model is solved with "-constrained method and the MOGASA algorithm.
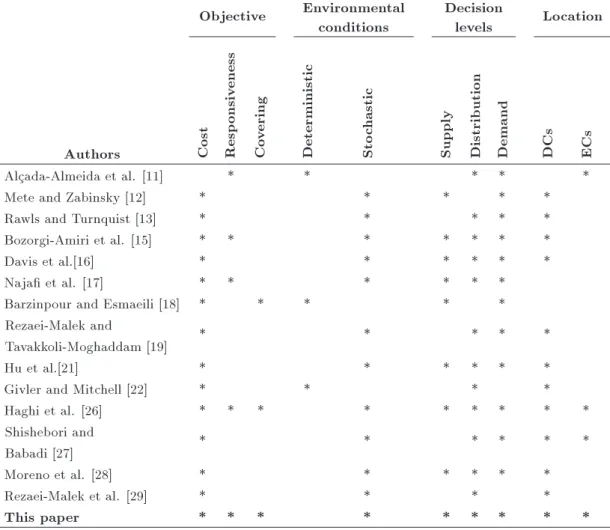
Table 1 presents some important features of the reviewed papers in the eld of relief logistics. The main features and identied research gaps in the literature covered by this paper are as follows:
1. Many research studies are developed in the context of relief logistics as multi-objective. In the real-world situation, the researchers have considered responsiveness in addition to cost; these are some of the most important objectives of the problem.
However, maximizing the coverage of demand along with other objectives has been rarely studied. Max-imum coverage of the demand can be achieved by locating the right DCs and ECs; this leads to improvements in responsiveness and cost reduction. Herein, objective functions of cost, responsiveness, and demand covering are considered simultane-ously;
2. During a disaster, it is better to consider all factors aecting the relief chain. Therefore, all supply chain levels involved in a disaster, including supply, distribution, and the relief commodities demand, should be considered in the planning framework; 3. In this study, locating DCs and ECs optimally is
considered to meet the demand. Since the strength levels of buildings in dierent regions are not similar, demands of dierent regions may depend on the resistance of buildings against severity of a disaster. Therefore, in this paper, aected areas are divided into dierent regions with regional demands. Hence, dierent regions with dierent building resistance quality and demand under un-certainty are considered.
Table 1. Comparative analysis of some important features of reviewed papers in the literature. Objective Environmental
conditions
Decision
levels Location
Authors Cost Resp
onsiv
eness
Co
vering
Deterministic Sto
chastic
Supply Distribution Demand DCs ECs
Alcada-Almeida et al. [11] * * * * *
Mete and Zabinsky [12] * * * * *
Rawls and Turnquist [13] * * * * *
Bozorgi-Amiri et al. [15] * * * * * * *
Davis et al.[16] * * * * * *
Naja et al. [17] * * * * * *
Barzinpour and Esmaeili [18] * * * * *
Rezaei-Malek and
Tavakkoli-Moghaddam [19] * * * * *
Hu et al.[21] * * * * * *
Givler and Mitchell [22] * * * *
Haghi et al. [26] * * * * * * * * *
Shishebori and
Babadi [27] * * * * * *
Moreno et al. [28] * * * * * *
Rezaei-Malek et al. [29] * * * *
Moreover, the following question needs to be answered. Can we avoid (or at least minimize) damages of an earthquake by means of planning for it before its occurrence? The answer to this question will be discussed in the following sections.
3. Problem description
Three levels in a relief supply chain are considered in this research. The suppliers, DCs, and ECs are the main entities that play important roles in this network. Suppliers provide required relief commodi-ties. Depending on the severity of a disaster and relief commodities demand, requested items are distributed to the identied DCs where they are sent to ECs. Figure 3 illustrates a scheme of a relief commodities supply and distribution network. Accordingly, demand points and considered ECs in each region are placed on the third level.
Some of the assumptions in the proposed model are as follows:
1. Suppliers' locations are xed, while there are alter-native locations for DCs and ECs;
2. There are several types of relief commodities; 3. Relief commodities demand is estimated
indepen-dently for each region;
4. Capacity of available ECs in each region is at least equal to the number of required ECs in that region. Required ECs in each region are calculated according to the number of residents in that region; 5. If the number of items delivered to an EC is more than the relief commodities demand, inventory cost for extra relief commodities will be considered. 3.1. Indices
i Existing suppliers (i = 1; 2; ; I); j Potential DCs (j = 1; 2; ; J); k Potential ECs (k = 1; 2; ; K); c Relief commodities (c = 1; 2; ; C);
Figure 3. A schema for relief commodities ow.
o Regions (o = 1; 2; ; O); h Quality of a construction (h =
1; 2; ; H);
s Scenarios for disaster intensity (s = 1; 2; ; S).
3.2. Certain parameters
ps Probability of the occurrence of
scenario s;
packagec Number of relief commodities c in one package;
vc Required space for one package of relief
commodity c;
oh 1 if region o has quality of construction
h, 0 otherwise;
popo Population of region o;
disjk Distance between DC j and EC k;
'ic Purchase cost for a package of relief
commodity c from supplier i; C1ijc Transportation cost for a package of
relief commodity c from supplier i to DC j;
CapDj Capacity of the DC j (m3);
F Dj Setup cost of DC j;
Fk Setup cost of EC k;
cov Maximum coverage distance per unit volume DC;
S1ic Number of packages of relief commodity
c supplied from supplier i;
h1c Inventory holding cost for a package of
relief commodity c before the disaster; DCOj Maximum coverage distance for DC j,
DCOj = CapDj cov;
N
o2Ofkg Set of potential ECs k in region o;
N
j2Jfkg Set of ECs k located at the coveringdistance of DC j, N = fk : dis jk
DCOjg;
N
k2Kfjg Set of DCs j that covers EC k,N = fj : dis jk DCOjg;
M A suciently large positive number. 3.3. Uncertain parameters
CCjkcs Unit transportation cost of one package
of relief commodity c from DC j to EC k in scenario s;
qhcs Per person demand for relief
commodity c in region with the quality of construction h under scenario s; hs Percentage of population in region
with the quality of construction h who need EC under scenario s;
Docs Demand for package of relief
commodity c in region o under scenario s, Docs=
P
h
h
popohsqhcs
packagec
i oh
; cs Penalty cost for each package of relief
commodity c under scenario s; h2cs Inventory holding cost of one package
of relief commodity c under scenario s. 3.4. Decision variables
Xijc Number of packages of relief commodity
c transferred from supplier i to DC j; Yjkcs Number of packages of relief commodity
c transferred from DC j to EC k under scenario s;
ZDj 1 if DC j is opened; 0 otherwise;
ZSk 1 if EC k is opened; 0 otherwise;
Iocs Number of packages of relief commodity
c held in region o under scenario s; Bocs Number of packages of shortage relief
commodity c in region o under scenario s;
Wjk 1 if DC j is assigned to EC k.
3.5. Mathematical formulation min z1s=
X
j
F DjZDj+
X
k
FkZSk
+X i X j X c
'icXijc
+X i X j X c
(C1ijc+ h1c)Xijc
+X j X k X c
CCjkcsYjkcs
+X
j
X
c
h2csIjcs; (1)
min z2s=
X
c
max
o2OfBocsg; (2)
max z3s=
X
o
X
h
2
4(popohsoh)
0 @X k2No X j2Nk Wjk 1 A 3
5 ; (3)
s.t.: X
j
X
k2NO
Yjkcs+ Bocs= Docs 8 o; c; s; (4)
X
i
Xijc=
X
k
Yjkcs+ Ijcs 8 j; c; s; (5)
X
c
X
i
VcXijc CapDjZDj 8 j; (6)
X
j
Xijc S1ic 8 i; c; (7)
ZSk
X
j2Nk
Wjk 8 k; (8)
2 Wjk ZDj+ ZSk 8 j; k; (9)
X
c
Yjkcs M Wjk 8 j; k; s; (10)
ZDj; ZSk; Wjk2 f0; 1g 8 j; k; (11)
Xijc; Yjkcs; Iocs; Bocs 0 8 o; i; j; c; k; s:
(12) In this model, Objective Function (1) minimizes the total cost that is composed of the following com-ponents. The rst term computes the setup cost of DCs before a disaster; the second term calculates the setup cost of an EC before the disaster. The third term is procurement cost before a disaster. The fourth term is the transportation cost from the supplier to DC and inventory holding before a disaster. The fth term calculates the transportation cost from DC to EC during a disaster. The last term is the cost of holding inventory during a disaster. Objective Func-tion (2) minimizes the maximum number of shortage of relief commodities in each region. This translates to responsiveness maximization. Objective Function (3) maximizes the demand coverage; in fact, this objective is dierent from the second one as it increases coverage quality of responsibility; however, the second objective caused equity of responsibility.
Constraint (4) represents balance constraint for each region that determines the number of relief com-modities distributed from each DC to each region according to the amount of demand. Constraint (5) represents the total number of relief commodities shipped to a DC. Constraint (6) enforces the fact that the total number of relief commodities shipped to a DC cannot exceed the DC capacity. Constraint (7) imposes that the number of relief commodities supplied from a supplier cannot exceed the supplier's capacity. One DC should cover the EC at least. This is modeled through Constraint (8). Constraint (9) expresses that, if DC and EC are opened, then they can be assigned. Constraint (10) models the fact that when there is a ow between DC and EC, relief commodities can be shipped. Constraints (11) and (12) enforce the range of variables.
3.6. Linearization
The proposed optimization model includes non-linear terms. Objective Function (2) is a non-linear one that may be transformed into a linear function using a new positive auxiliary variable, Ecs. The original non-linear
objective function is replaced with the constraints given in Eqs. (13) to (15):
min z2s=
X
c
Ecs; (13)
Ecs Bocs 8 o; c; s; (14)
Ecs 0 8 c; s: (15)
4. Robust optimization
4.1. The robust optimization framework
Two broad categories of risk can be dened that aect the supply chain management and design. The rst category is concerned with uncertainty embedded in the model parameters, inuencing the problem of balancing the supply and demand. The second cate-gory of risks may arise from natural disasters, strikes and economic disruptions, terrorist attacks, etc. The existing uncertainties in the demand and costs refer to the rst category of risks. A Robust Optimization (RO) approach can be considered as an alternative approach for dealing with the rst category of risk in the case where there are not enough historical data to estimate the probability distribution of the uncertain parameters. Robust optimization has been one of the most common methods for dealing with optimization problems under uncertainty since the 1990s [30,31]. Mulvey et al. [32] presented an approach for robust optimization considering both the solution and model robustness. It means that the solution remains al-most feasible and alal-most optimal under all scenarios. Model infeasibility is measured by a penalty function. Moreover, their robust optimization model considered the analyses of model and solution robustness. It is formulated as follows:
min cTx + dTy; (16)
s.t.:
Ax = b; (17)
Bx + Cy = e; (18)
x; y 0; (19)
where x is a vector of design variables, and y is a vector of control variables. Constraint (17) is the structural constraint for which the coecients are constant, noise-free and deterministic (certain coe-cients). Constraint (18) is a control constraint for
which the coecients are noisy and deterministic (un-certain coecients). Constraint (19) represents the type of the variables. To dene the problem of robust optimization, a set of scenarios = f1; 2; ; sg is considered.
The set of uncertain parameters fBs; Cs; esg is
determined under each scenario, and the probability of each scenario, s, is represented by ps where the
summation of all scenarios should be equal to one. However, it is impossible to nd a feasible and optimal solution to Model (16) under all scenarios in . Since the control variable, y, changes after realizing a new scenario, it can be represented by ys. Due to the
uncertainty of parameters, the model may be infeasible for some scenarios. The variable s represents the
infeasibility of the model under each scenario, s. If the model is feasible, then s is zero.
The model should make a trade-o between solution robustness and model robustness. Mulvey et al. [32] presented a robust optimization model to evaluate this trade-o. The general model of the scenario-based robust optimization is as follows:
min (x; y1; y2; ; ys) + p(1; 2; ; s); (20)
s.t.:
Ax = b; (21)
Bsx + Csys+ s= es 8 s 2 ; (22)
x; ys; s 0 8 s 2 : (23)
There are two terms in Objective Function (20). The rst term shows the solution robustness, and the second calculates the model robustness. The objective function is notated by s = f(x; ys) for scenario s.
Mulvey et al. [32] used the following expression to represent solution robustness where is dened as the weight assigned to solution variations and is weight of robustness.
() =X
s2
pSS+
X
s2
pS S
X
s2
p0 SS0
!2
: Recently, Yu and Li [33] extended the model to the following:
min X
s2
pSS+
"
X
s2
pS
S
X
s2
pSS
! + 2s
!#
+ X
s2
s.t.: S
X
s2
pSS+ s 0 8 s 2 ; (25)
s 0 8 s 2 ; (26)
where s is utilized for linearization.
4.2. The proposed robust optimization model Following the aforementioned robust optimization ap-proach, the proposed model is incorporated with the scenario-based uncertainty, and the following model is obtained.
min z1=
X
s2
psz1s+
X
s2
ps z1s
X
s2
psz1s+ 21s
!
+X
s
X
o
X
c
pscsBocs; (27)
min z2=
X
s2
psz2s+
X
s2
ps z2s
X
s2
psz2s+ 22s
! ; (28) max z3=
X
s2
psz3s; (29)
s.t.: z1s
X
s2
psz1s+ 1s 0 8 s; (30)
z2s
X
s2
psz2s+ 2s 0 8 s; (31)
1s; 2s 0 8 s: (32)
The rst terms in Objective Functions (27), (28), and (29) are the mean values, and the second terms in Objective Functions (27) and (28) are the variance of total costs, measuring the solution robustness. The third term in Eq. (27) measures the robustness of the model.
5. Multi-choice goal programming method In this research, Multi-Choice Goal Programming (MCGP) is implemented to solve the proposed model. Goal Programming (GP), as one of multi-objective op-timization methods, is one of the most famous decision-making techniques rst employed by Charnes et al [34].
The purpose of GP is to minimize the unnecessary deviations of the objective from the expected level, also known as primary conservative level. However, the primary conservative level is usually dicult to determine [35]. Therefore, Chang introduced an MCGP method for solving multi-objective decision-making problems with multiple expected levels for each goal. MCGP method allows decision-makers to oer a set of expected levels for each goal. Mathematical formulation of the MCGP is as follows [36]:
min Xn
i=1
wi(d+i + di ); (33)
s.t.:
hk(x) = ( or )0 8 k = 1; ; q; (34)
fi(x)+di d+i = m
X
j=1
gijzij 8 i = 1; ; n; (35)
m
X
j=1
zij = 1 8 i = 1; ; n; (36)
d+i ; di 0; zij 2 f0; 1g 8 i = 1; ; n
8 j = 1; ; m: (37)
In the above formulation, hk(x) is the kth
sys-tematic constraint, fi(x) is the ith objective function,
gij is the jth expected level of objective function i, d+i
is the positive deviation from the ith objective value, and variable di is the negative deviation from the ith objective value. Also, zij is a binary variable and is 1 if
the jth expected level of objective function i is selected, and is 0 otherwise. Each objective function may have only one expected level. Moreover, wi is the positive
weight for (d+ i , di ).
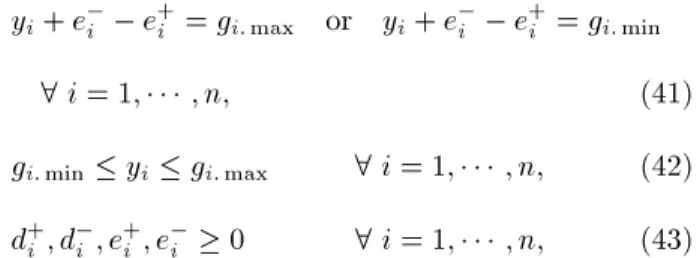
In MCGP, solution time may rise as the number of binary variables increase. To enhance the computation time, Chang [36] proposed a Revised MCGP (RMCGP) method described as follows. In this method similar to GP, the purpose is to minimize the unnecessary deviation of the objective from the expected level and minimize the unnecessary deviation of the expected level from its ranges.
min
n
X
i=1
wi(d+i + di ) + i(e+i + ei )
; (38)
s.t.:
hk(x) = ( or )0 8 k = 1; ; q; (39)
yi+ ei e+i = gi: max or yi+ ei e+i = gi: min
8 i = 1; ; n; (41)
gi: min yi gi: max 8 i = 1; ; n; (42)
d+
i ; di ; e+i ; ei 0 8 i = 1; ; n; (43)
where gi: max and gi: min are the ranges of the ith
expected level, and yi is the continuous variable. e+i
and ei are positive and negative deviations of yifrom
gi: min or gi: max, respectively. d+i and di are positive
and negative deviations of fi(x) from yi, respectively.
Finally, wi is the positive weight of (d+i , di ), and
i is the positive weight of (e+i , ei ). The rst term
in Constraint (41) relates to \The more, the better" (used for maximizing an objective function), and the second term relates to \The less, the better" (used for minimizing an objective function).
6. Case study
6.1. Case description
Relief logistics plays a signicant role in saving human lives when disaster strikes. This is the reason for various eorts that have been made in relief logistics. However, a lot more should be done in terms of research and practice. This is mainly because disasters are usu-ally unpredictable, and there is a lack of understanding of the costs related to such an event. Therefore, pre-disaster planning plays a major role in the successful confrontation of cries.
Furthermore, Iran is one of the earthquake-prone countries located on one of two unstable large belts, where strong earthquakes occur occasionally. In addi-tion, Iran is among the rst ten countries with a high rate of disasters (ranked sixth in the world and fourth in Asia [37]). In this research, to validate the model and justify its applicability, a study of relief program during an earthquake in the city of Amol, in the Mazandaran Province, is presented in this section. This city is under the verge of large and small earthquakes due to its proximity to Mount Damavand, the highest volcano in the Middle East and Asia and an inactive volcano with several earthquake-prone areas around. Proper relief management in the North of Iran is important due to the high dispersion of areas with high risk of earthquake, as shown in Figure 4.
In this study, in order to achieve the humanitarian and cost objectives in dierent disaster's scenarios, re-lief planning is considered before and during a disaster. Finally, the results are analyzed.
In this study, a lot of information has been received from experts in the elds of geology and disaster management. In fact, the bulk of this study is obtained based on the Field study.
Figure 4. Dispersion of the areas with high risk of earthquakes in Iran [38].
Table 2. Population and quality of construction in each region.
oh popo standard
Non-
Partly-standard Standard
North 50,000 0 1 0
West 75,000 0 1 0
Center 45,000 0 0 1
East 65,000 0 1 0
South 35,000 1 0 0
In this study, Amol, with the population of about 270,000, is divided into ve districts of north, south, west, east, and center. The population of each region is shown in Table 2. Since relief aids in a region directly relate to the strength of buildings in that region and buildings in dierent areas have dierent earthquake-resistant structures, the regions are categorized into three groups according to the building's construction quality:
1. Standard: A region in which more than 70 percent of buildings conform to the construction standards; 2. Partly standard: A region where between 30 and 70 percent of buildings conform to the construction standards;
3. Non-standard: A region in which less than 30 percent of buildings conform to the construction standards.
These classications and percentages were achieved by consulting with the experts; actually, these have been considered for Amol structure and may be dierent for other cities.
Some of the most important issues that may cause outing of construction regulations are the type
Table 3. Classication of earthquakes based on severity [39].
Magnitude Earthquake Eects Class Estimated number
each year 2.5 or less Usually not felt, but can be recorded by seismograph. Minor 900,000
2.5 to 5.4 Often felt, but only causes minor damage. Light 30,000 5.5 to 6.0 Slight damage to buildings and other structures. Moderate 500 6.1 to 6.9 May cause a lot of damage in very populated areas. Strong 100
7.0 to 7.9 Major earthquake. Serious damage. Major 20
8.0 or greater Great earthquake. Capable of totally destroying
communities near the epicenter. Great One every 5 to 10 years
of rocks and soil, the quality of the foundation, the type of construction (concrete, steel, brick and mixed), regularity in plan and height, analysis and design of structures against earthquakes, number of oors, ground state structures, seismic coecient in each direction of buildings, and structural weight. Accord-ing to these criteria, the regions are categorized as described in Table 2.
Earthquakes are classied in categories ranging from minor to great (Table 3), depending on their magnitude. However, based on local geographical information collected, in Amol, there is no possibility of an earthquake greater than 7 Richter.
Since a major part of the planning procedure to manage the eects caused by disasters is performed be-forehand and because of the lack of information about earthquake severity, three scenarios are considered: 1. The rst scenario is considered for an earthquake
less than 5.5 magnitude on a Richter scale that does not require great relief demand;
2. The second scenario is designed for an earthquake between 5.5 and 6 magnitude on a Richter scale that requires much more demand than the rst scenario; 3. The third scenario is considered for an earthquake between 6 and 7 magnitude on a Richter scale that causes great human and nancial loss. Con-sequently, it may request a great demand in the region.
According to the international reports, the his-torical data, and estimations of regional and national
experts, probability of 0.7, 0.2, and 0.1 is estimated for dierent scenarios.
6.2. Input parameters
According to Figure 5, 10 potential DCs and 45 poten-tial ECs are identied in the ve regions mentioned in Table 2. Three types of relief batches are considered. The batches contain:
1. Water and food; 2. Hygiene and clothing; 3. Other relief commodities.
More information about the batches is presented in Table 4. In order to facilitate the transportation, each relief batch is laid in a package (a bigger box). The numbers of relief commodities in each package are 10, 5, and 1, respectively. Aid packages are sent from three suppliers to DCs:
1. Sari (capital city of Mazandaran), 2. Tehran (capital city of Iran), 3. A large warehouse in the Amol.
Table 5 represents the demand for packages for each region in each scenario. Each supplier capacity is given in Table 6. Since each DC has a dierent capacity, the distance coverage is dierent for each DC, as shown in Table 7.
One of the main relief objectives is to prevent shortages or unfullled demand. However, in the case of a severe disaster, it is hard to meet all the demands; hence, shortage may ensue. In this case, shortage
Table 4. Relief commodities in each batch.
Water and food Rice Oil Sugar Tea Bean Canned Tuna Water
Hygiene and
clothing Dishes
Coleman water
Gallons water and oil
Plastic tankard
Health
package Slippers Clothing | Other Relief tents Carpet 3*2 Blankets Nylon tent Heater Lantern | |
Table 5. Capacity for each supplier.
S1ic Water and food Hygiene and clothing Other
Amol 100 110 120
Sari 200 300 250
Tehran 400 450 350
Figure 5. Urban area used for the case study divided into 5 regions (Amol).
costs per package of relief commodity are shown in Table 8. Moreover, another aspect of relief in disasters is to avoid additional costs (such as holding costs) and waste of relief commodities. Because of dierent storage conditions, relief commodities may decay under dierent scenarios. Therefore, the holding cost per package of relief commodities is dierent in the three scenarios, as shown in Table 8.
6.3. The results
The proposed model optimizes three objectives of minimizing the cost of relief (DCs and ECs setup cost, purchasing and transportation cost, holding and shortage cost), minimizing the maximum shortage in each region of demand, and maximizing the coverage area. In this problem, robust optimization methods are employed to consider multiple scenarios, and MCGP
method is implemented for integrating objective func-tions. The obtained model is as follows:
min =
w1(d + 1 + d1)
g1: min + 1
(e+ 1 + e1)
g1: min
+
w2(d + 2 + d2)
g2: min + 2
(e+ 2 + e2)
g2: min
+
w3(d + 3 + d3)
g3: max + 3
(e+ 3 + e3)
g3: max
;
s.t.: Constraints (4)-(12), (14) and (15) and (27)-(32): f1(x) + d1 d+1 = y1;
Table 6. Demand for each of the regions in each scenario.
Docs Scenario 1 Scenario 2 Scenario 3
North
Water and food 8 57 97
Hygiene and clothing 16 113 193
Other 13 113 207
West
Water and food 12 85 145
Hygiene and clothing 23 169 289
Other 19 169 310
Center
Water and food 3 28 61
Hygiene and clothing 5 55 122
Other 3 34 102
East
Water and food 10 74 126
Hygiene and clothing 20 147 251
Other 17 147 269
South
Water and food 11 64 106
Hygiene and clothing 22 127 211
Other 27 211 526
Table 7. Covering distance of each DC (m).
j 1 2 3 4 5 6 7 8 9 10
DCOj 1,250 1,800 1,300 1,450 1,600 1,400 950 1,300 2,450 1,300 Table 8. Holding and cost of lacking a package of relief commodities for scenarios (thousand Rials).
Scenario 1 Scenario 2 Scenario 3
h1cs cs h1cs cs h1cs cs
Water and food 1,000 7,000 1,500 9,000 2,000 11,000 Hygiene and clothing 100 6,000 150 8,000 200 9,000
Other 50 500 100 2,000 150 4,000
g1: min y1 g1: max;
f2(x) + d2 d+2 = y2;
y2+ e2 e+2 = g2: min;
g2: min y2 g2: max;
f3(x) + d3 d+3 = y3;
y3+ e3 e+3 = g3: max;
g3: min y3 g3: max;
d+
1; d1; d+2; d2; d+3; d3; e+1; e1; e+2; e2; e+3; e3 0:
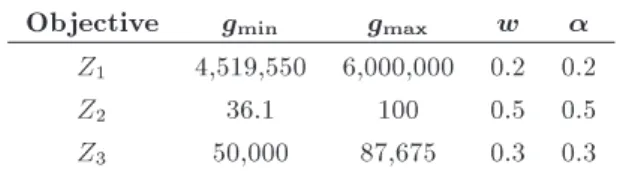
Table 9. Ideal and anti-ideal values and weights of each of the objectives for the main problem.
Objective gmin gmax w
Z1 4,519,550 6,000,000 0.2 0.2
Z2 36.1 100 0.5 0.5
Z3 50,000 87,675 0.3 0.3
Input parameters for solving MCGP are presented in Table 9.
Herein, gmin and gmax are ideal values for
min-imization and maxmin-imization objectives, respectively. Moreover, gmax and gmin are anti-ideal values for
min-imization and maxmin-imization objectives, respectively. Thus, for the rst objective function, gmaxis dened as
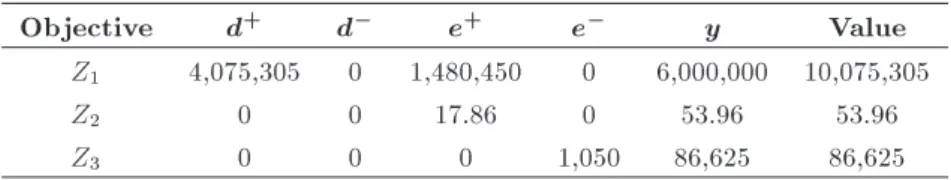
Table 10. Results of the main problem.
Objective d+ d e+ e y Value
Z1 4,075,305 0 1,480,450 0 6,000,000 10,075,305
Z2 0 0 17.86 0 53.96 53.96
Z3 0 0 0 1,050 86,625 86,625
Rials) that can be spent. The weight of each objective is represented in Table 9. The model is solved in Lingo 9 on a PC equipped with Intelr CoreTM i5 CPU and
4GB RAM running Microsoftr WindowsTM 7. The
results are depicted in Table 10.
According to the results, the second and third objectives are totally satised, because the realized values obtained from these functions lie within the expected range [gmin; gmax]. However, the positive
deviation variable takes a non-zero value for the rst objective. Accordingly, the value of this objective is 68% more than the upper limit. In other words, additional budget (68% more) is required to be within the expected range. DCs' numbers 3, 4, 7, and 8 are not set up, since Zd3;4;7;8 = 0 in the central region.
The obtained values are shown in Table 11.
Besides, among the potential ECs, three points (1, 44, and 45) are not set up, which may derive from the longer distances and higher costs of these ECs. As mentioned earlier, in a disaster, either the demand is met or shortage happens. Table 11 shows unfullled
demand and the remaining relief commodities in each region. Due to the lower demand in the rst and second scenarios, the relief commodities stored in stock meet all the demands and there is surplus of inventory. However, in the third scenario, shortages occur due to the severity of the disaster and higher demand. In Table 12, the percentage of responsiveness is shown under various scenarios; percentage of responsiveness has an inverse relation with shortage of relief com-modities. According to Table 12, the central region has the minimum responsiveness (17%) because of
non-Table 12. Percentage of responsiveness per region under dierent scenarios.
Scenario 1 Scenario 2 Scenario 3
North 100 100 43
West 100 100 62
Center 100 100 17
East 100 100 56
South 100 100 66
Table 11. Shortage and inventory of relief commodities per region in each scenario. Scenario 1 Scenario 2 Scenario 3 Bocs I1ocs Bocs I1ocs Bocs I1ocs North
Water and food 0 44 0 0 45 0
Hygiene and clothing 0 85 0 0 91 0
Other 0 45 0 0 148 0
West
Water and food 0 73 0 0 45 0
Hygiene and clothing 0 73 0 0 91 0
Other 0 144 0 0 148 0
Center
Water and food 0 0 0 0 45 0
Hygiene and clothing 0 0 0 0 91 0
Other 0 0 0 0 102 0
East
Water and food 0 0 0 0 45 0
Hygiene and clothing 0 0 0 0 91 0
Other 0 0 0 0 148 0
South
Water and food 0 50 0 0 45 0
Hygiene and clothing 0 17 0 0 91 0
standard building structures and higher cost of setting up DCs and ECs in this region.
6.4. \What if . . . ?" analysis
Because of the importance of responsiveness in a disas-ter situation, a plan for disasdisas-ter management should be devised at the lowest possible shortage with an acceptable cost. In this section, some solutions are presented to decrease demand under fulllment along with lowering the costs.
Weightless cost function
One way to improve the responsiveness is to ignore the relative importance of the cost objective func-tion. Thus, the weight of the rst objective function (w1, 1) is set to zero, and the second and third
objective functions' weights are changed according to Table 13. The results are given in Table 14.
The rightmost column in Table 14 presents the gap between the optimal value and value obtained by solving the original model. This gap for the rst objective is computed as follows:
Gap% =value g1: min g1: min 100:
Because the cost function is weightless, there is no limitation on the budget. As a result, all gaps of the problem occur in the cost objective function, and the values of gaps for other objectives become zero (Table 14). As observed in this case, the second and third objective functions take their best values, and the rst objective is 133.7% larger than its upper limit. In fact, to meet the desired amount for the rst objective, it needs an additional budget that translates to an increase from 6,000,000 thousand Rials to 14,024,724 thousand Rials. Unlike the rst solution, all the DCs are set up in this case. In Table 15, the percentage of responsiveness for each of the regions is shown for dierent scenarios. Total responsiveness increases as compared to the
Table 13. Ideal and anti-ideal values and weights of each objective where w1= 0.
Objective gmin gmax w
Z1 4,519,550 6,000,000 0 0
Z2 36.1 100 0.6 0.6
Z3 50,000 87,675 0.4 0.4
Table 15. Percentage of responsiveness to each of the regions under dierent scenarios where w1= 0.
Scenario 1 Scenario 2 Scenario 3
North 100 100 62
West 100 100 74
Center 100 100 50
East 100 100 71
South 100 100 77
original problem. However, it is less than 100%, and not all of the required materials are investigated. Therefore, the limitation on budget is not the only factor that hampers the total responsiveness.
In this case, the objective function of the short-age is reduced by 33% (from 53.96 to 36.1); however, the total cost increases by 39.1% as compared with the rst situation (from 10,075,307 to 14,024,724). Reinforcing the regions
The quality of construction has a considerable im-pact on the damages and casualties. Reinforcement of regions before a disaster is one of the ways for improvement, which could reduce demand, thus reducing the unfullled demand during the disaster. Therefore, the case in which all buildings in all regions are retrotted and, then, upgraded to a stan-dard structure, i.e., h = 3, is considered here. With these changes, some uctuations are observed in the upper and lower limits of the objective functions. The following results, as shown in Table 16, are obtained by solving the model. It should be noted that using this method requires government support, such as loan allocations to people, to improve the quality of construction.
According to the results in Table 17, the ideal objective function values are improved for all objectives except for the third objective function. In this case, all of the objectives meet their desired levels and the shortage rate is zero, i.e., all the demands are met. Therefore, it can be concluded
Table 16. Ideal and anti-ideal values and weights of each of the objectives when all regions change to h = 3.
Objective gmin gmax w
Z1 2,425,500 6,000,000 0.2 0.2
Z2 0 100 0.5 0.5
Z3 50,000 57,120 0.3 0.3
Table 14. The results of the problem where w1= 0.
Objective d+ d e+ e y Value GAP (%)
Z1 9,505,174 0 0 0 4,519,550 14,024,724 210.3
Z2 0 0 0 0 36.1 36.1 0
Table 17. Results of the problem when all regions change to h = 3.
Objective d+ d e+ e y Value GAP (%)
Z1 0 0 3,451,199 0 5,876,699 5,876,699 142.2
Z2 0 0 0 0 0 0 0
Z3 0 0 0 1960 55,160 55,160 3.4
Table 18. Ideal and anti-ideal values and weights for each of the objectives when capacity of suppliers is increased by 50%.
Objective gmin gmax w
Z1 4,519,550 6,000,000 0.2 0.2
Z2 13.87 100 0.5 0.5
Z3 50,000 87,675 0.3 0.3
that although retrotting buildings before a disaster may require much costs, it can reduce the cost of disaster relief and make signicant changes in the number of victims and improve the services for them. In this case, the relief cost is reduced by 41.6% and the best value for the second objective function is obtained. In addition, the coverage objective function is reduced due to the reduction of the established DCs.
Increasing the supply capacity
One way to increase the responsiveness is to allevi-ate the limitations specic to the supply of relief commodities. This is practically very dicult, if not impossible. However, supply capacity for relief commodities can be increased. Therefore, the case in which the capacity of suppliers is increased by 50% is studied. Some uctuations in the upper and lower limits of the objective function are shown in Table 18.
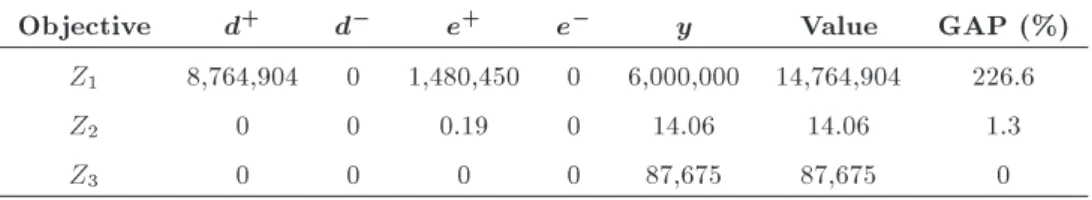
According to the results in Table 19, with a 50% increase in supply capacity, unfullled demands are decreased. In this case, the cost is increased by 46.5% and the shortage is reduced by 73.9% compared to the original problem.
Adding a DC
One way to be more responsive is to add a DC. Specically, there is not any DC in region 5 (South) to set up. Therefore, a DC is set up near one of the ECs, and the impacts on unfullled demand are studied. The results are shown in Table 20.
Table 20. Ideal and anti-ideal values and weights for each of the objectives when a DC is added.
Objective gmin gmax w
Z1 4,541,658 6,000,000 0.2 0.2
Z2 36.1 100 0.5 0.5
Z3 50,000 90,825 0.3 0.3
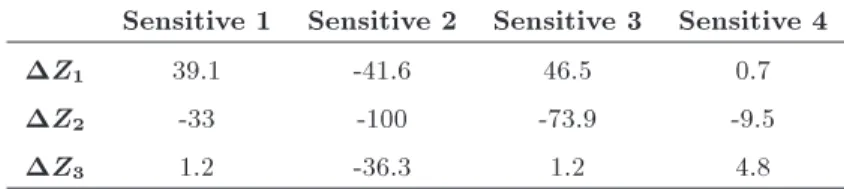
According to the results in Table 21, by setting up a DC near EC 43 in region 5 (South), unfullled demand is reduced by 9.5% and coverage is increased by 4.8%. Table 22 compares the values of the orig-inal objective functions with those of the situation studied here. The uctuations are displayed by given by the following equation for the rst objective function. The gaps for other objective functions are calculated in a similar way:
Z1 0 1 = z
1 1 z10
z0
1 100
= 14024724 1007530510075305 100 = 39: Thus, according to Table 22, for the gaps of objectives one and two, \the more negative, the better"; for the gaps of objective three, \the more positive, the better". By examining these results, the obtained solutions are ranked. The second case in which the buildings are retrotted before a disaster is the best way to reduce the shortage and cost; however, further time and government support are required. Due to the importance of the second objective, appropriate supply and increasing capac-ity of the DCs are ranked second. Disregarding the relative importance of the objectives through solving the weightless model is ranked third. Moreover, the last ranked case is the one in which a DC is added. However, by consulting with the experts, it is concluded that the solution that can be easily implemented in the current situation is the last one.
Table 19. Results of the problem when the capacity of suppliers is increased by 50%.
Objective d+ d e+ e y Value GAP (%)
Z1 8,764,904 0 1,480,450 0 6,000,000 14,764,904 226.6
Z2 0 0 0.19 0 14.06 14.06 1.3
Table 21. Results of the problem when a DC is added.
Objective d+ d e+ e y Value GAP (%)
Z1 4,155,496 0 1,458,342 0 6,000,000 10,155,496 123.6
Z2 0 0 12.73 0 48.83 48.83 35.2
Z3 0 0 0 0 90,825 90,825 0
Table 22. Comparing the number of the main objective functions with the reviewed problem. Sensitive 1 Sensitive 2 Sensitive 3 Sensitive 4
Z1 39.1 -41.6 46.5 0.7
Z2 -33 -100 -73.9 -9.5
Z3 1.2 -36.3 1.2 4.8
7. Conclusions
Logistics planning is one of the most important activi-ties in the response phase of relief chain management, and a coherent plan can increase the eciency and responsiveness when dealing with a disaster. In order to reduce casualties, as the main objective of the relief logistics, the right amount of commodities in the right locations should be supplied to the victims. Thus, two issues of locating the appropriate places for the ECs and supplying the required relief commodities should be considered in an optimal relief plan. In this paper, three objectives of cost, responsiveness, and coverage were considered by a multi-objective model to locate the DCs and ECs and allocate relief commodities to the ECs. The model was solved utilizing a multi-choice goal programming method. Moreover, to val-idate the model, a study of an earthquake logistics network was conducted, and the results showed the signicance of the addressed problem. This model provided a scenario-based robust optimization model to balanced costs, equity, and responsiveness in dierent situations. It is recommended to perform the relief logistics planning based on the structure of each region. According to the results, retrotting the buildings in dierent regions before the disaster is one of the best ways to reduce the shortage and costs in a disaster.
The following suggestions can be conducted in the future along with the proposed problem:
1. Considering routing problem for disaster relief lo-gistics between the DCs and ECs;
2. Considering the reliability of the DCs and ECs; 3. Modeling the request for a quicker response in the
regions with higher priorities;
4. Designing and implementing a meta-heuristic algo-rithm for the large-scale problems.
One of the major problems that prevents the real-time relief after a disaster is the destruction of routes,
especially the related ways between relief facility cen-ters. In this situation, routes that are more reliable can be identied and retrotted before a disaster. Another suggestion in this paper is to increase the reliability of the selected centers. Each of the selected centers, according to criteria such as the age of the building and the quality of the building, has dierent degrees of access and resistance to the disaster. Further, its impact on dierent scenarios should be evaluated, and decisions on the construction of new centers or reconstruction of these centers can be made. Hence, the reliability and accessibility of these centers increases during a disaster. Minimum responsiveness level is another suggestion for future research. Considering the minimum percentage of responding to demands is of particular importance, which can be distinguished for the various commodities.
References
1. Van Wassenhove, L.N. \Humanitarian aid logistics: supply chain management in high gear", Journal of the Operational Research Society, 57(5), pp. 475-489 (2006).
2. Goudie, A.S., The Human Impact on the Natural Environment: Past, Present, and Future, John Wiley and Sons (2013).
3. Guha-Sapir, D., Below, R. and Hoyois. Ph., EM-DAT: the CRED/OFDA International Disaster Database, Universite Catholique de Louvain, Brussels, Belgium (2015).
4. Cyganik, K.A. \Disaster preparedness in Virginia hos-pital center-Arlington after Sept 11, 2001", Disaster Management & Response, 1(3), pp. 80-86 (2003).
5. Balcik, B. and Beamon, B.M. \Facility location in hu-manitarian relief", International Journal of Logistics, 11(2), pp. 101-121 (2008).
6. Thomas, A., Humanitarian Logistics, Enabling Disas-ter Response, The Handbook of Fritz Institute (2003).
7. Brotcorne, L., Laporte, G., and Semet, F. \Ambulance location and relocation models", European Journal of Operational Research, 147(3), pp. 451-463 (2003).
8. Van Wassenhove, L.N. and Pedraza Martinez, A.J. \Using OR to adapt supply chain management best practices to humanitarian logistics", International Transactions in Operational Research, 19(1-2), pp. 307-322 (2012).
9. Altay, N. and Green, W.G. \OR/MS research in disaster operations management", European Journal of Operational Research, 175(1), pp. 475-493 (2006).
10. Toregas, C., Swain, R., ReVelle, C., and Bergman, L. \The location of emergency service facilities", Opera-tions Research, 19(6), pp. 1363-1373 (1971).
11. Alcada-Almeida, L., Tralhao, L., Santos, L., and Coutinho-Rodrigues, J. \A multi objective approach to locate emergency ECs and identify evacuation routes in urban areas", Geographical Analysis, 41(1), pp. 9-29 (2009).
12. Mete, H.O. and Zabinsky, Z.B. \Stochastic optimiza-tion of medical supply locaoptimiza-tion and distribuoptimiza-tion in disaster management", International Journal of Pro-duction Economics, 126(1), pp. 76-84 (2010).
13. Rawls, C.G. and Turnquist, M.A. \Pre-positioning planning for emergency response with service quality constraints", OR Spectrum, 33(3), pp. 481-498 (2011).
14. Caunhye, A.M., Nie, X., and Pokharel, S. \Opti-mization models in emergency logistics: A literature review", Socio-economic Planning Sciences, 46(1), pp. 4-13 (2012).
15. Bozorgi-Amiri, A., Jabalameli, M.S., and Al-e-Hashem, S.M. \A multi-objective robust stochastic programming model for disaster relief logistics under uncertainty", OR Spectrum, 35(4), pp. 905-933 (2013).
16. Davis, L.B., Samanlioglu, F., Qu, X., and Root, S. \Inventory planning and coordination in disaster relief eorts", International Journal of Production Economics, 141(2), pp. 561-573 (2013).
17. Naja, M., Eshghi, K., and Dullaert, W. \A multi-objective robust optimization model for logistics plan-ning in the earthquake response phase", Transporta-tion Research, Part E: Logistics and TransportaTransporta-tion Review, 49(1), pp. 217-249 (2013).
18. Barzinpour, F. and Esmaeili, V. \A multi-objective re-lief chain location distribution model for urban disaster management", The International Journal of Advanced Manufacturing Technology, 70(5-8), pp. 1291-1302 (2014).
19. Rezaei-Malek, M. and Tavakkoli-Moghaddam, R. \Ro-bust humanitarian relief logistics network planning", Uncertain Supply Chain Management, 2(2), pp. 73-96 (2014).
20. Abounacer, R., Rekik, M., and Renaud, J. \An exact solution approach for multi-objective location-transportation problem for disaster response", Com-puters & Operations Research, 41, pp. 83-93 (2014).
21. Hu, S.L., Han, C.F., and Meng, L.P. \A scenario planning approach for propositioning rescue centers for urban waterlog disasters", Computers & Industrial Engineering, 87, pp. 425-435 (2015).
22. Givler, A.E. and Mitchell, J.E. \A fair division ap-proach to humanitarian logistics incorporating condi-tional value-at-risk", Annals of Operations Research, 262(1), pp. 133-151 (2018).
23. Bozorgi-Amiri, A. and Khorsi, M. \A dynamic multi-objective location-routing model for relief logistic plan-ning under uncertainty on demand, travel time, and cost parameters", The International Journal of Ad-vanced Manufacturing Technology, 85(5-8), pp. 1633-1648 (2016).
24. Gutjahr W.J. and Dzubur, N. \Bi-objective bi-level optimization of distribution center locations consider-ing user equilibria", Transportation Research, Part E: Logistics and Transportation Review, 31(85), pp. 1-22 (2016).
25. Zokaee, S., Bozorgi-Amiri, A., and Sadjadi, S.J. \A robust optimization model for humanitarian relief chain design under uncertainty", Applied Mathematical Modeling, 40(17), pp. 7996-8016 (2016).
26. Haghi, M., Fatemi Ghomi, S.M.T., and Jolai, F. \De-veloping a robust multi-objective model for pre/post disaster times under uncertainty in demand and re-source", Journal of Cleaner Production, 154, pp. 188-202 (2017).
27. Shishebori, D., and Babadi, A.Y. \Robust and reliable medical services network design under uncertain envi-ronment and system disruptions", Transportation Re-search, Part E: Logistics and Transportation Review, 77, pp. 268-288 (2015).
28. Moreno, A., Alem, D., and Ferreira, D. \Heuristic ap-proaches for the multi period location-transportation problem with reuse of vehicles in emergency logistics", Computers & Operations Research, 69, pp. 79-96 (2016).
29. Rezaei-Malek, M. and Tavakkoli-Moghaddam, R., Za-hiri, B., and Bozorgi-Amiri, A. \An interactive ap-proach for designing a robust disaster relief logistics network with perishable commodities", Computers & Industrial Engineering, 94, pp. 201-215 (2016).
30. Ben-Tal, A., El Ghaoui, L. and Nemirovski, A., Robust Optimization. Princeton Series in Applied Mathemat-ics, The Handbook of Princeton University Press (2009).
31. Ben-Tal, A., El Ghaoui, L., and Nemirovski, A. \Foreword: special issue on robust optimization", Mathematical Programming, 107(1), pp. 1-3 (2006).
32. Mulvey, J.M., Vanderbei, R.J. and Zenios, S.A. \Ro-bust optimization of large-scale systems", Operations Research, 43(2), pp. 264-281 (1995).
33. Yu, C.S. and Li, H.L. \A robust optimization model for stochastic logistic problems", International Journal of Production Economics, 64(1), pp. 385-397 (2000).
34. Charnes, A., Cooper, W.W., and Ferguson, R.O. \Optimal estimation of executive compensation by linear programming", Management Science, 1(2), pp. 138-151 (1955).
35. Charnes, A. and Cooper, W.W. \Management models and industrial applications of linear programming", Management Science, 4(1), pp. 38-91 (1957).
36. Chang, C.T. \Multi-choice goal programming", Omega, 35(4), pp. 389-396 (2007).
37. Dilley, Maxx., Natural Disaster Hotspots: A Global Risk Analysis, 5, World Bank Publications (2005).
38. Nabavi, S.M. \Historical earthquakes in Iran, 300BC-1900 AD", Journal of Earth and Space Physics, 7(1), pp. 70-117 (1978).
39. Abe, K. \Magnitudes of large shallow earthquakes from 1904 to 1980", Physics of the Earth and Planetary Interiors, 27(1), pp. 72-92 (1981).
Biographies
Mohammad Mahdi Paydar is an Assistant Pro-fessor of Industrial Engineering at Babol Noshirvani University of Technology. He received his PhD in Industrial Engineering from Iran University of Science
and Technology. His research interests are cellular manufacturing systems, supply chain design, and mod-elling of manufacturing applications. He has published articles in journals such as Computers and Industrial Engineering, Computers and Operations Research, Ex-pert Systems with Applications, Computers and Chem-ical Engineering, International Journal of Advanced Manufacturing Technology, Journal of Manufacturing Systems, International Journal of Production Research and International Journal of Operational Research and 25 papers in international conferences.
Hasan Molladavoodi is an MSc Student in Industrial Engineering at Babol Noshirvani University of Technol-ogy. He received his B.S degree in Industrial Engineer-ing from Babol Noshirvani University of Technology. The title of his thesis is \relief commodity distribution planning: a robust multi-objective approach".
Abdul Sattar Safaei is an Assistant Professor of Industrial Engineering at Babol Noshirvani University of Technology. He received his PhD in Industrial Engineering from Tarbiat Modares University in 2012 and obtained his MS and BS both in Industrial En-gineering from Amirkabir University of Technology in 2007 and K.N. Toosi University of Technology in 2004, respectively. His main research interests are supply chain management, quality engineering, operations management, and optimization under uncertainty. He has published articles in journals such as Comput-ers and Chemical Engineering, International Journal of Advanced Manufacturing Technology, International Journal of Production Research and some papers in international conferences.