Karen R. McElfresh. Predicting Future E-Book Use: Correlating Selection Guide Scores with Usage Data in a Health Sciences Library. A Master’s Paper for the M.S. in L.S degree. March, 2013. 45 pages. Advisor: Claudia Gollop
Selection guides are essential tools in libraries because they help librarians determine which books to purchase for their collections. A popular selection aide in the Health Sciences is Doody’s Core Titles (DCT), which provides quantifiable scores for each book. The objective of this study was to determine to what extent these scores correlate with usage by library patrons. A list of all e-books on the DCT list at the University of North Carolina at Chapel Hill Health Sciences Library was compiled and circulation data was obtained. Statistical calculations, including correlation coefficients, were performed in order to determine if a statistically significant relationship between DCT scores and usage exists. The data were also examined for other trends in e-book usage. While this study was not able to conclusively prove a relationship between DCT score and usage, in general, books with higher DCT scores are used more frequently.
Headings:
Medical libraries -- Collection development
Electronic books
Selection tools (Libraries)
Medical libraries
PREDICTING FUTURE E-BOOK USE: CORRELATING SELECTION GUIDE SCORES WITH USAGE DATA IN A HEALTH SCIENCES LIBRARY
by
Karen R. McElfresh
A Master’s paper submitted to the faculty of the School of Information and Library Science of the University of North Carolina at Chapel Hill
in partial fulfillment of the requirements for the degree of Master of Science in
Library Science.
Chapel Hill, North Carolina March 2013
Approved by
Table of Contents
Introduction ... 2
Literature Review ... 4
Selection Aides ... 4
E-books in Health Sciences Libraries ... 6
Analyzing E-book Usage ... 8
Correlation of Selection Guides and Use of Materials ... 9
Purpose ... 11
Research Design ... 12
Setting ... 12
Structure of Doody’s Core Titles ... 12
E-book Usage Statistics ... 13
Methods ... 15
Book Type ... 16
Data Analysis ... 17
Correlation ... 17
Other Usage Trends ... 18
Results... 19
Correlation ... 20
Usage by Score Quadrant ... 21
Usage by Essential Purchase Designation ... 23
Usage by Vendor ... 23
Usage by Major Classification ... 24
Usage by Category ... 25
Usage by Specialty ... 27
Usage by Book Type ... 28
Discussion ... 30
Limitations ... 34
Future Research ... 35
Conclusions ... 36
References ... 37
Appendix A: DCT E-books at HSL by Vendor... 40
Appendix B: Average Views and DCT Score by Subject Specialty – COUNTER Report 1 Titles ... 41
Introduction
Librarians have always had difficulty determining which titles will be most useful
to their patrons. In the health sciences, this can be particularly challenging, especially if
the collection development librarian does not have extensive knowledge of the subject
area for which he or she is selecting. Selection guides and core lists can help with this
problem as they provide suggestions and advice as to which titles to purchase. A core
title is defined as a resource “that represents essential knowledge needed by
professionals or students in a given discipline and is highly recommended for the
collection” (Doody’s Core Titles, 2012a). Library selectors often rely on core title lists to
determine which titles are most appropriate for their collections.
Selection of appropriate titles has become increasingly important in the advent
of shrinking book budgets. A 2009 survey by the Association of Academic Health
Sciences Libraries (AAHSL) found that 66.7% of the 106 responding libraries had
experienced budget cuts, and 81.9% did not expect their budgets to improve in the
coming years (Tooey, 2009). 53% of these libraries reduced expenditures in collections
in order to make the required cuts. Furthermore, the 2007-2008 edition of the AAHSL’s
Annual Statistics of Medical School Libraries in the United States and Canada found that
most health sciences libraries’ monograph budgets are continuing to decrease as more
funds are being shifted to the purchase of serials (as cited in Grigg, Koestner, Peterson,
use, requiring librarians to look at multiple metrics to assess usage of their collections
(Knievel, Wicht, & Connaway, 2006).
Most methods to predict future use rely on looking at data about the past, such
as interlibrary loan (ILL) and circulation data. Analyzing monograph loans is a good way
to determine what library patrons find useful because it highlights gaps in the collection.
In addition, studying circulation data can help inform future purchases because it allows
the collection development librarian to see what types of materials are most popular by
both subject and format. Furthermore, circulation data can assist librarians in making
decisions to remove materials from the collection or send materials to off-site storage
(Knievel et al., 2006). According to Revill, knowing what is being used in the collection is
an important part of collection management, and should be combined with other data,
such as user surveys and expert opinions to make collection decisions (as cited in
Literature Review
Selection Aides
As with other disciplines, collection development in the health sciences and
medical fields requires the use of multiple skills and resources. In order to make
selection decisions, library selectors must draw upon their education, experience, and
professional networks of colleagues (Richards, 1997). In addition, selectors must
consider many factors, such as the various needs of the library’s users, cooperative
collection agreements, the preservation of historical items, physical space, and budget
restrictions (Suess, 2004). Currency of materials is also especially important in the
health sciences, and library selectors must constantly be aware of new resources.
According to the 57th edition of the Library and Book Trade Almanac, over 7,000 new medical books were published in the year 2011, along with over 6,000 science
books and over 1,500 health and fitness books (Bogart, 2012, p. 515). The enormity of
the number of new titles published each year makes it impossible for health sciences
librarians to evaluate every single new title for their collections. Collection development
librarians depend on selection guides and core lists to help address this problem.
Various resources are available, such as lists produced by professional societies, as well
as publisher’s catalogs and reviews in medical journals like JAMA and The New England
Journal of Medicine (Suess, 2004). One of the most well-known health sciences
called the “Selected List of Books and Journals for the Small Medical Library,” or, the
Brandon-Hill list (Murphy & Buchinger, 1996; Suess, 2004). Brandon and Hill produced
this list of core titles for small libraries using their own expertise as well as the opinions
of faculty, colleagues, health professionals, and librarians (Shedlock & Walton, 2006).
By the time it was announced in 2004 that the Brandon-Hill list would no longer
be produced, the list had become so essential among librarians that members of the
Medical Library Association brainstormed various ideas to keep the list going. The
medical librarians ultimately decided to approach the makers of Doody’s Book Review
Service, a product that listed about 95% of the material published in the health sciences,
and ask them to create a replacement resource (Shedlock & Walton, 2006). Doody’s
agreed, and the resulting product was called Doody’s Core Titles.
Doody’s Core Titles, or DCT, is more sophisticated than the Brandon-Hill list
because it incorporates input from subject specialists and health sciences librarians.
Content specialists recommend titles for the list, and then librarians review the titles
and assign a score from 0 to 3 based on “authoritativeness of the author and/or
publisher, scope and coverage of the content, quality of the content, usefulness of the
titles, and value relative to the cost of the book” (Shedlock & Walton, 2006, p. 64).
Librarians with a subscription to DCT can view the rankings to find relevant titles for
their collections, and can feel comfortable making purchasing decisions knowing that
the titles have been vetted by other professionals in the health sciences. Since
suitable, DCT is a convenient resource because it has already obtained those expert
opinions and displays them as a numerical value.
Little research has been done to quantify the value of monograph selection
guides. Surveys of health sciences librarians conducted by Murphy an Buchinger (1996)
found that the vast majority of librarians with selection responsibilities viewed the
Brandon-Hill list as very useful or essential in making collection choices, and that the
inclusion of a title on the list was an important factor in purchasing decisions. Murphy
and Buchinger’s research also showed that although the Brandon-Hill list was originally
meant for use in small hospital libraries, many academic health sciences librarians also
found the lists helpful.
E-Books in Health Sciences Libraries
Many librarians are currently finding themselves faced with a choice between
purchasing monographs as print books or as electronic books (e-books). This is
especially the case for health sciences librarians as the e-book format has been found to
have several advantages over print. To begin with, e-books can be enhanced with video
and interactive images to enrich the learning experience. Furthermore, e-books can be
used more frequently than print books and if licenses permit, can be used by multiple
users at once. E-books also cannot be lost, stolen, or damaged. In addition,
Levine-Clark (2006) found that many users prefer e-books because they allow searching of the
text and can be accessed remotely. Ugaz and Resnick (2008) observed this to be
read from beginning to end. Studies done by Tucker (2012) at the University of Nevada
and Sprague and Hunter (2009) at the University of Idaho revealed that some of the
highest use of e-books was among titles in the health and life sciences.
Several studies have compared the use of print titles versus their electronic
counterparts. A study by Littman and Connaway (2004) found that the electronic
version of a monograph was used 11% more than the print version. However, this study
was done early after the adoption of e-books, so this figure would likely be much
different today. Ugaz and Resnick (2008) conducted a similar study and found that for
all of the titles they examined, the e-book version was used substantially more than the
print. Grigg et al. (2010) found that, as expected, e-books were used more frequently
than print books, likely because the electronic format is better suited to multiple uses.
Morgan (2010) also observed that electronic books were used more heavily than print,
especially when e-book use was promoted by librarians and within the classroom.
Researchers at the University of Pittsburgh Health Sciences Library System used
surveys to determine if there was any association between the type of book, such as
textbook or manual, and a user’s preference for electronic or print format (Folb, Wessel,
& Czechowski, 2011). They discovered that users preferred e-books for reference, but
the majority of respondents said they would use whatever format was most convenient
at the time of the information need. Hartel and Cheek (2011) had similar findings in
their study, with 75% of the participants saying they would use e-books as a reference
tool, and only 31.2% indicating they would use e-books for course readings. Folb et al.
their e-book collection was used most heavily for clinical, research, and individual study.
Attending physicians, interns, residents, fellows, medical students, and researchers
were the heaviest users of e-books, most likely because e-books can be accessed
remotely at the point of care (Folb et al., 2011).
Analyzing E-Book Usage
It is important to look at the circulation data for e-books, which is often called
“usage data” because books do not actually circulate. Statistics are supplied by
e-book vendors and provide information about the number of times a title has been
viewed, or “accessed” (Sprague & Hunter, 2009). These accesses can be examined to
find out a variety of things about an e-book collection. Tucker (2012) and Sprague and
Hunter (2009) analyzed vendor data to determine which subject areas had the highest
use of e-books. Ugaz and Resnick (2008) and Grigg et al. (2010) compared e-book usage
with print circulation to determine if patrons preferred one format over the other. Both
studies were focused on cutting costs in the library by eliminating duplicate purchases
of the same title in both electronic and print format. Sprague and Hunter (2009) also
examined e-book usage to determine the cost per use of titles, which assisted them in
making future collection decisions.
The literature has indicated that historically there have been some
inconsistencies in the way that vendors report usage statistics. Several researchers
mention difficulty in comparing vendor statistics across different platforms because of
2009). To address this issue, many researchers have limited their studies to just two or
three vendors in order to have a more reliable basis for comparison (Sprague & Hunter,
2009; Tucker, 2012; Ugaz & Resnick, 2008).
Project COUNTER (Counting Online Usage of NeTworked Electronic Resources) is
an international initiative working to set standards for vendor usage reports so that
librarians can make more valid comparisons between statistics from different vendors
(Project COUNTER, 2013). The first release of “The COUNTER Code of Practice for
Journals and Databases” was released in December 2002, and provided guidance on
which data elements should be measured, as well as how data should be reported
(COUNTER Online Metrics, 2012). In 2006, COUNTER released a Code of Practice for
electronic books and reference works, and an integrated version of the standards that
covers journals, e-books, databases, and multimedia (“The COUNTER Code of Practice
for E-Resources”) will be implemented by the end of 2013 (Project COUNTER, 2013).
After the initial review process to establish themselves as meeting COUNTER
requirements, vendors must undergo a yearly audit in order to remain listed in the
directory of COUNTER compliant vendors (Melnick, 2012).
Correlation of Selection Guides and Use of Materials
Although many studies have examined the use of e-books in health sciences
libraries, little is known about the relationship between selection guide
recommendations and circulation for either electronic or print books. Ugaz and Resnick
but did not attempt to form a relationship between a monograph’s presence or absence
on the list and usage. Schmidt and Eckerman (2001) compared the circulation of print
monographs on the Brandon-Hill list and three other selection aides against the
circulation of monographs that were not on a selection list. They found that the listed
books circulated more than 1.5 times more than the non-listed books.
A study by Grigg et al. (2010) at Duke University Medical Center Library &
Archives used several different metrics to assess a health sciences collection. In order to
determine if monographs in the collection were meeting user needs, the authors looked
at circulation data, Doody’s Core Title (DCT) score, and physical characteristics of the
book, such as size and number of pages, to determine if any of those traits made a book
more likely to circulate. While this research found no consistent correlation between
the DCT scores and circulation, the study was not focused specifically on titles included
in DCT, and many of the books examined were not in DCT at all. The Grigg et al. study is
insufficient to make any sort of conclusions about the usefulness of DCT scores in
selection decisions, and highlights the need for a more focused research study to
determine the relationship between DCT scores and usage statistics. This research
study looks only at titles included in DCT, which will hopefully provide a more reliable
Purpose
The purpose of this research is to determine if there is a correlation between the
score of titles in Doody’s Core Titles and the use of those titles once acquired by the
library. This study attempts to ascertain whether items that have received a high score
in DCT are useful to patrons, with the number of e-book accesses serving as a measure
of usefulness. While simply checking out or viewing a title cannot always determine if a
patron found a resource useful, circulation data are one of the few quantifiable
measures of usefulness available. Surveys can be used to assess whether or not patrons
found what they needed, but are beyond the scope of this research.
This research addresses a long-standing problem in the field of collection
development: predicting what will be useful to patrons. Usage metrics such as
circulation and ILL data, along with user surveys are reactive, and only assess what was
useful in the past. By determining the extent to which DCT scores and usage correlate,
the DCT score can be validated as a predictor of use.
A secondary purpose of this study is to determine if there are any trends in
e-book usage according to vendor, subject classification, e-book type, and DCT essential
purchase designation. Determining if e-book use is higher for certain types of materials
Research Design
Setting
This study was conducted at The University of North Carolina at Chapel Hill
(UNC) Health Sciences Library (HSL). The HSL is the primary library for UNC’s Schools of
Medicine, Nursing, Dentistry, Public Health, and Pharmacy, as well as the Department of
Allied Health Sciences and the hospitals of the UNC Health Care system. According to
data from 2011, the HSL owns or has access to over 9,000 electronic books (UNC Health
Sciences Library, 2013).
Structure of Doody’s Core Titles
Core titles are resources that represent essential knowledge on a given subject
(see page 2 for complete definition). Doody’s Core Titles produces an annual list which
covers 121 subject specialties in the health sciences (Doody’s Core Titles, 2012a). Users
can view the entire list of titles, browse by specialty, or search for a particular title,
author, or publisher. There are also multiple filters that allow the list to be limited by
factors like price, format, and/or score.
Titles are scored through a 4-step process (Doody’s Core Titles, 2012b). First,
content specialists in each of the 121 specialty areas make title selections. Second, up
to 3 library selectors review the selections and add titles to the list if necessary. Third,
= good, 2 = very good, and 3 = excellent) for each of five different collection criteria.
The five criteria are: “authoritativeness of author and publisher, scope and coverage of
the subject matter, quality of content (including timeliness), usefulness and purpose,
and value for money” (Doody’s Core Titles, 2012b). The scores are averaged together,
and any titles receiving a score of less than 1 are removed from the final list. The fourth
and final step in the scoring process is for the library selectors to determine if the title is
an ‘essential purchase’ in a given specialty. If at least two librarians select a title as an
essential purchase, it will be designated as such on the DCT list. In 2012, there were 87
healthcare professionals serving as content specialists, and 104 volunteer librarians
serving as library selectors. The names and affiliations of these individuals are available
on the Doody’s Core Titles website.
For each title in the DCT, basic information about the book is listed, such as title,
author(s), editor(s), ISBN, publisher, and price. A brief description of the book is also
provided, along with the average DCT score. Users with a subscription to the Premium
version of DCT can view additional features such as full reviews and ratings by content
reviewers (Doody’s Core Titles, 2012a).
E-Book Usage Statistics
E-books were chosen for this study because the literature has indicated a
preference for the e-book format among users in the health sciences (see Literature
counting e-book accesses can vary from vendor to vendor, initiatives such as Project
COUNTER have attempted to standardize the way e-book statistics are reported.
The COUNTER Code of Practice for Books and Reference Works (Release 1)
allows statistics to be reported in one of six report formats. Book Report 1 reports the
number of title requests by month, with a request defined as “when a user requests to
view, download, or print part of a title successfully and certain http return codes result”
(Cox & Gurke, 2008, p. 76). Book Report 2 differs from Report 1 because it reports the
number of requests per section, meaning a chapter or other subdivision of a book,
rather than by the entire title. Report 2 statistics can be difficult to compare because of
differences in the way vendors subdivide and index their content (Cox & Gurke, 2008).
Book Reports 3 and 4 both count the number of turnaways, which result from an
unsuccessful login or when the number of simultaneous user licenses has been
exceeded (COUNTER Online Metrics, 2006). Book Reports 5 and 6 both count the
number of searches within either an individual title or a collection of titles. The number
of searches is not always a meaningful statistic because a high number can indicate
either that the resource is highly used, or that the resource is not well-indexed and
users must perform multiple searches to find the information they need (Cox & Gurke,
Methods
The first step in this study was to determine how many e-book titles in DCT are
owned or licensed by the UNC Health Sciences Library. A list of those titles in DCT that
are available in e-book format was obtained using the filtering options in the DCT
interface, and this list was exported into an Excel spreadsheet. This file included all of
the pertinent information about each book, such as title, author, publisher, subject,
ISBN, and DCT score. The list of titles was obtained using the 2010 edition of DCT,
meaning all of the titles used in the analysis were published in 2010 or earlier. This was
done in order to allow enough time for the titles to circulate.
The DCT list was compared to the holdings in the HSL catalog using the ISBN
number in order to determine to which books the HSL has access. In some cases, it was
necessary to do a title search because the ISBN in the catalog record did not match the
ISBN in DCT. For these books, the title, author, and edition were compared in order to
ensure the information matched the DCT listing. For the books that were available
through the HSL, the vendor that provides access to each title was recorded.
The list of titles in DCT to which the HSL has access was then sorted by vendor.
Vendors with less than 10 titles were eliminated in order to limit inconsistencies in the
eighteen month period from January 1, 2011 to June 30, 2012, and the number of
accesses or views of a title was recorded into the spreadsheet.
Statistics were obtained for each of the eight vendors that had more than 10
titles. Unfortunately, among these eight vendors, three different reporting formats
were used, resulting in the elimination of three of the vendors from further analysis.
The remainder of the usage data had to be divided into two sets based on COUNTER
report type, and all data analysis was performed once for each set of data.
Book Type
In order to determine book type, titles were searched on Amazon.com, and the
summary and table of contents was examined. Four book type categories were used:
atlas, defined as a reference work comprised mostly of images and illustrations; manual,
defined as a how-to or step-by-step guide to performing a clinical or laboratory
procedure; handbook, defined as a reference work organized for quick and easy access;
and textbook, defined as a book meant to be read from beginning to end, and organized
from general to specific.
A book was classified based on how the work was meant to be used, not how it
might actually be used. For instance, textbooks could be used for reference and
handbooks could be used as textbooks. Also, books classified as textbooks are not
necessarily being used as course textbooks. Classification decisions were subjective and
Data Analysis
Correlation
Correlation of the DCT score and number of uses was performed using IBM
SPSS® Statistics software, Version 20.0. In order to determine if the distribution of each
data set was parametric (normal) or non-parametric, each set’s kurtosis and skewness
were calculated using SPSS. For each variable in each data set, a z-score was calculated
for both kurtosis and skewness to determine if they fell within the range for a normal
distribution.
For the variable “total number of views”, the data did not follow a normal
distribution. Also, because the “total views” variable is ordinal, non-parametric
correlation statistics, such as Spearman’s rho or Kendall’s tau, must be used for analysis
(Wildemuth, 2009). Both of these correlation coefficients are calculated by ranking the
data from smallest to largest and performing calculations based on these ranks, rather
than on the values of the raw data. According to Weaver (1989), Kendall’s tau should be
used when the distances between the absolute values of data points are unequal and
there are a few high or low outliers. Spearman’s rho is appropriate to use when the
data are distributed fairly equally and there are eight or more ranks. For this data set,
there are more than eight ranks, which would suggest using Spearman’s rho. However,
appropriate. For these reasons, both Kendall’s tau and Spearman’s rho were calculated
and reported for this study.
A perfect positive correlation of +1.0 would mean higher DCT scores have higher
usage, and a perfect negative correlation of -1.0 would indicate an inverse relationship,
or that higher DCT scores have lower usage. A correlation of zero would indicate no
relationship between the two variables.
Other Usage Trends
In addition to calculating the correlation coefficients, the data were examined
for trends in usage by vendor, subject classification, essential purchase designation, and
book type. To examine these trends, the average DCT score and average number of
total views were calculated for each unit of analysis. Standard deviations were also
Results
The 2010 edition of Doody’s Core Titles contains 2,192 books on the Unique Title
List. The list was limited to only those books available in e-book format using the filters
in the DCT interface, which brought the number of titles down to 1,222. The HSL had
access to 373 of these titles across 23 different vendors. Appendix A shows how many
titles were supplied by each vendor.
At the time the catalog searches were done in January 2013, the HSL had just
obtained access to a new product from Elsevier called Clinical Key. This resource
replaced MD Consult and drastically increased the number of e-books available at the
HSL. However, because the resource was just obtained in December 2012, no statistics
were available for the vast majority of the Clinical Key books. Oxford University Press
was also a new subscription for the library, and thus, no statistics were available for this
resource either. In addition to these two vendors, all vendors providing access to less
than 10 titles were eliminated from the list.
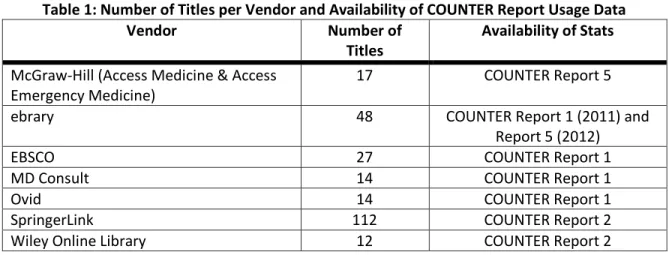
Usage reports in COUNTER format were obtained for the eight remaining
vendors (see Table 1). Three vendors (MD Consult, Ovid, and EBSCO) provided statistics
in COUNTER Book Report 1 format, which reports the number of successful title
requests by month. Two vendors (Springer and Wiley) reported statistics in Book Report
2 format, which counts the number of successful section requests by month. Access
in Report 5 format, which reports the total searches and sessions by month and title.
The final resource, ebrary, reported 2011 statistics as Report 1 and 2012 statistics as
Report 5, and was therefore eliminated from further analysis. Because Access Medicine
and Access Emergency Medicine together only had 17 titles, which was not a large
enough data set from which to draw meaningful conclusions, these two vendors were
eliminated from further analysis. This left EBSCO, MD Consult, Ovid, SpringerLink, and
Wiley to be used in the final analysis. 10 SpringerLink titles and one MD Consult title did
not have usage data available and were eliminated from the sample.
Table 1: Number of Titles per Vendor and Availability of COUNTER Report Usage Data
Vendor Number of
Titles
Availability of Stats
McGraw-Hill (Access Medicine & Access Emergency Medicine)
17 COUNTER Report 5
ebrary 48 COUNTER Report 1 (2011) and Report 5 (2012)
EBSCO 27 COUNTER Report 1
MD Consult 14 COUNTER Report 1
Ovid 14 COUNTER Report 1
SpringerLink 112 COUNTER Report 2
Wiley Online Library 12 COUNTER Report 2
Correlation
Correlations for the Report 1 titles and the Report 2 titles were performed
separately in SPSS. For the Report 1 titles (MD Consult, Ovid, and EBSCO) Kendall’s tau
was 0.217 and Spearman’s rho was 0.314, both of which indicate a slight positive
correlation (See Table 2). Both calculations were found to be statistically significant,
Table 2: Correlation Results for COUNTER Report 1 Titles (EBSCO, MD Consult, Ovid)
Spearman’s rho Kendall’s tau
Correlation 0.314 0.217
2-tailed significance (p) 0.021 0.027
For the Report 2 books (Springer and Wiley), the correlation coefficient was
nearly 0 for both tau and rho (see Table 3). In addition, neither correlation was
statistically significant, with p values much greater than 0.05. The correlation could
have been affected by multiple outliers in this data set. 14 books were not used at all,
and one title had approximately twice the number of views than the next highest book.
These outliers were removed and the correlations were re-calculated (see Table 3). The
removal of the outliers increased the value of the correlation coefficients slightly and
decreased the p values, but the correlations were still not statistically significant.
Table 3: Correlation Results for COUNTER Report 2 Titles (Springer and Wiley)
Spearman’s rho Kendall’s tau
Correlation 0.004 0.005
2-tailed significance (p) 0.964 0.937
With High and Low Outliers removed
Correlation 0.094 0.066
2-tailed significance (p) 0.379 0.378
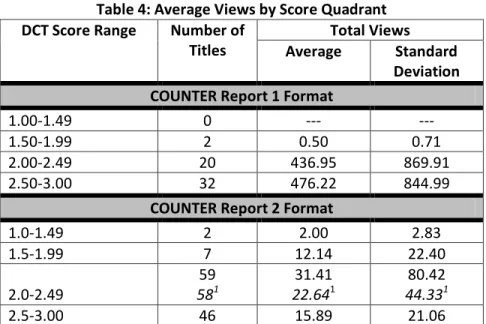
Usage by Score Quadrant
Although the original intention of this study was to show a statistical correlation
between DCT score and usage, the correlation results were not conclusive. As an
alternative, the titles were sorted into four score quadrants (1.00-1.49, 1.50-1.99,
2.00-2.49, and 2.50-3.00), and the average use was calculated for each quadrant. The results
quadrant (476.21 views), but only slightly more than the 2.00-2.49 quadrant (436.95
views). The 1.50-1.99 quadrant received dramatically fewer views, with an average of
0.50 views. There were no titles in the lowest quadrant.
For Report 2, it is clear that titles in the lowest quadrant are used the least, with
only 2.0 average views. The 2.00-2.49 quadrant had the highest use, with 31.41 average
views. However, the presence of an extreme outlier in this quadrant may have caused
the increased score. When this title was removed, the average was lowered to 22.64
views, which still makes the titles in this quadrant the most highly used. Titles in the
highest score quadrant were used an average of 15.89 times. Although the highest
scores did not receive the highest average use, the titles with scores above 2.0 still
received more average views than the titles with scores below 2.0.
Table 4: Average Views by Score Quadrant
DCT Score Range Number of
Titles
Total Views
Average Standard
Deviation COUNTER Report 1 Format
1.00-1.49 0 --- ---
1.50-1.99 2 0.50 0.71
2.00-2.49 20 436.95 869.91 2.50-3.00 32 476.22 844.99
COUNTER Report 2 Format
1.0-1.49 2 2.00 2.83
1.5-1.99 7 12.14 22.40
2.0-2.49
59
581
31.41
22.641
80.42
44.331
2.5-3.00 46 15.89 21.06
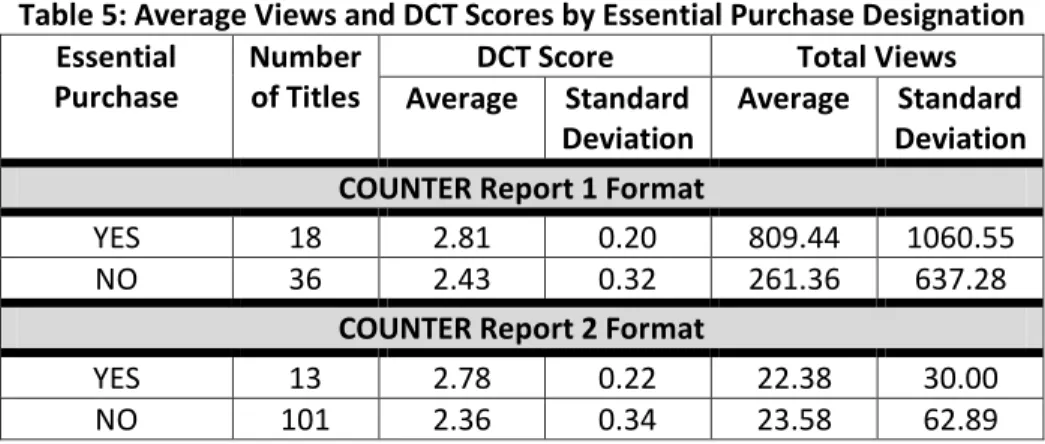
Usage by Essential Purchase Designation
DCT evaluators can also choose whether or not a given title should be designated
as an essential purchase title, and this information is made available in the DCT listing.
As would be expected, DCT scores are higher for essential purchase titles than for
non-essential purchase titles. Usage was averaged based on non-essential purchase designation,
and the results are available in Table 5. For the Report 1 titles, essential purchase titles
are clearly used more than non-essential purchase titles, with 809.44 average views
compared to 261.36. However, for Report 2, the average use is virtually equal for
essential purchase and non-essential purchase titles (22.38 vs. 23.58 average views).
This could be due to differences in the way Report 2 usage is determined.
Table 5: Average Views and DCT Scores by Essential Purchase Designation Essential
Purchase
Number of Titles
DCT Score Total Views
Average Standard
Deviation
Average Standard
Deviation COUNTER Report 1 Format
YES 18 2.81 0.20 809.44 1060.55 NO 36 2.43 0.32 261.36 637.28
COUNTER Report 2 Format
YES 13 2.78 0.22 22.38 30.00 NO 101 2.36 0.34 23.58 62.89
Usage by Vendor
Table 6 shows the average DCT score and usage by each vendor. For the Report
1 books, MD Consult was by far the most popular vendor, with an average of 1425.62
views, with all titles used at least once. Ovid was second most popular, with 378.36
views on average. EBSCO books only had an average of 5.51 views, but this could be
that the Ovid and MD Consult books had higher average DCT scores (2.69 and 2.63
respectively) than the EBSCO titles (2.46).
Table 6: Usage by Vendor
Vendor Number
of Titles
DCT Score Total Views Number
with 0 Views
% with 0 Views
Average Standard
Deviation
Average Standard
Deviation COUNTER Report 1 Format
MD Consult 13 2.63 0.33 1425.62 1086.00 0 --- Ovid 14 2.69 0.22 378.36 620.51 0 --- EBSCO 27 2.46 0.37 5.52 12.19 12 44.44%
Total 54 2.56 0.34 444.06 834.85 12 22.22%
COUNTER Report 2 Format
SpringerLink 102 2.40 0.33 25.46 62.98 22 21.57% Wiley 12 2.47 0.49 6.33 12.64 4 33.33%
Total 114 2.40 0.35 23.45 59.96 26 22.81%
For the Report 2 vendors, Springer books were viewed most often, with an
average of 25.46 views. Although the average DCT score for Wiley (2.47) was higher
than Springer (2.40), Wiley books were used only 6.33 times on average.
When looking across all vendors, the Report 1 books were used more than the
Report 2 books (444.06 average views vs. 23.45). However, since the statistics are in
different COUNTER formats, it is not possible to make any definitive comparisons
between these two data sets. For both the Report 1 and Report 2 books, approximately
22% of the titles were not viewed at all during the 18-month time period examined.
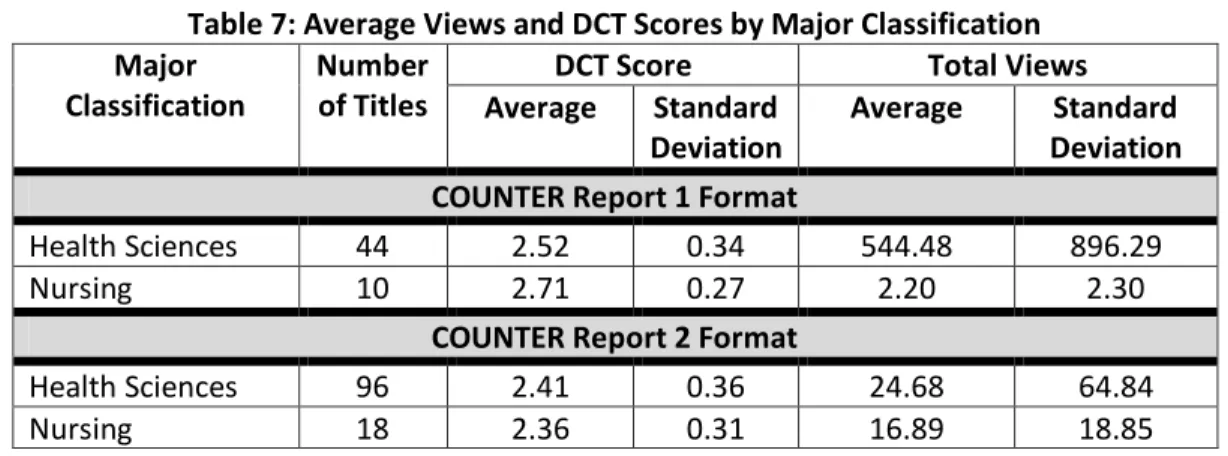
Usage by Major Classification
Doody’s Core Titles has three different subject classifications. The broadest, or
titles were sorted based on this classification, and DCT scores and number of views were
averaged for each classification (see Table 7). For both Report 1 and Report 2, titles in
the Health Sciences classification were used more than the titles in the Nursing
classification, although the difference was much more dramatic with the Report 1 books
(544.48 average views vs. 2.2) than the Report 2 books (24.68 average views vs. 16.89).
Table 7: Average Views and DCT Scores by Major Classification Major
Classification
Number of Titles
DCT Score Total Views
Average Standard
Deviation
Average Standard
Deviation COUNTER Report 1 Format
Health Sciences 44 2.52 0.34 544.48 896.29 Nursing 10 2.71 0.27 2.20 2.30
COUNTER Report 2 Format
Health Sciences 96 2.41 0.36 24.68 64.84 Nursing 18 2.36 0.31 16.89 18.85
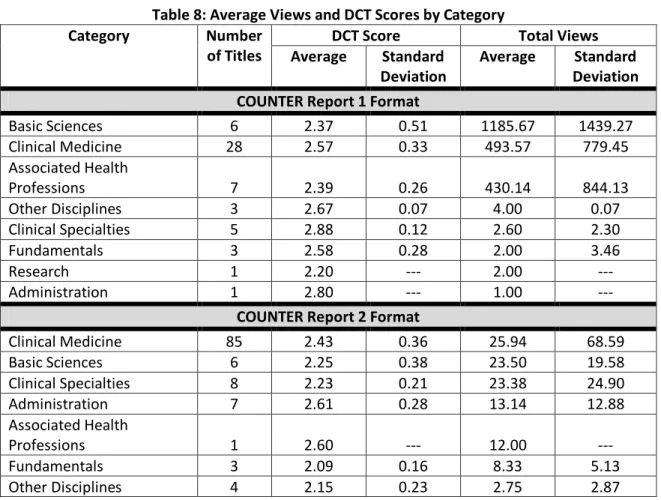
Usage by Category
Within the Major Classification, multiple categories are used. Table 8 shows the
comparison of categories for Report 1 and Report 2. With the Report 1 books, Basic
Sciences clearly has the most views, with an average of 1185.67. It is worth mentioning
that this category contains a very highly used atlas which may have inflated the average.
Clinical Medicine and Associated Health Professions follow with 493.57 and 430.14
average views, respectively. Administration, Clinical Specialties, Fundamentals,
Research, and Other Disciplines had between 1 and 4 average views each. The two
areas with the highest average DCT score, Administration and Clinical Specialties, had
Table 8: Average Views and DCT Scores by Category
Category Number
of Titles
DCT Score Total Views
Average Standard
Deviation
Average Standard
Deviation COUNTER Report 1 Format
Basic Sciences 6 2.37 0.51 1185.67 1439.27 Clinical Medicine 28 2.57 0.33 493.57 779.45 Associated Health
Professions 7 2.39 0.26 430.14 844.13 Other Disciplines 3 2.67 0.07 4.00 0.07 Clinical Specialties 5 2.88 0.12 2.60 2.30 Fundamentals 3 2.58 0.28 2.00 3.46
Research 1 2.20 --- 2.00 ---
Administration 1 2.80 --- 1.00 ---
COUNTER Report 2 Format
Clinical Medicine 85 2.43 0.36 25.94 68.59 Basic Sciences 6 2.25 0.38 23.50 19.58 Clinical Specialties 8 2.23 0.21 23.38 24.90 Administration 7 2.61 0.28 13.14 12.88 Associated Health
Professions 1 2.60 --- 12.00 --- Fundamentals 3 2.09 0.16 8.33 5.13 Other Disciplines 4 2.15 0.23 2.75 2.87
Within the Report 2 books, average use by Category is much less widely
dispersed. Basic Sciences, Clinical Medicine, and Clinical Specialties are closely tied at
approximately 23-25 average views each. Administration and Associated Health
Professions had approximately 12-13 average views each, followed by Fundamentals
with 8.33 and Other Disciplines with 2.75. Administration and Associated Health
Professions had the highest average DCT score (≈2.6), but had lower average views than
Usage by Specialty
DCT also classifies titles into one of 121 specialty areas. The average number of
views and average DCT score were calculated for each specialty. The full list of Report 1
specialties, ranked from highest to lowest average use, can be seen in Appendix B. For
the Report 1 titles, Anatomy/Embryology was the most viewed subject area, with 3573
views. It should be noted that there was only one book in this specialty, making this
title the most popular of the Report 1 books. The next most viewed specialty area was
Gastroenterology (2769 views), which was also comprised of only one title. Pharmacy
(2312 views), Emergency Medicine (2047 views), Dermatology (1710 views), and
Pathology (1602.5 views) were also highly viewed with well over 1000 average views
each.
Because there were more total books in Report 2 format (n=114), there were
also more specialty areas than there were for the Report 1 books (55 vs. 38,
respectively). For the Report 2 titles, Surgical Pathology was the most highly viewed
specialty, with 540 views. However, there was only one title in this specialty, making
this the most highly viewed book within the Report 2 division. The next most popular
specialty was Pediatrics (190 views), followed by General Surgery (63 views), Plastic and
Reconstructive Surgery (62.33 views), Psychiatry (59.5 views), and Gastrointestinal
Surgery (56.667 views). Some of the mostly highly viewed titles within the Report 2
group were titles relating to surgery. The full list of Report 2 specialties, ranked from
It should be noted that many of the most popular specialties were comprised of
only one title. This makes it difficult to determine if the subject area at large is highly
used, or just the one individual title. There are also some interesting differences in
specialty usage across data sets. For instance, Emergency Medicine was a very popular
specialty in the Report 1 group, but was not used at all in the Report 2 group. Similarly,
Pediatrics was the second most used specialty in the Report 2 set, but was 18th in the
Report 1 set. However, because the usage data are not available in the same COUNTER
format, it is difficult to make comparisons about the use of a particular specialty across
data sets.
Usage by Book Type
Comparisons were also made regarding usage by book type. Table 9 shows the
average DCT score and average total views based on the designated book type.
Table 9: Average Views and DCT Score by Book Type
Book Type Number
of Titles
DCT Score Total Views
Average Standard
Deviation
Average Standard
Deviation COUNTER Report 1 Format
Atlas 1 2.47 --- 3573.00 --- Handbook 24 2.62 0.32 741.88 942.99 Manual 3 2.78 0.08 155.67 260.97 Textbook 26 2.48 0.36 82.08 176.19
COUNTER Report 2 Format
For Report 1, the most popular book type was atlas, with 3573 views. However,
this usage was all for a single title. The second most popular book type was handbook
with 741.88 average views, followed by manual with 155.67 views. Textbook had the
lowest number of average views, with 82.08.
For Report 2, the most popular book type was manual with 63.54 average views,
followed by atlas (55.17), then handbook (26.38). Again, textbook had the lowest
Discussion
An unexpected complication of this study was the difficulty in obtaining usage
metrics in the same format across vendors. While the COUNTER Project has
standardized the way usage data is measured and reported, the availability of multiple
options of reporting this data makes it difficult to compare usage across different
book platforms. Additional progress is needed to help standardize usage metrics for
e-books so that all data is available in the same format. Because the data in this study had
to be split into two distinct data sets, it is difficult to draw conclusions about usage on a
large scale.
For the titles with usage data in COUNTER Report 1 format, there was a slight
positive correlation between DCT score and usage, which suggests a potential tendency
for books with higher DCT scores to have higher usage. However, the Report 2 titles had
almost no correlation, and the correlation calculation was not statistically significant at a
95% confidence level. While removing the titles with no views and the title with
extremely high views helped, a statistically significant correlation coefficient could not
be determined. This could be due to differences in the Report 2 format, which counts
usage by section rather than by title. The average number of views for the Report 2
titles is significantly lower than that of the Report 1 titles (see Table 2), which could be
due to the way views are measured. Having all of the usage data in Report 1 format
COUNTER Report 1 format is generally thought to be a more useful report
because it measures the number of accesses by title. Report 2 measures access by
‘section’, which can be problematic because what constitutes a ‘section’ is not standard
from book to book (Cox & Gurke, 2008). Differences in the way content is subdivided
from one title to another can cause skewed data, which could account for some of the
difficulties in this study that occurred with Report 2 data. Since ‘title’ is a more standard
unit of measure, Report 1 statistics are easier to compare between vendors.
The calculation of the correlation coefficient could have also been affected by
the low number of titles in either data set that had DCT scores below 2.0. The potential
range for a given title on the DCT list is between 1.0 and 3.0, but only 11 titles analyzed
in this study scored between 1.0 and 2.0. According to Wildemuth (2009), if the range
of data does not cover all of the possible values, the correlation may be
underestimated. A potential reason for the limited number of titles with scores below
2.0 is that these titles are generally not purchased, especially if there is an equivalent
title available with a higher score.
There were a large number of titles in the Report 2 data set that received only
1-5 views. Part of the reason for this is that the SpringerLink books are purchased as a
package, rather than individually selected based on estimated user needs. For the other
vendors used in this study, books are chosen on an individual basis, which may account
for their higher average use. Purchasing titles as a package saves money and reduces
Because the results of the correlation were inconclusive, DCT scores were
broken down into four quadrants, and average use was calculated for each. This
analysis proved more useful for showing trends than performing the correlation. Again,
for Report 1, the results are more conclusive as it can clearly be seen that books with
higher DCT scores have higher usage. However, there are only 2 titles in the Report 1
data set with scores less than 2.0, so this could have impacted the results. For Report 2,
highest average usage did not correspond perfectly with highest DCT scores. However,
it is still clear that books with scores above 2.0 have higher usage than those below 2.0.
Similarly, comparing usage by essential purchase designation was clear for
Report 1 titles but not Report 2. Essential purchase titles, which have higher average
DCT scores, were used significantly more than non-essential purchase titles in the
Report 1 data set, but were about equal in the Report 2 data set. Again, differences in
the way usage is measured could account for this discrepancy.
Looking at all of the data that compares DCT score with number of views, books
with higher DCT scores generally had higher usage. While the data suggest a slight
positive correlation, it could not be confirmed because usage statistics were not
available in the same format across all vendors.
The titles classified in the Health Sciences major classification were used more
than the Nursing titles across both data sets. This is most likely because there are more
students in the broader classification of health sciences professions, which includes
medicine, dentistry, pharmacy, and allied health, than just nursing by itself. The highest
anatomy, emergency medicine, surgical pathology, gastroenterology, dermatology, and
anesthesiology. Surgery books were also highly used. Books pertaining to allied health
professions, such as pharmacy and physical therapy, as well as nursing were less
popular. This is mostly likely because there are more potential users of medical books
as the UNC School of Medicine has the highest enrollment. Furthermore, these books
would also appeal to the medical staff at UNC’s hospitals. This trend is consistent with
research done by Folb et al. (2011) which found that medical students, interns,
residents, and physicians were heavy users of e-books.
It should be noted that there are many specialty areas that were not covered in
this analysis. 38 specialties were represented in Report 1 and 55 in Report 2, but there
are 121 specialty designations used in DCT. Other specialty areas were eliminated when
vendors were removed from the study, and it is not known how the inclusion of these
titles would have affected the results of the study.
For both report types, textbooks accounted for the largest number of books, but
had the lowest average usage. The remaining three book types, atlases, handbooks, and
manuals, which can be grouped together as reference books, had much higher average
views. Textbooks were classified as such because their organizational structure
indicated that they would generally be read from beginning to end. In contrast,
reference books are organized for quick and easy access, and are designed to be read in
sections. The higher average use of reference books is consistent with previous
research which found that users prefer the e-book format for reference, and prefer
2011; Ugaz & Resnick, 2008). Because e-books are searchable and can be enhanced
with video and high resolution images, they are well suited for quick reference.
Furthermore, e-books do not require a trip to the library and can easily be accessed at
the point of care.
Limitations
As mentioned previously, a major limitation of this study was the lack of usage
data in the same format across all vendors. The data had to be split into two sets for
analysis, and it is difficult to make comparisons about usage across sets. Also, many
titles had to be eliminated from the analysis because usage metrics were not available in
either COUNTER Report 1 or 2 formats. The ability to analyze all of the HSL’s e-book
titles on the Doody’s Core Title list might have provided different results.
Another limitation is that the sample of e-books was not representative of the
full range of DCT scores. There were only 11 books used in the study that had DCT
scores less than 2.0, possibly because the library is less likely to purchase titles that
received low scores in Doody’s Core Titles. Furthermore, because the titles that are
given to library selectors for scoring have been selected for evaluation by subject
experts, it makes sense that the majority of titles will be of high quality, and thus have
higher DCT scores.
This study also did not determine if any of the included books were course
textbooks or on class reading lists, which would definitely have had an impact on their
edited by UNC faculty. These books would likely have higher average use than books
not associated with UNC. Furthermore, e-books that allow more than one simultaneous
user could have higher use than e-books that only allow one user at a time, but these
restrictions were not considered in this analysis.
In this study, the number of e-book accesses was used as a placeholder for
usefulness. However, just because an e-book was accessed does not mean that the
book was useful to the patron or that the desired information was found within the title.
Furthermore, accesses are counted the same whether the patron looks at the entire
book or just one page. However, this problem is similar to using print statistics, which
also cannot determine if patrons actually read the books they checked out or found the
books useful. Despite their limitations, usage counts and circulation data can be a
convenient and quantifiable measure of usefulness.
Future Research
Because circulation data can only estimate usefulness, a potential area for future
research would be to survey users about their e-book needs and preferences. Users
could be asked to evaluate books on the DCT list for their potential usefulness. It would
also be interesting to compare the usage of books on the DCT list versus those not on
the DCT list to determine if there are any statistical differences. This type of study has
been done before (Schmidt & Eckerman, 2001), but not using Doody’s Core Titles.
Another potential area for further research would be to obtain usage data for DCT titles
Conclusions
Selection guides continue to be essential tools for librarians, especially given the
large number of titles available for purchase and the budget limitations most libraries
are currently facing. Establishing a link between Doody’s Core Title scores and usage
will help collection development librarians feel more comfortable choosing titles from
the DCT list for their collections, knowing that there is a strong chance the titles will be
used by their patrons. While the data suggest a positive relationship between higher
DCT scores and usage, this study was not able to conclusively prove this link. A potential
reason for this is the unavailability of usage data in the same reporting format across all
vendors. The ability to analyze a larger number of titles from more vendors might have
resulted in more reliable conclusions.
By looking at other aspects of e-book usage among the titles analyzed, several
trends can be seen. First, there appears to be higher use of reference books over
textbooks, likely because the e-book format is well suited for quick and easy access to
information. Second, titles in clinical specialties appear to be most popular.
Establishing these trends may help guide collection development librarians in making
future purchasing decisions and will improve service to patrons in health sciences
References
Bogart, D. (Ed.). (2012). Library and Book Trade Almanac (57th ed.). Medford, NJ: Information Today, Inc.
COUNTER Online Metrics. (2006). The COUNTER Code of Practice: Books and Reference
Works: Release 1 (pp. 1–39). Retrieved from
http://www.projectcounter.org/cop/books/cop_books_ref.pdf
COUNTER Online Metrics. (2012). The COUNTER Code of Practice for e-Resources:
Release 4 (pp. 1–29). Retrieved from http://projectcounter.org/r4/COPR4.pdf
Cox, L., & Gurke, S. (2008). COUNTER usage reports: What’s good for the goose is nuts for the gander. In B. R. Bernhardt, T. Daniels, & K. Steinle (Eds.), Charleston
Conference Proceedings 2007 (pp. 74–81). Westport, Conn.: Libraries Unlimited.
Doody’s Core Titles. (2012a). Doody’s Core Titles In the Health Sciences 2012 - Process Overview. Retrieved February 2, 2013, from
http://www.doody.com/dct/Content/DCTProcess.asp?SID={072940F5-F2A0-47D6-8D6A-6A2A9B2B3FAD}
Doody’s Core Titles. (2012b). Doody’s Core Titles in the Health Sciences 2012 - Frequently Asked Questions. Retrieved February 2, 2013, from
http://www.doody.com/dct/CustomerServiceCenter.asp?SID={072940F5-F2A0-47D6-8D6A-6A2A9B2B3FAD}#k
Folb, B. L., Wessel, C. B., & Czechowski, L. J. (2011). Clinical and academic use of
electronic and print books: the Health Sciences Library System e-book study at the University of Pittsburgh. Journal of the Medical Library Association : JMLA, 99(3), 218–28. doi:10.3163/1536-5050.99.3.009
Grigg, K. S., Koestner, B. A., Peterson, R. A., & Thibodeau, P. L. (2010). Data-Driven Collection Management: Through Crisis Emerge Opportunities. Journal of Electronic
Resources in Medical Libraries, 7(1), 1–12. doi:10.1080/15424060903585685
Hartel, L. J., & Cheek, F. M. (2011). Preferred book formats in an academic medical center. Journal of the Medical Library Association, 99(4), 313–317.
doi:10.3163/1536-5050.99.4.011
Levine-Clark, M. (2006). Electronic Book Usage: A Survey at the University of Denver.
portal: Libraries and the Academy, 6(3), 285–299. doi:10.1353/pla.2006.0041
Littman, J., & Connaway, L. S. (2004). A Circulation Analysis of Print Books and E-Books in an Academic Research Library. Library Resources and Technical Services, 48(4), 256–262.
Melnick, T. (2012). Project COUNTER. AALL Spectrum, 16(7), 3–5. Retrieved from
http://search.ebscohost.com/login.aspx?direct=true&db=llf&AN=77477137&site=e host-live&scope=site
Morgan, P. S. (2010). The Impact of the Acquisition of Electronic Medical Texts on the Usage of Equivalent Print Books in an Academic Medical Library. Evidence Based
Library and Information Practice, 5(3), 5–19. Retrieved from
http://ejournals.library.ualberta.ca/index.php/EBLIP/article/view/8040
Murphy, S. C., & Buchinger, K. (1996). Academic health sciences librarians’ use of the Brandon-Hill selected list in book selection activities: results of a preliminary descriptive study. Bulletin of the Medical Library Association, 84(3), 427–432. Retrieved from http://www.ncbi.nlm.nih.gov/pmc/articles/PMC226166/
Project COUNTER. (2013). Project COUNTER - About COUNTER. Retrieved February 25, 2013, from http://projectcounter.org/about.html
Richards, D. T. (1997). Collection development and assessment in health sciences
libraries. Chicago, IL: Medical Library Association; Scarecrow Press.
Schmidt, C. M., & Eckerman, N. L. (2001). Circulation of core collection monographs in an academic medical library. Bulletin of the Medical Library Association, 89(2), 165. Retrieved from http://www.ncbi.nlm.nih.gov/pmc/articles/PMC31723/
Shedlock, J., & Walton, L. J. (2006). Developing a virtual community for health sciences library book selection: Doody’s Core Titles. Journal of the Medical Library
Association : JMLA, 94(1), 61–6. Retrieved from
http://www.ncbi.nlm.nih.gov/pmc/articles/PMC1324773/
Sprague, N., & Hunter, B. (2009). Assessing e-books: Taking a closer look at e-book statistics. Library Collections, Acquisitions, & Technical Services, 32(3), 150–157. doi:10.1016/j.lcats.2008.12.005
Tooey, M. J. (2009). Hard Time Survey Summary Report - Winter 2009. Seattle: Association of Academic Health Sciences Libraries.
Tucker, J. C. (2012). Ebook collection analysis: subject and publisher trends. Collection
Building, 31(2), 40–47. doi:10.1108/01604951211229836
Ugaz, A. G., & Resnick, T. (2008). Assessing print and electronic use of reference/core medical textbooks. Journal of the Medical Library Association: JMLA, 96(2), 145. doi:10.3163/1536-5050.96.2.145
UNC Health Sciences Library. (2013). Data About the Library. Retrieved March 2, 2013, from http://hsl.lib.unc.edu/librarydata
Weaver, D. H. (1989). Basic Statistical Tools. In G. H. Stempell III & B. H. Westley (Eds.),
Research Methods in Mass Communication (2nd ed., pp. 49–89). Englewood Cliffs,
NJ: Prentice-Hall.
Wildemuth, B. M. (2009). Applications of social research methods to questions in
Appendix A: DCT E-books at HSL by Vendor
Vendor Number of Titles
Academic Search Complete 3 Access Emergency Medicine 4
Access Medicine 10
Cambridge Books Online 5
Clinical Key* 79
ebrary 37
EBSCO 23
MD Consult 14
MyiLibrary 3
National Academies Press Publications 4 Oncology Nursing Society 5
Ovid 14
Oxford University Press Scholarship Online* 13
Psychiatry Online 1
R2 Digital Library 8
Sage 2
Scriver's OMMBID 1
Springer Protocols 5
SpringerLink 112
STAT!Ref 2
STATSnetBase 1
Wiley Online Library 12
Clinical Key and ebrary 7
Clinical Key and STAT!Ref 1 Ebrary and Access Emergency Medicine 1 Ebrary and Access Medicine 1
Ebrary, EBSCO, and JAMA 1
Ebrary and SpringerLink 1
EBSCO and Access Medicine 1 EBSCO and National Academies Press 2
Total 373
Appendix B: Average Views and DCT Score by Subject Specialty –
COUNTER Report 1 Titles
Subject Specialty Number
of Titles
DCT Score Total Views
Average Standard
Deviation
Average Standard
Deviation
Anatomy/Embryology 1 2.47 --- 3573.00 --- Gastroenterology 1 2.93 --- 2769.00 ---
Pharmacy 1 2.93 --- 2312.00 ---
Emergency Medicine 2 2.95 0.07 2047.00 940.45 Dermatology 1 2.40 --- 1710.00 --- Pathology 2 2.54 0.66 1602.50 897.32 Anesthesiology 1 2.67 --- 984.00 --- Ophthalmology 1 2.33 --- 933.00 --- Pediatric Surgery 1 2.47 --- 655.00 --- Pulmonology 1 2.93 --- 595.00 --- General Surgery 1 2.73 --- 457.00 --- Microbiology 1 2.27 --- 287.00 --- Critical Care 2 2.40 0.85 276.50 389.62 Obstetrics & Gynecology 2 2.83 0.14 196.00 239.00 Neurology 2 2.83 0.14 145.00 0.14 Dentistry 5 2.31 0.14 139.80 178.49
Psychiatry 1 2.60 --- 131.00 ---
Pediatrics 1 2.67 --- 100.00 ---
Pharmacology 1 2.80 --- 49.00 --- Laboratory Medicine 1 2.73 --- 37.00 --- Physical Medicine and
Rehabilitation 2 2.30 0.24 36.00 49.50 Cardiology 2 2.55 0.36 23.00 0.36 Medical Education & Informatics 2 2.70 0.04 5.50 2.12 Nursing Advanced Practice 3 2.91 0.16 3.33 2.52 Coronary Care 1 2.87 --- 3.00 --- Nursing Education 3 2.58 0.28 2.00 3.46 General Medicine 1 2.50 --- 2.00 ---
Research 1 2.20 --- 2.00 ---
Legal/Ethical 1 2.80 --- 1.00 --- Quality Improvement 1 2.60 --- 1.00 --- Clinical Genetics 1 2.27 --- 0.00 ---
Geriatrics 1 2.07 --- 0.00 ---
Immunology 1 1.60 --- 0.00 ---
Infectious Disease 1 2.27 --- 0.00 --- Long Term Care 1 2.80 --- 0.00 ---
Nephrology 1 2.79 --- 0.00 ---
Appendix C: Average Views and DCT Score by Subject Specialty –
COUNTER Report 2 Titles
Subject Specialty Number
of Titles
DCT Score Total Views
Average Standard
Deviation
Average Standard
Deviation
Surgical Pathology 1 2.40 --- 540.00 ---
Pediatrics 1 2.33 --- 190.00 ---
General Surgery 4 2.38 0.11 63.00 63.55 Plastic and Reconstructive Surgery 3 2.24 0.20 62.33 107.96 Psychiatry 2 2.20 0.00 59.50 7.78 Gastrointestinal Surgery 3 2.40 0.18 56.67 87.76
Physiology 1 2.20 --- 49.00 ---
Biostatistics 1 2.80 --- 45.00 --- Laboratory Medicine 2 2.87 0.09 43.00 60.81 Coronary Care 1 2.13 --- 33.00 --- Transplantation Surgery 3 2.73 0.07 31.00 41.22 Rheumatology 1 3.00 --- 30.00 --- Cardiac Surgery 1 2.40 --- 29.00 --- Endocrine Surgery 4 2.65 0.18 25.75 23.98 Endocrinology/Metabolic Disease 1 2.27 --- 25.00 --- Nephrology 3 2.78 0.30 22.00 21.00 Ophthalmology 3 2.02 0.24 22.00 34.70 Trauma Surgery 3 2.33 0.12 21.33 27.79 Pharmacology 1 2.60 --- 20.00 ---
Oncology 1 2.60 --- 18.00 ---
Pathology 1 2.00 --- 18.00 ---
General Medicine 5 2.31 0.28 14.00 22.86 Nursing - Informatics 6 2.62 0.31 13.83 13.96 Infectious Disease 2 2.47 0.09 13.00 14.14 Vascular Surgery 3 2.73 0.15 13.00 21.66 Thoracic Surgery 2 2.70 0.04 12.50 7.78 Nursing - Critical Care 1 1.87 --- 12.00 --- Respiratory Therapy 1 2.60 --- 12.00 ---
Nutrition 4 2.37 0.36 11.25 9.74
Oncologic Surgery 3 2.38 0.37 9.33 10.07
Microbiology 1 2.13 --- 9.00 ---
Nursing - Patient Education 1 2.60 --- 9.00 --- Nursing - Nutrition 3 2.09 0.16 8.33 5.13
Urology 1 2.30 --- 7.00 ---
Appendix C continued
Subject Specialty Number
of Titles
DCT Score Total Views
Average
Standard
Deviation Average
Standard Deviation Sports Medicine 2 1.45 0.07 2.50 2.12 Allergy/Clinical Immunology 1 2.67 --- 2.00 --- Medical Ethics 1 2.07 --- 2.00 ---
Neurosurgery 1 2.80 --- 2.00 ---
Nursing - Emergency Care 3 2.29 0.10 1.67 1.53 Health Care Administration 4 2.20 0.26 1.00 1.15 Library and Information Science 1 2.47 --- 1.00 --- Diagnostic Radiology 4 2.77 0.18 0.50 1.00 Emergency Medicine 1 2.80 --- 0.00 --- Health Policy 1 2.60 --- 0.00 ---
Immunology 1 1.79 --- 0.00 ---
Neurology 1 2.93 --- 0.00 ---
Obstetrics & Gynecology 1 2.40 --- 0.00 --- Pediatric Surgery 3 2.26 0.12 0.00 0.00