Table of Contents
ABSTRACT...I
1.0 Introduction...2
2.0 Background...4
30 Experimental Apparatus & Variables...11
I. Apparatus Design...11
II. Variables and Levels for Eiperiments...14
4.0 Results & Discussion...18
50 Conclusions...36
6.0 Recommendations & Limitations...36
7.0 Acknowledgements...38
8.0 References...39
APPENDIX A...42
APPENDIX B...51
APPENDIX C...64
APPENDIX D...71
APPENDIX E...74
ABSTRACT
It is is^ortant to understand factors that affect the generation
rate and size distribution of dust in an industrial setting.
Information about these factors is necessary: (1) to develop product
specifications for allowable dustiness of industrial materials, (2)
to assess the inherent dustiness of processes and materials, and (3)
to evaluate changes to materials or processes that can control dust
problems. Investigation of these factors may be aided by the
development of a general theoretical framework, and a way to measure
the generation rate and size distribution of dusts. To meet this
need a drop test has been developed, which employs a high volume
cascade io^pactor to size the dust. Experiments measured the
generation rate and size distribution of an aerosol generated by
dropping sand with varying drop heights, mass flow rates, moisture
'Dustiness' is defined in the literature as "the tendency of dry materials to liberate dust into the air when handled" (BOHS
1995) in material transfer and processing operations. The term
'dustiness' is generally confined to mean the total mass of dust
generated per unit of material dropped and does not classify the
dust by size distribution or generation rate. 'Dustiness' in this
paper will refer to both the total mass of dust generated per unit
of material dropped and the size distribution of the dust. Dustiness tests are laboratory procedures involving a means of generating dust coupled with a means of quantifying the amount of dust generated during the test. The test methods employed to generate dust encompass gravity, mechanical, and gas dispersion with some variation of gravity dispersion being the predominant method employed (BOHS 1985). The methods used to quantify the amount of dust generated range from the strictly qualitative, where the amount of dust generated is visually compared and ranked by the observer, to quantitative methods employing cascade in^ctors, light
obscuration, or measurements of mass of dust generated (BOHS 1985).
Exposure to dust has long been associated with pneumooonioses,
"the accumulation of dust in the lungs and the tissue reaction to
its presence" (ILO 1972). Pathological classifications of
In addition, toxic substances absorbed from particles in lungs
may act at other sites; for exao^le, lead and cadmium deposits in the lungs, are absorbed into the blood, and affect the kidney and nervous system. The deposition site of dust in the lungs depends on
particle size. Concern vith the relationship between particle size
and site of toxic action has led to discussion of size-selective
threshold limit values, TLV's (Lioy 1984).
Investigation of the factors that affect the dustiness of materials has the potential to help control dustiness through the alteration of materials or processes to reduce a material's tendency
to produce dust. The factors that affect material dustiness are
poorly understood because "in the pantheon of control measures vhich
may be applied to solid material handling operations, relatively
little attention has been given to altering the dustiness of materials" (Unknown 1988) as a control measure.
The ability to predict a material's dust generation rate and
size distribution should be useful to both industrial hygienist and materials manufacturers. An industrial hygienist vould be able to predict/estimate worker exposure from materials in use and determine what controls are necessary for worker protection. Materials
manufacturers would be able to alter products to reduce dust levels while still retaining necessary material handling qualities.
This study concentrates on developing a test to measure
dustiness and use of that test in a preliminary investigation of the
Although the first index for material dustiness (Index of
Dustiness for Coal and Coke) was adopted in 1939 (ASTM 1975) and an apparatus for determining dustiness was reported by Andreasen et al.
(1939), no comprehensive or fundamental investigation of the factors that affect dustiness has been reported. The British Occupational
Hygiene Society Technical Guide No. 4 (1985) contains a historical
background and review of 18 different dustiness estimation methods. The report also contains recoimnendations for future work that include an investigation of the effects of sample size, drop height, number of drops, and relative humidity on material dustiness and the
need for a standard material for calibration and reference of
different methods. The BOHS Technology Committee Working Party on Dustiness Estimation (1988) reported on the effects of sample mass and drop height on dustiness but not the effects of material size
distribution or moisture content, giving information on two of the
proposed four factors that affect dustiness.
Cowherd and co-workers (1989) have reported results of dustiness tests on 14 different materials and developed a four
parzuneter model for dustiness potential which accounted for 11% of the variation they observed in material dustiness tests. The model
correlates the fractional mass lost, L (mg of dust per kilogram of
material dropped), with
L = 16.6(M)-0-75(Sg)3-9(D)-l-2(Mg)-0-45 (1)
Here, M is the moisture content {%), Sg is the standard geometric
deviation of the particle size distribution, D is the bulk density
distribution. The apparatus used by Covherd et al., the Midwest
Research Institute (MRI) tester (Figure 1), is a drop test with fixed drop height (25 cm) and fixed material volume (0.27 L). Material dustiness is assessed by loading the material in a cup that is rotated and vibrated to release the material. The material falls
and strikes the floor of the chzunber, the dust released is drawn off
at a rate of 8.3 L/min and collected on a 47-mm glass fiber filter
mounted in the top of the apparatus. Air is drawn in through vents
in the side of the apparatus, 20 cm above the floor. Material dustiness is defined as the amount of dust on the filter divided by the total amount of material loaded in the cup. This method cannot investigate the effects of varying drop height, mass flow rates, or entrained air since these parameters are fixed.
Cowherd and co-workers (1989) have also reported the results
of a laboratory-scale worker-exposure study that found "material-specific suspended particulate emission factors vary approximately in direct proportion to the drop height", and that particle
concentrations increased with increasing solids transfer rate. This would indicate that the dustiness of a material increases with
increasing drop height and material transfer rate and that these
factors should be investigated further.
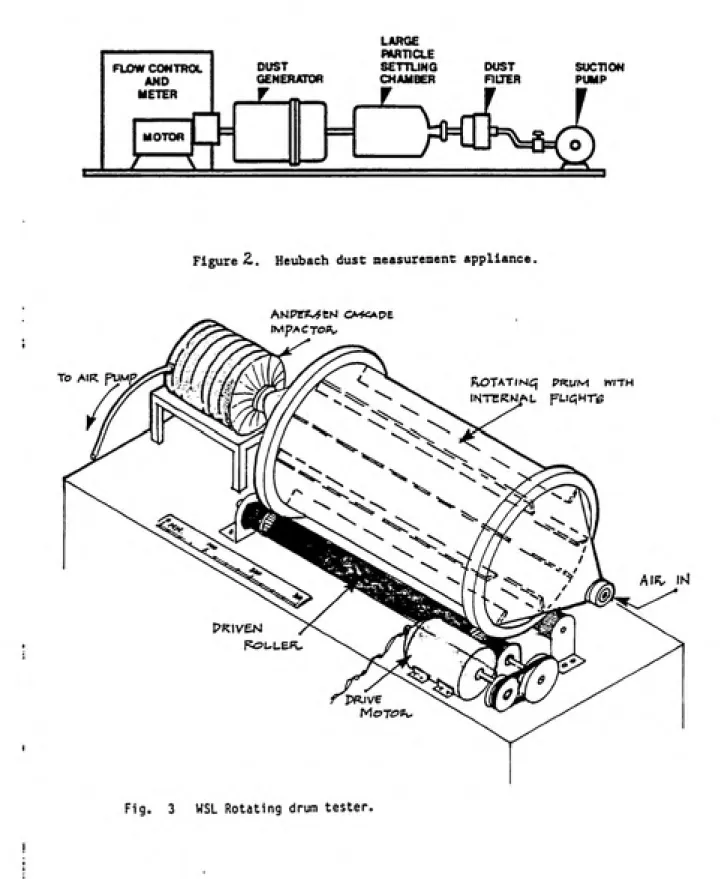
Other dustiness testing methods reported in the literature are mechanical dispersion devices such as the Warren Spring Laboratories
(Higman 1985) rotating drum tester and the Huebach Dust Measurement
Appliance (Heitbrink 1989). In these devices the material is loaded in a drum and then the dinim is rotated, vhich simulates repeated
CUP
VIBRATOR
47 mm FILTER
HOLDER 20 cm
LID SEAL
CUP ROTATION MECHANISM
INLET
30 cm
50 cm
ALUMINUM FOIL
FOAM PAD
dravn off and collected on a filter for subsequent weighing. The
weight of dust on the filter divided by the weight of material loaded into the drum defines the material's dustiness. These
devices can handle wet or bulky materials easily but cannot investigate the effects of varying drop height, mass flow rate, or entrained air. These devices are shown in Figures 2 & 3.
Other methods of assessing dustiness do not adequately address the interdependence of dust concentration and size distribution. Hill and Robinson (1969) and Hammond (1980) describe test methods in
which granular material is dropped and the optical density of the
resultant dust cloud is measured. Because the optical density of a dust cloud depends on the interaction of concentration and size distribution (Reist 1984), this technique cannot assess mass generation rate and size distribution independently.
Studies that evaluate dust problems in industry have generally been undertaken with a specific goal in mind, and so have considered
the problems of only one material or situation. Sutter and co-workers (1982,1983,1984) investigated the mass of dust generated by
an accident at a "nuclear fuel cycle facility". They dropped measured quantities of Ti02 and "depleted uranium powders" in a
closed chamber, then sampled the air in the chamber until virtually
all suspended particles were collected. This technique gave values
for suspended dust mass that are to low, and values for size
CHAMBER FILTER PUMP
^>Klkft<j)
To AIR F^Mg
Figure 2,. Heubach dust measurement appliance.
^OTATINCf PKUM WITH
INTEKUAL fUqHT^
Alf^ INl
particles to a filter. Sutter et al. (1982) found the mass of dust generated fay free fall is roughly proportional to the square of fall height and strongly dependent on material type. They fitted their
data to log-normal distributions, then reported geometric standard
deviations of 1.9 to 8 for the dust suspended; hovever, the upper
values here seem too high to be correct.
Outdoor studies of air pollution in vhich processed steel slag
and crushed limestone irere dropped from the bucket of a front-end
loader provide another model for predicting dustiness. These
studies correlated generation rate for particles of size i, G±, with Gi = ki (S V H M2/3)/(w2). (2)
Here, S is the "silt content" (%) of the dropped material, V is the
crossvind velocity (km/hr), H is the drop height (m), M is the mass
of the material dropped (kg), W is the vater content (%), and k^ is
an empirical parameter that depends on particle size (Bohn 1978, US
EPA 1983). These tests vere conducted over a limited range of
experimental conditions. Field studies vith prilled sulphur
(Muleski 1985) found that dust generation rates vere similar to, but higher than, predictions from Eq. (2). Additional laboratory studies vith prilled sulphur (Yocom 1985) in a vind tunnel found
that the same independent variables as Eq. (2) could describe dust
generation rate, (Yocom 1984) but that the mathematical dependence of generation rate on these variables was sufficiently different to cause predicted generation rates to differ by orders of magnitude
from that of Eq. (2) under some conditions. Other lab studies with
sulphur confirm the strong dependence of generation rate on moisture
The studies mentioned above are valuable because they identify the important variables that affect dust generation rate and size
distribution. However, no single study incorporates all the
variables into a study design that covers a broad range of conditions. Based upon these studies a preliminary theory for factors that affect dustiness can be expressed as,
Gi = f{M, H, Si, Q, particle aerodynamic diameter,
material properties). (3) Here, Gi is the generation rate of particles of size i, M is the
moisture content of the material, H is the drop height. Si is the
size distribution of the parent material, and 0 is the mass flov
rate of the material. Eq. (3) suggests that the generation rate for
particles of size i depends on total mass flov of all material, the size distribution of the material, the height from which the material drops, particle size, and material properties that affect interparticle adhesion forces such as moisture content, material
stickiness, or electrostatic properties. Several of these factors,
such as M, H, 0, and to some extent Si, can be controlled and are
11
3.0 Expariaental Apparatus & Variables
I. Apparatus Design
The apparatus for dustiness assessnmnt employs a drop test (Fig. 4). A known zunount of material is dropped and the resultant dust collected and analyzed. This method was chosen because it represents the most common operation for material transfer used in industry.
One side of the apparatus is wire-reinforced glass with the reinforcing wire grounded to the frzune surrounding the glass. The freune is a steel channel sealed to the glass with silicone sealant. This window is used to exzonine what happens inside the apparatus.
Material with measured size distribution and moisture content flows
out of a hopper from a known height at a measured mass flow rate through a hole that forms the lid of a hopper. Hole diameter is adjusted to be slightly larger than the diameter of the falling column so that air entrained with the column enters the hopper. Air is drawn from the hopper by Fans "A" & "B" at a rate just sufficient to prevent dust from puffing out the hopper vent. Fan "A" circulates air through an elutriation column that has a high volume cascade impaotor at its top. Fan "B" is controlled to remove air from the exhaust stream of Fan "A". The volume of air removed by
Ixiterchangoab Diameter Tubes
1
Material
Hopper
Cutoii Valve
Elutriation
Column
Drop Height Hole of
Adjustable Diameter
Vent
Large
Slot
With
Telltale
Rece jvmg Hopper
Baiiles Distribute
Air Evenly
Uniform
Aar Velocity
Air Boturn
Large Particl
Settle Out
UNC DUSTINESS TESTING APPARATUS
13
in the falling column of material so that 34 m^/hr of air is
circulated through the elutriation column at all times.
The elutriation column is 70 cm on a side, which for an air
flov of 34 m^/hr is sufficient to prevent particles larger than 25
\Lsa in aerodyneimic dizuneter from reaching the column top. It is 175 cm from the oolumn floor baffles to the column top with the cascade impactor hanging down into the column 25 cm making the distance from
floor baffles to cascade impactor 150 cm. The cascade impactor
separates particles down to 1.1 (un in aerodynamic diameter into four size fractions. Particles that pass through the impactor collect on
a filter. The impactor is an Andersen High Volume Cascade Impactor
Model 65-000 utilizing aluminum foil substrates coated with silicone
grease (Vanderpool 1987) applied as an aerosol. The impactor was calibrated for 34 m^/hr by Andersen Samplers Inc., the calibration
point for 34 m^/hr is 1.47 KPa pressure drop across the impactor
head at 758.2 mm Hg and 25°C. Equation 4 is used to correct
pressure drop to field conditions.
APf = 1.47KPa*(25<'C/T£)*(P£/758.2 mm %) (4)
The material drop height is held constant by keeping the size
of the pile of dropped material in the hopper at a constant height.
This is done by employing a pyramid of styrofoeim discs that are cut
so that they have decreasing dizuneters going from bottom to top
which are at the angle of repose for the material in use. The angle
measuring the height of the pile at vhiah any further material added
slides off the pile. The material slides off the pile into a
collection chamber beneath the styrofoam discs by means of a slit cut around the outside of the disos. By knoving the diameter of the discs and the height of the pile the angle of repose can be determined.
Entrained air is measured by a thermal anemometer inserted in
the pipe downstream of the cutoff valve leading to Fan "B". The thermal anemometer vas calibrated in the pipe using a 120 liter spirometer. The flov through fan "B" is controlled by a variable
voltage controller.
The hopper hole dizuneter utilizes interchangeable tops with
holes of different sizes to match hole size to the size of the
falling column for varying mass flow rates and drop heights.
Details regarding equipment set-up, preparation, analysis, and
running the experiment are contained in Appendix A.
II. Variables and Lavels for ExperisMnts
The experiments measured the effects on dustiness for
variations in material flow, Q, drop height, H, moisture oontent, K, and size distribution, S^. The size distribution was altered by
sieving parent material through a 38 (un sieve, then adding or
deleting this fine material to the material tested. Table 1 is a
15
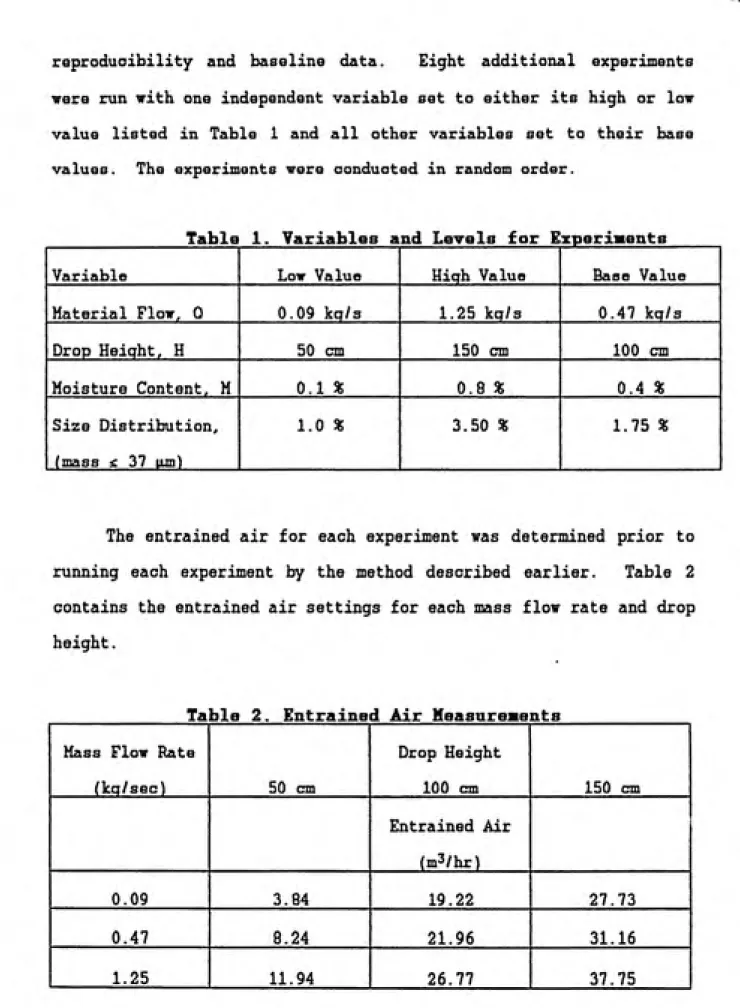
reproducibility and baseline data. Eight additional experiments
ͫ
ere run with one independent variable set to either its high or low
value listed in Table 1 and all other variables set to their base
values. The experiments were conducted in random order.
Table 1. ?ariabla8 and Lawals for ExpariBants
Variable Low Value Hiqh Value Base Value
Material Flow, 0 0.09 kq/s 1.25 kq/s 0.47 kq/s
Drop Height, H 50 cm 150 cm 100 cm
Moisture Content. M 0.1 % 0.8 * 0.4 *
Size Distribution,
(mass £ 37 tun)
1.0 « 3.50 % 1.75 %
The entrained air for each experiment was determined prior to running each experiment by the method described earlier. Table 2 contains the entrained air settings for each mass flow rate and drop height.
Table 2. Entrained Air MeasureHents
Mass Flow Rate
(kq/sec) 50 cm
Drop Height
100 cm 150 cm
Entrained Air
{m3/hr)
0.09 3.84 19.22 27.73
0.47 8.24 21.96 31.16
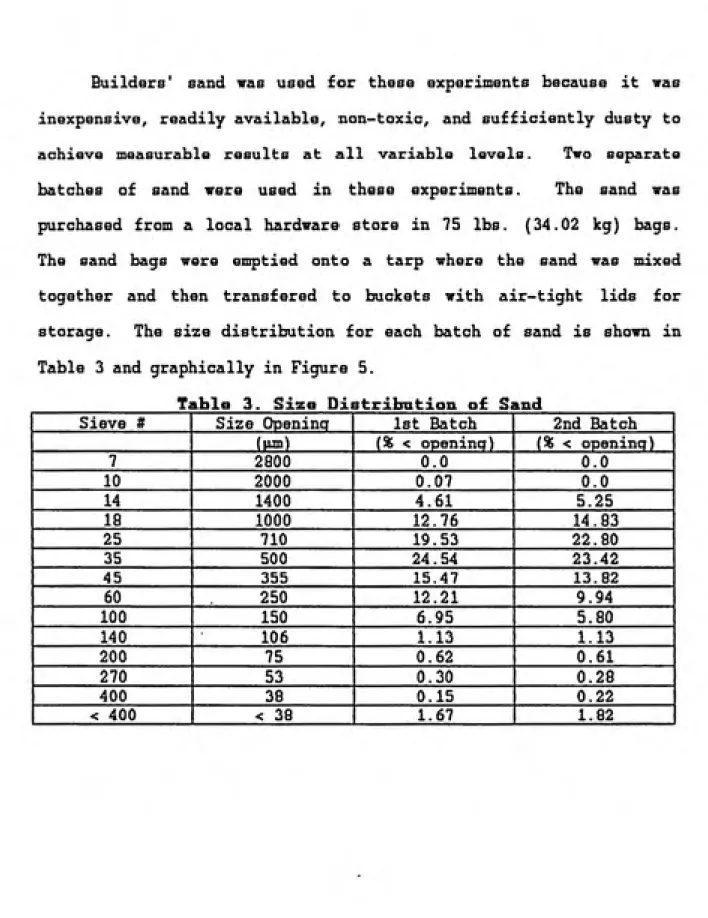
Builders' sand vas used for these experiments because it vas inexpensive, readily available, non-toxic, and sufficiently dusty to achieve measurable results at all variable levels. Two separate batches of sand vere used in these experiments. The sand was purchased from a local hardware store in 75 lbs. (34.02 kg) bags. The sand bags were emptied onto a tarp where the sand vas mixed together and then transfered to buckets vith air-tight lids for storage. The size distribution for each batch of sand is shovn in Table 3 and graphically in Figure 5.
Table 3. Size Distrifaation of Sand
Sieve # Size Openlna 1st Batch 2nd Batch
(mjd) {% < opening) {% < opening)
7 2800 0.0 0.0
10 2000 0.07 0.0
14 1400 4.61 5.25
18 1000 12.76 14.83
25 710 19.53 22.80
35 500 24.54 23.42
45 355 15.47 13.82
60 250 12.21 9.94
100 150 6.95 5.80
140 106 1.13 1.13
200 75 0.62 0.61
270 53 0.30 0.28
400 38 0.15 0.22
25.00!! T
O.OOX
17
1st Sand ^ 2nd Sand
20.00X
I5.00X
lO.OOX ͣ
5.00X ͣ
^.^
2.8 2.0 1.4 1.0 710 500 355 250 150 106 75 urn 53 urn 38 urn i 38
mm mm mm mm urn um um um um um urn
Figure 5. Size Distributions of Sand
The two distributions were conqared using a paired t-test
(Systat Version 4.0). The paired t-test gave the following
statistics;
mean difference = -0.002 SD difference = 1.411 T = -0.006
degrees of freedom = 13
Prob = 0.996
These statistics combined with Figure 5 indicate that there is no significant difference between the two batches of sand used for
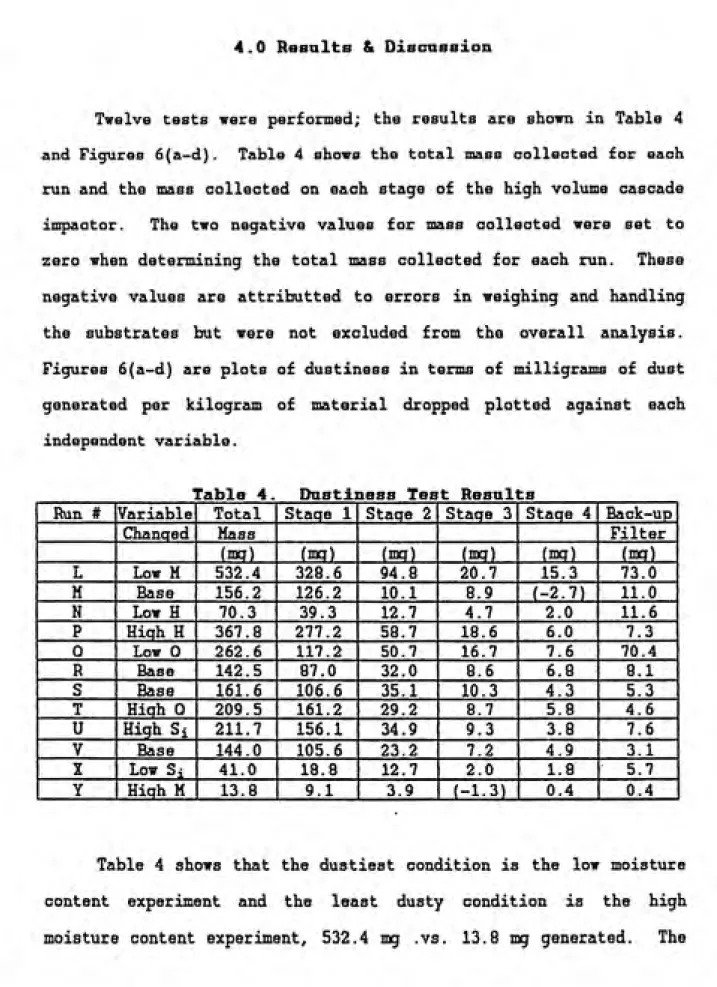
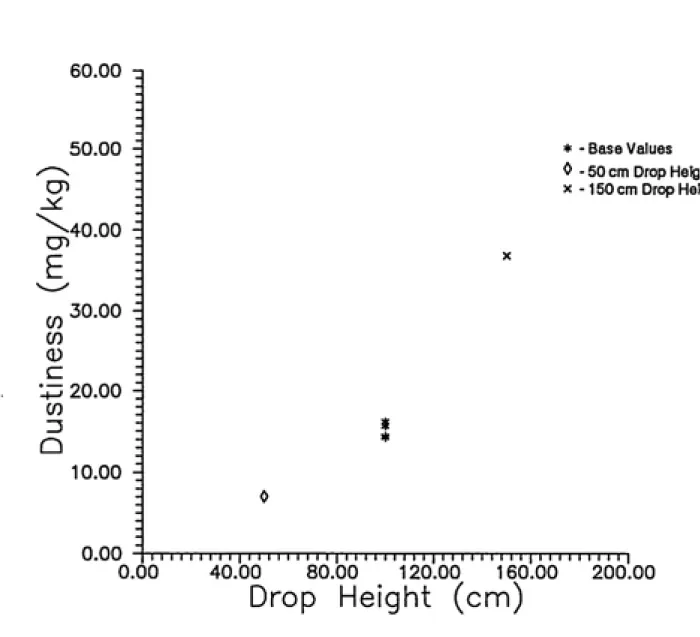
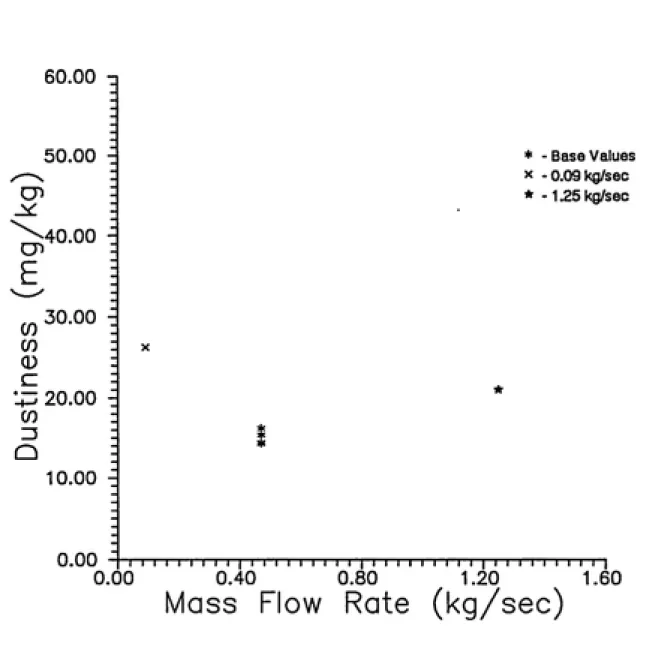
4.0 Results & Discussion
Tvelve tests vere performed; the results are shown in Table 4 and Figures 6(a-d). Table 4 shows the total mass collected for each run and the mass collected on each stage of the high volume cascade impactor. The tvo negative values for mass collected were set to zero when determining the total mass collected for each run. These negative values are attributted to errors in weighing and handling the substrates but were not excluded from the overall analysis. Figures 6(a-d) are plots of dustiness in terms of milligrams of dust generated per kilogram of material dropped plotted against each
independent variable.
f
rable 4. Dustiness Test Results
Run # Variable Total Staqe 1 Staqe 2 Staqe 3 Staqe 4 Back-up
Changed Mass Filter
iwQ) im) (mcr) (HKJ) imj) (njq)
L Low M 532.4 328.6 94.8 20.7 15.3 73.0
M Base 156.2 126.2 10.1 8.9 (-2.7) 11.0
N Low H 70.3 39.3 12.7 4.7 2.0 11.6
P Hiqh H 367.8 277.2 58.7 18.6 6.0 7.3
0 Low 0 262.6 117.2 50.7 16.7 7.6 70.4
R Base 142.5 87.0 32.0 8.6 6.8 8.1
S Base 161.6 106.6 35.1 10.3 4.3 5.3
T Hiqh 0 209.5 161.2 29.2 8.7 5.8 4.6
U High Si 211.7 156.1 34.9 9.3 3.8 7.6
V Base 144.0 105.6 23.2 7.2 4.9 3.1
X Low Si 41.0 18.8 12.7 2.0 1.8 5.7
Y Hiqh M 13.8 9.1 3.9 (-1.3) 0.4 0.4
Table 4 shows that the dustiest condition is the low moisture
content experiment and the least dusty condition is the high
60.00
50.00
-cr>
^40.00
CO
(f) CD c
30.00
20.00
-CO
13
10.00
-* - Base Values
0 - 50 cm Drop Height
X -150 cm Drop Height
0.00 I I I M M I I I I M I I I I I I I I I I I I I M M I I I I I I M I I I I I I I M I I I I
0.00 40.00 80.00 120.00 160.00 200.00
Drop Height (cm)
50.00
^40.00 -cn
CO
CD
c
•h3 20.00 ^
C/)
13
Q
10.00 ^
0.00
* - Base Values
•fr - 0.1 % Moisture
A - 0.8% Moisture
I I I I I I I I I I I I I I I I I I I I I I I I I I I I I I I I I I I I I I I I 0.00 0.40 0.80 1.20 1.60
Moisture Content (%)
60.00 -1
50.00
-CD
J^40.00 d
CD
CO 30.00 ^
CO
•-i3 20.00 ^
CO 13
Q
10.00
*
* - Base Values
A - 3.5% Fines
ͤ
-1.0% Fines
0.00 I I II II II II I I II II II II I M I II I I M I II I I II I I I I I I M II II I I
0.00 1.00 2.00 3.00 4.00 5.00aterial less than 38 um (%)
50.00
-CD
cn
^40.00
-CO
CD
c
30.00
-20.00 ^
CO
10.00
-0.00
* - Base Values
X -0.09 kg/sec * - 1.25 kg/sec
I I I I I I I I I I I I I I I I I I I I I I I I I I I I I I I I I I I I I I I I
0.00 0.40 0.80 1.20 1.60
Mass Flow Rate (kg/sec)
23
second greatest variation in dust generated is between the high and
low drop heights, 367.8 mg .vs. 70.3 mg. Increasing or decreasing
the < 38 (un size fraction produces the third largest variation in dustiness with values ranging from 211.7 mg to 41.0 mg for the high and low < 38 ^jh content runs. Varying the mass flow rate changes the amount of dust generated but not to the extent that variations in drop height, moisture content, or size distribution affect dustiness, with values 262.6, 150.4, and 209.5 mg for the low, base, and high mass flow rates. This trend is inconsistent with other work (BOHS 1985) and will be discussed later.
Four experiments were run with variables set to their base values. These runs were conducted to establish baseline data and
experiment reproducibility. The total mass of dust generated in each experiment shows reasonable agreement with variations of less than 10% at the high and low ends from the average. The values for mass collected on each stage show a much greater spread with
variations as high as :t50%. Work in progress suggests that some of
this variation may be caused by the styrofozun discs used for the constant height pile, which can be exposed and therefore provide a hard surface for the material to bounce off, liberating more dust than when the material impacts upon itself. The average, high, and low values for each impactor stage and total mass for the base experiments are shown in Table 5. The high and low values are the highest and lowest values obtained overall and do not represent a
single experiment but are drawn from the four experiments that were
Table 5. Averaae. Low. and Hiqh Values for Baseline Experiments
AvQraqe Low
Hiqh 1
Total Mass 151.08 142.5 161.6
1st Stage 106.3 87.0 126.2
2nd Staqe 25.1 10.1 35.1
3rd Staae 8.75 7.2 10.3
4th Staqe 5.33 4.3 6.8
! Backup Filter 6.88 ͣ 11.0
3.1 1
The size distribution of the dust generated for each run is
shown in Figure 7. In general, finer dusts were generated for the
following conditions; 1) low mass flow rate, 2)low drop height, 3)
low moisture content, and 4) low £ 38 |un content and coarser dusts
were generated for 1) high mass flow rate, 2) high drop height, 3)
high moisture content, and 4) high £ 38 (un content. These size
distributions coupled with the total mass numbers indicate that the
dustiest conditions also had the finest size distributions. The
fact that the high < 38 |un content run had a coarser distribution
than the low £ 38 |un content run is consistent, even if counter
intuitive, since there are more small particles in this run and the
apparatus was sized so that only particles 25 (un and below would
reach the impactor. Variations in the size distribution of dust
generated are expected since the material properties, physical
characteristics, and the energy imparted to the system are changed
with variations in moisture content, particle size distribution, and
drop height. Heitbrink (1989) has reported variations in the size
distributions of dust generated with the MRI and Huebach dustiness
tester for similar variations in experimental parzuneters.
The increase in dustiness with increasing fines (< 38 ^un)
K-."C PROBABILITY 4€
£: X 2 LOG CYCLES »;ͣ
KEUFFflL a tsSEn CO
i. « N -H a r-H u -H M <2
0 99 99 99.9 99.8 99 98 95 90 80 70 60 50 40 30 20 10 ; 2 0.5 0.2 0.1 .05 0.01
!l J
Hill ii'llPTT mlMlnFP
1 1 i; 1 i i r 1 1 i 1 i I 1 i -in I; i i i ͣ
e Percent Less Than Size
1 1 -! -[ 11 lilt 1 '
ijli 1. \ 1!! IL 1!
1 ili' 11 Cumulativ
-111" 1 1 i-i 11 li 1 ' 11 1 III
Tm 1'''"™it1. t^
t i; ; ; 7^
"--
Z---^--dHfhT't^'-'TfflT^
-r— j I'j-i--.
—
-7
6 _._ i\\\
1 H - W.^^-ri vf m Lr W -^H-h-^-^-^.| 1 j L 1 -H-H-j-H-^ -1 ͣͣͣMl f 1 1-1 1 ' "ͣ ͣͣ! ͣ
— —
—- 1 - 6
.- - i/tfi
i-.~
--WOT" ' tninffl '^
j S"IT
4„ 1
Tn^T "
"1 ͣͣ -J J 1 ji
'' ' t'1 It' "I 1
^—
..-:.- 'ItM
^
IT.—-ͣ l-U
i"-
:--4
3.*
t l'i--|^=
1
EW\-\-\\\/ /W\W\]\j\
mmmmt
Wj'-- Ml "
4
2*
E'.-4h:
|5f
:|r~jlj.| :.
11" IeeE
^
--^--ͣJ--- ::i-H-H---':--: it L
-...
szr -: 1 jl
- - -M
E
:::
--^
::.
y* / -1 1 - 1 J
—__
/ /
MM M i
-t'R* Uy<|!/((
kti*' t/
:3111
/^Tffl i! y H W-i4'tI ͣU'-'^ >i }M\t\ii'\l\ 1 1J JxJjjJ,l 'Llll 1 i : 1 f 1 Iv / L\ \f\\\\\ 'Tinn T
—
1 1 / / I ͣ I 11 1 11 l~l 11 1 1
/ /
i
/
1 ' 1' T
r--9 ~j II
il
— CX)ARS
ifli w-§; :h;
4i4ii^--;^ rifi]i«H| 1
: - . |: i:; il-: 1 98.-7—
:._7:
1 If
ER i^—
=
E
---^ FIHER ---^ -j ͣ
ͣ
' j^' -|h-ji liiiFrrn
Err:r1 1 Standard Deviation
-^j|i£ffim-prFiff!fiii-8 7 6.. ͣ
"'"
-1 IJI ='
g^E
Ji]y|:...[M
ill- ilililri ill 1 - III 1 r-FP::::.™--:
6 5
-11 M 1 ^^ͣ ;=-Z
|- ' 1 W- --- [--till I fF
'rl ͣ -llll ." -.^-.i- \f\=\
-1 ii -1
-t~'\'f ^.
-^-:. i 1 =E 1 I-I 11 I-I' I-I l-l-lf-limI 1 11
ͣ
1 '\\\\ Mi
ͣ
^"
ͣ
1
-:
4- --.
1 Ml 11' |-^-^
"[J 1' . M Itp 1
-~"ͣ- Mii. —
-^
4
3.
1 -A 1 I 1 1 111 1—::^
—
11 ll-llii III 1 llirnltilt 11 : 1 11 j 111 I -
~-rr:-. 111-1- -l-U-L::^
—
-1 1
Figure 7a. Size Distributions for dust generated at high (l.Sm) and lov rO.Sm) DroD Heiahts olotted with the Base Values Averaae
2
Distribution ± 1 Standard Deviation.
-I"l l"J-l III i ! i 1 1 1 1 I ] 1 1 ! 1 ] 1 ' I 11 1 1 1 1 i 1 11 1 1 1 1 1 i 1 1 1 i I ::
z\
1 i...^
-'HI I fr
-H -H
{1 1
'ill " 1 '
-\\\
1 11 M ͣ 1 'III ' M 1 1llll 1 1 I 1 M
1 N 1 N 1 1
1 lliilllllr iMliil
i
-ͣ
--,_.
1 Mil '1 1 1 1 1 1
1 1 III
T
--i Ml III
ͣ Ml:,! ,,.,11 1.11,,,111 lllH 1
I gg ͣ H VI o -H l-l M
0 M"' 99,9 99.8 99 98 95 90 80 70 60 50 40 30 20 10
2 9
Cumulative Percent Less T
i ipllrli 1 mW :-t^NNIil|||1tl[.. |:|
II ini ill ..|l ͣIII l! 1 q
8 lan Size ] r \
hi' 1 ! ͣ lil! jM t j ; 1
7A
r- -|-[-T-rjTT[-ͣ 1 ||i .: n-n
^vmmMm
rill i' '' i'' 1 —1 V I
1 1
-1 - II :
hi 1 i
1 j- - • j
~
^T
If-U 7 6____
:4
v\ kir 1
\
—
##iiy
€
r|l
- -- 1^6
5
t 1 ͣ '
T^--m\\P%Wmm
ͣ 1 54____
±l\
-T' 4 p:~ir-h' 1 :-l-tK=
=f
: [ : j j j-.:. ..: \- j 11
-—
--1 ! . It.
'% 1
.- 1
ͣ
1 4-4
1
V---_—_
4
3___
4
--1 11-F
=
ͣ
----]
1 In'E'
Iff i-f ill
1 -ͣ \'\~
^ ^4 -1 "-"
iji; iP
i
~
- \
—i f
3
T- j: - \ ||--[
^ -iffl- -ͣ
-^j||—-~
r
4^^::4l-
ͣ
::-T4,M
TIT ' '^ ' ' \ ^— 1 -. . \\ \ - .".:''/ .^ - - -U 1 u
1 ]ͣ
---/ ͣ /--- 1 ͣͣ ----.-rl-.- I ͣ
"
-/
l f ; ___ -4f- 1
i/ _..
-
--\ 1 /lill lilMil 1
iM-.'. t 1 r4.0.;'Kfflf*.4ri<W*«ll.l--UJ-Ulllllllll.ll.l-LL
-- --
-'fl -^
..._.'...JJ w L_ i.r1ii[n.i
rW
/I'of"»>4l« • iiJ.Jlil.llimLlll.l.llllLLl.JJIIIIJ.Lm U2
fJJ.. ,-:.--- ...1- L iml.»- J
.
-:£-'-- ͣ [ £= ^i-":-_-::i"nlj-li j-r-r"--:. i..[i':- fi. .-i|fj-|r[f : - II-; -.: ͣi^jljl.i; g 1 i| j:4^— -^ ;::. hf]
()
il"*"
-i il ͣ- ..T.,r.T, ^ 'HIHL nil 'lilt8__-7._.
-:.
'R ^
nr1=
til - - fltt TI'-FI
_:zz:
* 1 standard
—[HtHli.t±[-H
Deviation 8 7 6-^ ͣ "- --ͣ.; ft -i F"
-
-
ͣͣ
"
ͣ
m|- - ' [[--[ 11 [
^-i-i--44T-|J||[l|+--7-:]-|-
ZEh . 1If
+
-'' f' 6
-ͣ
] -: l;| ik "
ͣ
-if -tl If I h :: \-u- 1
ͣ
''• fjJjl...:. i
ͣ
:" ' 1 ͣ =
4--vrJ
1 ͣͣ n^r -1 [11 -— =^^3
^
ͣ
^
ͣ
^"T TTnri''~'"^[|fri]TirlTT TM n^""'"^^"''"''11111'" ^''""-T
—_li:.._ ^
r - 1 -"
^ q .-j:=p
1
4 3llll-l
rJ — -— 1 u
'-o-i___rtj.*..ii__«. J £- J..
j It ... 1 rir 4
/A A<W
z^
-- ll
ͣ
1
...
and low (0.1%) Moisture Contents plotted irith the Base Values
1 1 1 1 1 M 1
Average uistriciutlon 1 1 btandard Uevaation.
1111 1 1 1 1 1 1 1 1 1 1 M 1 1 1 III 1 1 1 1 1 1 1 1 1 1 1 1 1 1 1 1 1 1 1 1 M 1 1 1 1 1 1 1 1...1 1 1 1 1 1 1 1 1 1 1 1 1 1 1 1
"T:
:f-:„
—
' j ...-- 1 i r;
-r 1 1 —
-1 i -1 '
I'll 1 '' '
i i il '' i i
li 1 1'"" i
1 j
.J -. L -..._ 1— 1
PROBABILHY 4e X 2 LOG CYCLES •^^v KEUFFEL ft ESSfcR CO.
I
a N ͣ H 9 i-H u M Id 04n )9.99 99.9 99.8
99 98 95 90 80 70 60 50 40 30 20 10 2 0.5 0. 0.1 0.05 0.01 9 ! ͣ_. 1 -1 j 1 i 1
1 :M ;. p 1 ! - M
ͣI'Mive Percent Less Than Size
q 8 h-l- 11
1 I-
; M k. 1:1 |l 1 " +. 1 : "L:|
ͣͣ hi- - - CumulatFt 7.D__ 1 >
j-l 1
. 1 llF-__1_ ! ' - ͣ ͣ T1 [! 11 1- - - ' 'i "ͣ[ -1
/ 6___
—
'---f+-^
ffl_____:._„L|i'Jvij:il
E'4i4#p|t::#
—
1 [:-J""n-
#:-. 6 5- - 1
1-m-\ \'\m
ͣ
'^-- 'A
- - ͣ - ' 11 r 1 1 : 1! , .,,4^,^
!J 1 .1ͣ
s
:=--: t - l-"-l ͣ t
FiW4-4 1-4.^-41
; -r 1 h- jl 1 1 ͣ-ͣ -^ 1 - L 1l'4 :-;M; 1 - : Hpi
W\] - !> Ifl/ -f --^-A'\
ͣ'ii i p i--1' ' "-- nil 111!'"' --ji-T 1 ' i
3
,11^.-_i -iTIM
T 1 r it
111liJll^L^:;.. --1 |jJi[.L M^
Z-I=nf _:
=f4—4 [rz~: ^
__
T l-
TIFF'4^---
-.fc
ͣ
-HJf--'' Hi fl__._--F:::;FJ
- \... — -...-i+i-~
"I
i,;:
,,_ J-L-"f1 't ^-t~
~
__
2.0_. " T IT1—\\' "\ 1---- j ;-' ͣ :"- — ""1 ..." "n~F —IF-... ͣ;ͣ- -|-p
-+- —
^ r
-2
j 1 1 ͣ 1 " LI y ilT 1 :'l - I- -'aa\
-__
ͣ
fyf'-'"1 \i\____________
ͣ
" it"
j1 1 /\ \i\ 1 J •
1
1 r?:ri
[J,^Ul -.1.1 7 .-_. ..___ul'
ͣ
[---WiM...tF
-~
1 Eii:b...::iliJllll:::.l:L:[l-t
l>b
n ni"
Average oi Bass ValuesI 9_
= -\
1 it ""-' i^-l '\ 1 . .ͣ-:. l-r^ : .: . ji . 1-:. ::: _ ." : _ : j f| j jj j f [ ...ͣ
-1 -1
n -4--- CX)ARS ...-- - injiijr[
8.-7-_
1.11 ^
. - r ...1 l-ii . [[ . . -' -j j'
„.!.--11 standard Dsviat
-~ 1 - ' j
ion 8 7 6.-
-\' I
" 'n TTTf.^:. -T "-.; ,:'.|rLJ_ ""."."":.::;:":;.i-F-l---;::.|]|t:.S
3^ 1.
i j--
__^+ ~ fp-4^
£_." 6 5 ivr^""_.-: ͣͣ_= i j i -ll 1": :": "r_ .: rlrJ""- t ͣ I ! 1 ͣ" ' "' 1111 iTfi"--"-" - -\ \
I.: +. ;^ \- t\
"-- 1 ͣ " "-1 H ' "" ""ͣ "l"-r""i""i T z:=t-t I
"1--[- i
ͣ
:...ii[h.r;--. ""::: ;i
i - - ͣ-"- ͣ-f !i - - y\ 1 . - - j .i -_^^^4" I "\l.-ͣ
-1 1- ". _.L .... . i " _ _____. 1
1 1 r "1
h ͣ — 1 -.
3__
II 1 Ml---^----1—-1-4 M 1 1 1 1 IIIIH-II 1 1 H 1 1 1 1 1+4+l-l4W-4l[llil n'rlllltll444-t4-ri ] 1 ^h—4-h+h44tri Ii
1-::-.. 1
and low (1.0*) Fines Content plotted with the Base Values Average
2
Distribution l 1 Standard Deviation.
9
1 - [-]-[ i\ 111 1 ͣ 111 ! Ill II 1 11111 1 11
-
ͣ
-- [""...
- -- - ͣ -- -'- ͣ "~
- :
_l
-
\'\\
-—M- - - ...- 1 - - 1
111 1111111 11r
M Im
"T ^ M ""ͣ r1 '
11:1.1 . .:: \m\.'.
1 hi 1 ͣ 111 ii
1 1
\
1
ll
]\
1
1
i N -H O -H M Id
10 59 99 99.9 99.8 99 98 95 90 80 70 60 50 40 30 20 10 2 0.5 0. 0.1 0.05 0.01
||1|||
tni-iiiiin iiiiini III!III H.||,}{[[lj_| Cumulatj
ͣ t 1 ifi Lve Percent Less Than Size1 -
'1
—
ilTm'i'"""""'™!^^
"
7-6.-
--l-Hg^HJi .1 -+:---j!l| lii...
—T— "TT ;
6____ -—
-1 ] I
LIJ].jL^
|'tffllip^---fltm+
-ͣ
- - ' ' 1 ] F^-_
6 -:^-'
H lin/Rt Ppi
^|4|-:|||jr|H]||: - 1 |-
MM 77 S- i l]l
t " " / J M^" T rrt r 1 /1 4 mi iilf^y-ill
11 1 :^
4 [ͣ-j III! i i| : |-- =
:1:
d jl-my / Wfflit w
'iJJ Hif 1 fil K
;|
^-r 43____
;;=:
- 1
- ]-+
- -h: 1 r|44--pE
~
.-4 l-A -\'\ / /( - 4 - - 4
1 II - i-'-[|-
-
==-££- h -7 r
F- ͣ 14-"-E
3
2.0l
^
1
FT
fin
- ͣ i^^^
-. - ... .1. 1 M.Ll . .|.|. .^_L ^ir
-f
iJ
zzVF -'
:i.:
7
A J M ___ . JJ
-aWm- i ffl 1-
1 1 1 1—I J 1 J 1 1 1 1 i 1 1 1 1 1 1 1 1 1 1 i 1 1
\n 1 1 iTHIt
a^TmllntTt ^" t itn i lllllJ 55 '11TT 11
...
Imil
hml-^
T[I 1jP 11 1L J11-JJ 1
j-J 1j-J 1111 111 Ij-J111 l11!
UO- Avaraaa oi Base Valuas 1
9.
.i_-r
Jiiiilit
\--\-\ - \:^_=-iFrffl-l-i:' - - ^ -i f l-H^il: ii : "\ 14-R ntl 14 P444'i~ ' y\- 9
8-::^ =
1 ^— COAHSEH
•«#-=
---ͨ FIMEB ---^ i:
- Ill f|nii| If
""
~
±1 standard Deviation
H||[|rinTr:Ln!r]i[i-H 11
8 7 6- ="-:rf-j i-~ i \'-\-11 Fi—1 1 " 1 11111111 i 11 r
|[|]|[||l||l]||-j|||||^
s^ -Hi r tft 1
ͣ
-6 5
.:;f£: i ͣ^H=-14 i 11 il}--''--1-ii II1 (14 J1 li- ll 1111 Ii 1 i 1111 li - il+i+rfi^^
~:_=;irVh4-l-i
Til 14- J [-:£- . ;
-^-_
:::H. 11- \f\-k- --- It'f mirn rf
—
---^T" TTF4-jr|44--
if F
4 14 ' 41 1 " HflPT" =:
4._=
-[=|i|- III K>:.^
--H4 1 : . Ill
il H |ll-l-t-tl 111 Jitl-ili-^^ Er -\
-.--1
3—E"
11 r-|-
ͣI - 'i--i-H 11ttji "F"--^1^-1-1^1-41 t-ittwitti-11 -i;|-1 m-m-\-
lIllJ lllil-llll 1 - - lllH-l-t- "4=t-:4l114- -Hj-R t-1-4- ll- t:::; - Figure 7d. Size Distribution for dust generated irith high (1.25kg/s)
and lov 10.09 ka/a^ Mass Flow Rates ninffart wifh t^ha Rxoa Vitlimo
2._
Average Distribution i: 1 Standard Deviation.
11111111111111 1 1 111111111111 1 1—1—1—]—1—1111 1 11 1 1 1 1 1----1---1—1---HIM 2
-i \\i\ r 1 1II 1 —
—
i-iT ' ' 1 til In 1 1
~
— 4
—
1
\\\\
- j-j 11IIIJ- -
ͣ
rlllljlilij 1
h
1 FT
1 ' 1 "—
1 lllll'
lllll ] III
11
--—
-i:ii ! '1
1_- 1 M lltlill llltllrliTl 1
29
increasing fines (< 10 )ua in their vork) content decreased material
dustiness. The materials used in our experiments were not sized belov 38 |un and therefore the content of < 10 }un material is not knovn; subsequently the increase or decrease in < 10 ^jn material cannot be assessed for our experiments. No other work has reported on the influence of increasing or decreasing particle size distribution on material dustiness, but Covherd (1989) reported that particle size distribution exhibits substantial partial correlation with mass loss vhen moisture content is taken into account.
The numbers for total mass of dust generated agree with other
published reports shoving that the dustiness of a material increases
with increasing drop height. Cowherd et al. (1989) reports that "it
is reasonable to anticipate a linear dependence of emission rate on
drop height over a limited range of heights". Their experiments
used drop heights of 14, 22, and 32 cm and compared the results to
those obtained from previous studies with the MRl dustiness tester
which has a drop height of 25 cm and concluded that "the suspended
particulate emission factor determined from pouring in the ACE laboratory vary approximately in direct proportion to drop height."
The data in Table 4 agree with this statement when comparing the low
drop height (50 cm) number (70.2 mg) to the base value (100 cm)
average (150.4 mg), this is a factor of 2.14 for a doubling in drop
height. The change in dustiness from the base value average to the
high drop height (150 cm) number (367.8 mg) is a factor of 2.44 for
an increase in drop height of 1.5 times. The BOHS (1988) has
case for the one drop of more than 1 meter in these experiments.
Heitbrink (1988), in a study comparing worker exposure to dustiness
test data, has reported that dustiness is related to drop height but
aoncludes that the exact relationship is uncertain and could vary
from material to material. The data contained in Table 6 does not
refute the idea of a linear relationship between drop height and
dustiness for drop heights of 1 meter or less. The drop height
correction in the table is the drop height (cm) used in our
experiments divided by the MRI drop height. The MRI predicted
values, corrected for drop height, show close agreement for all drop
heights (50, 100, and 150 cm) with decreasing accuracy for higher
moisture contents.
The strong relationship between moisture content and dustiness
is supported by the work of Lundgren (1979,1983) in determining
emission factors for fugitive emissions. This work showed
increasing moisture content to decrease dramatically a material's
dustiness. Cowherd (1989) also found "that low mass lost
(dustiness) is associated with high moisture content".
The variations in dustiness with mass flow rate do not match those described in the BOHS (1988) report in which they found that
dustiness decreases with increasing szunple mass. They report that
this relationship holds true for both materials dropped as a single
mass and for materials dropped in a continuous stream.
The data in Table 4 shows decreasing dustiness with increasing mass
flow from the low to base values but show an increase in dustiness
31
entrained air, air contained vithin the column of falling solids, is
forced out of the column upon impaction vith a surface. This
exhausting of air from the material carries away dust particles, an
increase in the zunount of air within the falling column could
reasonably be expected to carry off a higher voliime of dust
increasing the amount of dust measured in the air.
Entrained air flow was measured in all the experiments
conducted. Entrained air increases or decreases match changes in
dustiness for the cases of high drop height, high mass flow rate,
and low drop height but does not match the increase in dustiness
with decreased entrained air for the low mass flow rate situation.
There is no clear link between entrained air and dustiness although
it appears that increased entrained air flow increases dustiness.
No other work has reported on the effects of entrained air on
material dustiness and therefore these general trends can not be
checked against other work.
Applying the model developed by Cowherd (1989) for predicting
the fractional mass loss (mg/kg) to the sand used in these
experiments and correcting the model for the difference in drop
height the following results are obtained:
Table S. CoMparison. of Covhez-d Model to DataI
Predicted Value
(mcr/kq)
Moisture Content
Drop Height
Correction
Corrected Predicted Value
Actual Value 1
fiDCj/kq)
13.52 0.1 4 54.08
53.25 1
4.78 0.4 4 19.12 15.02
2.84 0.8 4 11.36 1.38
1 4.78
0.4 6 28.68 36.784.78 0.4 2 9.56
7.03 1
moisture content situation is predicted poorly by this model. The
accuracy decreases with increasing moisture content, a l.S%
difference between actual and predicted for the 0.1% moisture case
and sf 25% difference for the 0.4% moisture cases but a 700%
difference for the 0.8% moisture case.
The Systat MGHL package was used to analyze the data contained
in Table 4 and generate a "best" fit linear regression equation to
the data. The data was analyzed as the natural log of the values
presented in Table 4 with the size fraction less than 38 ^jn and the
mid-point of the impactor size range as additional data points
(Appendix C). The "best" fit equation to the transformed data is as
follows:
Gi=-7.216+(-1.324*M)+(0.85*H)+(0.851*frac)+(-0.388*Q)+(0.843*Di)(5)
(Note: all variables are expressed as natural logs)
Here, G^ is the log of generation rate of particles of size i, M is
the log of moisture content {%), H is the log of drop height (m),
frac is the log of the fraction of parent material £ 38 ^jn (%), 0 is
the log of mass flow rate (kg/sec), and Di is the log of the mid¬
point of the impactor stage size range (jun). The Systat output for
this model is shown in Table 7.
Table 7. Multiwariate Linear Regression Statistics
DEP VAR: GI N: 58 MULTIPLE R: .821 SQUARED MULTIPLE R: .674 ADJUSTED SQUARED MULTIPLE R: .64 3 STANDARD ERROR OF ESTIMATE: 0.879STD COEF TOLERANCE T P(2 TAIL)
0.000 1.0000000 -16.779 0.000 -0.400 .9974594 -5.043 0.000 0.137 .9992560 1.726 0.090 0.153 .9999033 1.928 0.059 -0.149 .9992879 -1.885 0.065 0.654 .9980722 8.257 0.000
ANALYSIS OF VARIANCE
SOURCE SUM-OF-SQUARES DF MEAN-SQUARE F-RATIO P REGRESSION 83.154 5 16.631 21.533 0.000
RESIDUAL 40.161 52 0.772
VARIABLE COEFFICIENT STD ERROR
CONSTANT -7.216 0.430
M -1.324 0.263
H 0.850 0.492
FRAC 0.851 0.442
Q -0.388 0.206
33
Using this modsl, plots of Pradictad Ln(G^) versus Actual
Ln(Gi) were constructed. These are Figures 8 & 9. Figure 8 is
simply a plot of actual versus predicted values which shows the
characteristic scatter that can be expected with a model that
explains only 67% of the variation seen in the data. Figure 9 is
the same plot only the data points are identified by impactor stage.
This plot was done in an attempt to determine the origin of the
outlaying data points. Figure 9 shows scatter for all stages but
the largest amount of scatter is observed in the first stage data.
As mentioned earlier, continuing work with the dustiness test
apparatus has shown a variation in the mass of material collected on
the first stage related to use of the styrofoam discs to maintain a
constant pile height and this could account for the variation seen
in the first stage data. Further work should be done to
investigate the difference between impaction on a hard surface
versus impaction on an existing pile of the material being tested
for its influence upon material dustiness.
Inclusion of entrained air in the model did not effect the
predictive power of the model other than to increase the standard
error of estimation by a small amount (0.009). Because the entrained
air value was not measured directly, it was excluded from the model.
Figures 8 and 9 in conjunction with the Systat statistics
indicate that more work is needed to determine adequately the
relationship between the variables. The agreement with other
published work indicates that the apparatus and method are a
reasonable means for developing a model to predict material
Figure 8. Plot of Predicted Dust Generation Rate versus
A-stage 1 0-Stage 2
*-Stage 3
+ -Stage 4 X-Backup Filter
O
C
D
<
Predicted Ln(Gi)
Figure 9. Plot of Predicted Dust Generation Rate versus
5.0 Conelus ions
The conclusions reached from this study are:
1) The drop test apparatus developed for this study is a. reasonable and acceptable means of assessing material dustiness.
2) Material dustiness is affected by the following factors, listed
in order of importance: a) Moisture Content b) Drop Height
c) Fines Content {< 38 )un in this study)
d) Mass Flow Rate
3) The affect of entrained air upon material dustiness is
inconclusive at this time.
4) The model developed from this data does not adequately account
for the data variability (R2 = 0.67), but is comparable to other
published models.
6.0 RaooaBandations & Liaitations
Recommendations:
Some recommendations are:
1. Material moisture content had the greatest effect upon dustiness. Variations in moisture content should be
37
effect upon dustiness between exposure to a high relative humidity atmosphere as compared to direct addition of moisture should be investigated.
2. A wider range of drop heights should be used to determine
better the relationship between drop height and dustiness.
3. Development of a better method/equipment for controlling mass
flow rate needs to be investigated.
4. The role of entrained air in dustiness and an improved means of measuring entrained air are necessary.
Limitations:
Some of the limitations of this study are:
1. Inability to measure directly the amount of air entrained in
the column of falling material.
2. The range of drop heights was limited by room size.
3. The limited range of mass flow rates available and the lack of control over these rates due to the "tubes and hopper" system
used.
4. The use of the Andersen impactor and its large substrates (12 inch dizuneter) whioh led to excessive handling of the substrates during the weighing and transfer processes, introducing a substantial opportunity for experimental error.
This work was supported in part by a grant from the National
7.0 Acknovladgaaents
I would like to express my appreciation and thanks to the many people who helped me complete this endeavor. David Leith, whose support, experience, guidance, criticism, and wit made my research both possible and enjoyable. The numerous people who have worked in or passed through the lab and offered not only assistance and encouragement but also some much needed harassment. Karen, my wife, without whose love and support I would not have been able to even begin this experience, much less achieve its' successful completion.
Richard and Rosalie Holstein, whose love and guidance over the years
39
8.0 Refarances
1. Anderson, D. M. , "Dust Control Design By the Air Induction
Technique", Industrial Medicine and Surgery : 68 (1964)
2. Andreasen, A. H. M., Hofman-Bang, N., Rasmussen, N. H., Uber
das Staubungsvermogen der Stoffe (The dust generating capacity
of materials), Kolloidzeitschrift, 86: 70 (1939)
3. Bartley, D. L., Doemeny, L. J., "Critique o£ 1985 ACGIH Report
on Particle Size-Selective San^ling in the Workplace", Am.
Ind. Hyg. Assoc. J. 47: 443 (1986)
4. British Occupational Hygiene Society Technical Guide No. 4,
"Dustiness Estimation Methods for Dry Materials: Part 1, Their
Uses and Standardization and Part 2, Towards a Standard
Method", Science Reviews Ltd. in association with H and H
Scientific Consultants Ltd. (1985)
5. Burton, R. M., Howard, J. N., Penley, R. L., Ramsay, P. A.,
Clark, T. A., "Field Evaluation of the High-Volume Particle
Fractionating Cascade Impaotor", J. Air Poll. Control Assoc,
23: 277 (1973)6. Cooper, D. W., Horowitz, M., "Exposures from Indoor Powder
Releases: Models and Experiments", Am. Ind. Hyg. Assoc. J.,
47: 214 (1986)7. Cowherd, C, Jr., Grelinger, M, A., Englehart, P. J., Kent, R.
F., Wong, K. F., "An Apparatus and Methodology for Predicting
the Dustiness of Materials", Am. Ind. Hyg. Assoc. J., 50: 123
(1989)
8. Cowherd, C, Jr., Grelinger, M. A., Wong, K. F., "Dust
Inhalation Exposures from the Handling of Small Volumes of
Powders", Am. Ind. Hyg. Assoc. J., 50: 131 (1989)
9. Erickson, C. H., Wood, 0. L., "Sizing of Atmospheric
Particulates with a High Volume Cascade Impactor",
Chemosphere, 2: 77 (1973)
10. Goodfellow, H. D., Smith, J. W., "Dustiness Testing - A New
Design Approach for Dust Control", paper presented at
Ventilation ' 88, 2nd International Symposium on Ventilation
for Contzuninant Control, London. (1988)
11. Hammond, C. M., "Dust Control Concepts in Chemical Handling
12. Hannnond, C. M., Davies, K. M., Higman, R. W., Wells, A. B.,
"ProgrsBS in Dustiness Estimation", Ann. Occup. Hyg. 32: 535
(1988)
13. Haitbrink, W. A., Todd, W. F., Fischbach, T. J., "Correlation of Tests for Material Dustiness vith Worker Exposure from the Bagging of Powders", Appl. Ind. Hyg., 4: 12 (1989)
14. Haitbrink, W. A., "Factors Affecting the Haubach and MRI Dustiness Tests", Unpublished report. (1989)
15. Haitbrink, W. A., Todd, W. F., Cooper, T. C, O'Brien, D. M.,
"The Application of Dustiness Tests to the Prediction of Worker Dust Exposure", Unpublished report. (1988)
16. Heitbrink, W. A, Cooper, T. C, O'Brien, D. M., "Study Report
: Evaluation of Dustiness Test Methods and Recommendations for
Improved Dust Control at Heubach Inc.", Report No. ECTB
154-11a, National Institute for Occupational Safety and Health. (1989)
17. Heitbrink, W. A., "In-Depth Survey Report : Control Technology
for Falling Solids at Cincinnati Paint and Varnish", Report No. ECTB 154-12b. (1988)
18. Heitbrink, W. A., Todd, W. F., "Final Report Control
Technology for Falling Solids at Rohm and Haas", Report No.
ECTB 154-10. (1987)
19. Hemeon, W. C. L., Plant and Process Ventilation, 2nd ed.. Industrial Press Inc., New York, 1963, pp. 46-56.
20. Hill, P., Robinson, J. C, Rubb. Plast. Age 50: 187 (1969)
21. Knuth, R. H., "Calibration and Field Application of a Sierra
Model 235 Cascade Impactor", Am. Ind. Hyg. Assoc. J., 45: 393
(1984)
22. Muleski, G. E., Cowherd, C, Jr., "Size Specific Particulate
Emissions from the Handling of Prilled Sulfur", paper 85-15.3
presented at Annual Meeting of the Air Pollution Control Association, Minneapolis. (1985)
23. Pring, R. T., Knudsen, J. F., Dennis, R., "Design of Exhaust Ventilation for Solid Materials Handling", Ind. and Eng. Chem., 41: 2442, (1949)
24. Sutter, S. L., Johnston, J. W., Mishima, J., "Investigation of
Accident-Generated Aerosols: Releases from Free Fall Spills", Am. Ind. Hyg. Assoc. J., 43: 540 (1982)
25. Sutter, S. L., Halverson, M. A., "Aerosols Generated by
Accidents: Pressurized Liquid Release Experiments", Am. Ind.
41
26. Sutter, S. L., "Powder Aerosols Generated by Accidents:
Pressurized Release Experiments", Am. Ind. Hyg. Assoc. J., 44: 379 (1983)
27. US Environmental Protection Agency, Con^ilation of Emission
Factors, 3rd ed.. Supplement No. 14, NTIS, Springfield, Va.,
(1983)
28. Unkown, NIOSH Comittee Review of Grant Proposal (1988)
29. Vanderpool, R. W., Lundgren, D. A., Marple, V. A., Rubow, K.
L., "Cocalibration of Four Large-Particle Impactors", Aerosol
Sci. & Teoh. 7: 177 (1987)
30. Wadley, M. W., Witz, S., Bope, W., MaoPhee, R. D., "Size Distribution Measurements of Particulate Matter in Los Angeles and Anaheim Using High-Volume Andersen Samplers", J. Air Poll. Control Assoc. 28: 364 (1978)
31. Willeke, K., "Performance of the Slotted Impactor", Am. Ind.
Hyg. Assoc. J., 36: 683 (1975)
32. Yocom, J. E., Hoffnagle, G. F., Brookman, E. T., Bowne, N. E., Miller, D. 3., Wilkinson, R. K., "Development of Fugitive Dust Emission Factors Using a Low Speed Wind Tunnel", paper 85-15.4
presented at the Annual Meeting of the Air Pollution Control
Association, Minneapolis, 1985.
33. ASTM, 0547 Standard Method of Test for Index of Dustiness of Coal and Coka, Annual Book of ASTM Standards, American Society
APPEKDIZ A
This section contains the necessary details regarding preparation, equipment set-up, and data analysis to perform the experiments
43
I. Equipaant Set-up
(A) Before starting check to make sure that Fan A is connected
to a voltage controller and that Fan B is connected to a Variac.
The valve on the pipe should be fully open to start.
(B) Position the hopper to the proper drop height (0.5, 1.0,
or 1.5 m). The drop height is measured from the bottom of the flov
control tube to the top of the material pile. Install the proper
tube for mass flow control, 0.09 kg/s, 0.47 kg/s, or 1.25 kg/s.
Install the hopper top plate with a hole diameter appropriate for
the flow and drop height conditions to be investigated.
(C) Center the hopper over the opening in the cheunber hopper
using a plumb bob.(D) The thermal anemometer should be positioned and taped in
place in the hole in the outlet pipe. A wooden ledge helps to
support the thermal anemometer.
II. Substrate Preparation
(A) Aluminum foil substrates are used throughout this
experiment. The foils are coated vith spray-applied, silicone
grease. A mask that covers the gasket sealing surfaces of the
impactor is used to prevent grease from getting on the sealing
surfaces and to leave an uncoated edge so that the substrates can be
handled. After applying the silicone grease the substrates should
be placed in their carrying case and left overnight to permit
solvent evaporation. Each substrate carries a nximber signifying the
substrate's position in the impactor (Stage Number) and letters to
denote the run number. The substrates are marked vith an ink marker
suitable for metal marking. The substrates are stored in plastic
bags after each run to prevent loss of collected dust. The plastic
bag and substrate are veighed together. Each plastic bag is marked
vith an impactor stage number and is used to hold the substrate vith
the same stage number for all experiments. The plastic bags and
substrates vith corresponding stage numbers should be stored and
veighed together.
(B) The glass fiber backup filter should equilibrate
overnight vith the substrates before use.
(C) A blank coated substrate and a blank backup filter are
45
III. Weighing
(A) Material - The amount of- material to be dropped is
weighed using the Ohaus Soale in Room 119. This scale weighs from
0-45 kg. The material is stored in plastic containers weighing
about 1 kg each. After the material is weighed it is loaded into
the material hopper.(B) Moisture Content - The moisture content of the material
is determined by taking a composite szui^le, from four locations
within the container, of material (30 grams) from the bulk volume,
weighing the material, drying the material in the oven for at least
24 hours and then reweighing the szunple. The difference in the
weights is the amount of moisture in the szinqsle. The moisture
content of a sample is increased by placing the material in a
container with an airtight lid, adding a known vol\ime of water to
the sample, sealing the container, rolling the container to mix the
water and material and then leaving the container for at least 24
hours. The true moisture content should be determined before using
the material by this method.
(C) Substrates - The substrates are weighed before and after
each run on the Mettler HL-52 Analytic Balance located in Rm. 149 of
Rosenau Hall. Each substrate and its corresponding plastic bag will
lY. Siava Analysis
(A) A sieve analysis of the material used is prefomned on a bulk sample of the material before each series of runs. The
following sieves are available:
Screen Size Opening
#5 4.0 mm
#7 2.8 mm #10 2.0 mm
#14 1.4 mm
#18 1.0 mm
#25 710 |tm #45 355 \UB #60 250 jun #100 150 )m #140 106 jun
#200 75 |un #270 53 jun #400 38 \m
Sieving is done as a combination of vet and dry sieving. A 1 kg sample of material is loaded into the coarse sieves (#10 - #60) and
then placed in the sieve shaker. The sieves are taped together to
prevent fine material from escaping. The sieves are checked periodically during shaking and any material in the pan (i #60) is removed and loaded into the fine sieves (#100 - #400). When no new
47
shaker and shaken for four (4) hours. After four hours the fine and coarse sieves are stacked and wet sieved to remove any fines that have adhered to the sieve screens or walls. The moisture is removed
by baking the sieves in the oven. The large sieves (> #18) are tared prior to sieving and weighed after moisture removal to determine the size fractions in these sieves. For the remainder of sieves, the material is transferred to glass beakers, which are
tared prior to recieving material, and the moisture is removed by
baking in the oven. After moisture removal the beakers are weighed
and the zimount of material in each beaker is determined.
V. Air Flow
(A) The required air flow through the cascade impactor is 34
m-^/hr, which is equivalent to a 1.47 KPa pressure drop across the
impactor. The air flow is controlled by the voltage controller attached to Fan A. Changing the setting on the voltage controller
changes the voltage applied to the fan motor which in turn increases
or decreases air flow. The voltage controller setting is adjusted while monitoring the AP across the cascade ioquictor with a water
manometer until 1.47 KPa AP is obtained.
(B) The air flow for removal of entrained air is set by using
the voltage controller attached to Fan B. The flow removed is
determined from the thermal anemometer reading for flow through the
vent hole in the hopper. A 0-tip dipped in titanium tetrachloride
is used as a telltale to check visually for airflow in or out of the
vent. The setting for Fan B is adjusted until a no-flow condition
is achieved at the vent.
VI. Clean—up of Eqaipaant
(A) The interior of the chzunber should be blown down with
compressed air after each run to remove any particles adhering to
the walls. The glass should be cleaned vith glass cleaner. When
the receiving hopper is full, the large shop-vac is used to remove
the material from this hopper.
(B) The impactor plates should be cleaned with soap and
water, then air dried to remove any silicone residue or dust on the
plates.
YII. Running the Ezpariaant
With the material weighed and loaded and the substrates
coated, installed in the impactor, and the impactor attached to the
Hi-Vol:
a) Close and seal the door. b) Turn on the Hi-Vol blowers
o) Set the air flow to 34 m-^/hr through the impactor - 1.47
49
d) Adjust the air ilovr for entrained air removal to the
desired set point.
e) Remove the stopper from the material hopper and start the stop watoh.
£) Turn o££ entrained air Hi-Vol when material flow stops,
record time
g) Run impactor Hi-Vol (Fan A) for six (6:00) minutes after material flov stops, this is three air changes through the
chzunber.
1^) Record all settings: Variacs, AP, time, thermal
anemometer.
i) Remove the impactor from the chamber, place each substrate and the backup filter in its marked bag, and place the bags in the carrier.
j) Weigh and record substrate and blank masses.
YIII. Data Analysis
(A) Sieve Data - Parent Material Size Distribution
The data obtained from sieving the material is processed into a size distribution by taking the mass of material found in each
size range and dividing it by the total mass of the sample to
determine the mass fraction in each size range. The cumulative percent is found by summing the percent in each size range