Sharif University of Technology
Scientia IranicaTransactions E: Industrial Engineering http://scientiairanica.sharif.edu
Hybrid cluster and data envelopment analysis with
interval data
K. Kianfar
a, M. Ahadzadeh Namin
b;, A. Alam Tabriz
c, E. Naja
a, and
F. Hosseinzadeh Lot
da. Department of Industrial Engineering, Science and Research Branch, Islamic Azad University, Tehran, Iran. b. Department of Mathematics, Shahr-e-Qods Branch, Islamic Azad University, Tehran, Iran.
c. Department of Management, Shahid Beheshti University, Tehran, Iran.
d. Department of Mathematics, Science and Research Branch, Islamic Azad University, Tehran, Iran. Received 5 May 2017; received in revised form 24 June 2017; accepted 10 July 2017
KEYWORDS Data envelope analysis; Cross-eciency matrix;
Cluster analysis.
Abstract. Data Envelope Analysis (DEA) is an approach to estimating the relative eciency of Decision-Making Units (DMUs). Several studies have been conducted in order to prioritize ecient units, and some useful models, such as Cross-Eciency Matrix (CEM), have been presented. Besides, a number of DEA models with interval data have been developed, and ranking DMUs with such data has been carried out. However, presenting an obtained crisp data derived from interval data is a critical problem; hence, many researches have been conducted so as to compute the weights and average of the interval data. This paper proposes a new algorithm to nd highly suitable weights by applying a data mining approach of DMU's data. For this purpose, clustering and a pair-wise comparison matrix were employed to estimate the given relative eciency of CEM. Results indicate that there is a meaningful dierence between eciency of DMUs with the lower bound and that of DMUs with the upper bound.
© 2018 Sharif University of Technology. All rights reserved.
1. Introduction
Data Envelop Analysis (DEA) is a linear programming model and a non-parametric approach that evaluates relative technical eciency of Decision-Making Units (DMUs) on the basis of multiple inputs and outputs by computing the ratio of weighted sum of their outputs to their inputs [1]. This technique has been used in many elds successfully with crisp values; however, in real application, there are inaccurate data similar
*. Corresponding author.
E-mail addresses: [email protected] (K. Kianfar); [email protected] (M. Ahadzadeh Namin); [email protected] (A. Alam Tabriz); [email protected] (E. Naja); [email protected] (F. Hosseinzadeh Lot)
doi: 10.24200/sci.2017.4482
to probabilistic, interval, ordinal, qualitative, or fuzzy data. Hence, some researchers have developed several theoretical frameworks of DEA model with data such as interval [1]. Although there are many models and techniques to solve such a problem, there is a new problem, that is, ranking the ecient DMUs with interval data. Thus, in some researches, DMUs were ranked by these ideal points [2,3]. There are several models to rank DMUs with crisp data [4]. However, in all researches, ranking DMUs with interval data has been done using ranking approaches, such as AHP or TOPSIS or hybrid algorithm, to nd suitable weights in order to calculate crisp eciency basis of interval inputs and outputs. Therefore, a new approach was conducted using data mining techniques, similar to clustering, to obtain these weights as a new model. Jahanshahloo et al. [5] focused on ranking DMUs using ideal points (ideal points are obtained by improving
lower bounds of DMUs) by formulating the interval DEA model in order to achieve an eciency interval including evaluations from both the optimistic and the pessimistic viewpoints. Wu et al. [3] presented a method for ranking the performance of DMUs, named cross-eciency method, with interval data in the DEA model to calculate the interval of cross-eciency values based on TOPSIS method. Akbarian [6] introduced a method for ranking all extreme and non-extreme DEA-ecient DMUs based on the cross-eciency and Ana-lytic Hierarchy Process (AHP) methods. Jahanshahloo et al. [5] proposed a cross-eciency model based on super-eciency for ranking units through the TOPSIS approach. The proposed method was extended to interval data. One of the main drawbacks of the cross-eciency method is that dierent optimal weights associated with the eciency score of a given DMU may exist. In their work, a super-eciency model was presented to overcome this problem.
The aim of this paper is to combine clustering method with AHP (Analytic Hierarchy Process) using Sexton method, which is considered to be the novelty of this work. The rest of this paper is structured as follows. In Section 2, an overview of the research techniques includes DEA model, interval DEA model, cross-eciency matrix, and cluster analysis, to be discussed. In Section 3, a multi-step algorithm is introduced to compute the weights of the combination of lower and upper bound eciencies of DMUs. There-fore, crisp eciency, instead of the interval eciency, is obtained. In Section 4, a case study about eciency evaluation of a commercial bank branch in Iran is implemented to illustrate and validate the proposed method. Finally, the conclusion section is given at the end of the paper.
2. Overview of the research techniques 2.1. DEA models
It is assumed that there are n DMUs to evaluate and index by j = 1; 2; ; n; each DMU is assumed to produce dierent s outputs from dierent m inputs. Let the observed input and output vectors of DMUj be
Xj = (x1j; x2j; ; xmj) and Yj = (y1j; y2j; ; ymj),
respectively, where all components of vectors Xj and
Yj for all DMUs are non-negative, and each DMU
has at least one strictly positive input and output. vi(i = 1; ; m) is the input weight of x vectors.
yr(r = 1; ; s) is the output weight of y vectors.
Weights of vi and yr are positive. In the previous
section, DEA technique was dened completely. In this part, existing models are described in relation to DEA. There are three commonly orientations for DEA model, which can be formulated as follows:
1. Model 1 is an input-oriented CCR model related
to the minimizing level of the inputs in order to achieve a given level of the outputs. Therefore, the further the value of gets from unity, the more ideal the condition of the problem will be:
min p= m
X
i=1
vixip
, s
X
r=1
uryrp;
subject to:
m
X
i=1
vixij
, s
X
r=1
uryrj 1 j = 1; ; n;
ur; vi 0: (1)
2. Model 2 is an output-oriented CCR model con-cerned with the maximizing level of the outputs per given level of the inputs. Hence, the further the value of gets from unity, the more ideal the condition of the problem will be [7-9]:
max p= s
X
r=1
uryrp
,m
X
i=1
vixip;
subject to:
s
X
r=1
uryrj
, m
X
i=1
vixij 1 j = 1; ; n;
ur; vi 0: (2)
3. Base-oriented model, unlike the others, pertains to the optimal combination of the inputs and outputs. Consequently, this model has control over inputs as well as outputs, concluding the eciency of input utilization and eciency of output production [8]. 2.2. Interval DEA models
Entani and Tanaka [10] already proposed the interval DEA model to obtain the eciency interval. The eciency interval is represented by its upper and lower bounds.
Instead of exact data, models with interval data will be applied in order to rank DMUs. Input-oriented model with interval data for upper and lower bound eciencies is formulated, respectively, as follows: Upper bound eciency:
U = maxXs r=1
uryrpU;
subjected to:
m
X
i=1
vixLip= 1; s
X
r=1
uryLrj m
X
i=1
j = 1; ; n; j 6= p;
s
X
r=1
uryrpU m
X
i=1
vixLip 0;
vi; ur 0: (3)
Lower bound eciency: L= maxXs
r=1
uryLrp;
subjected to:
m
X
i=1
vixUip = 1; s
X
r=1
uryrjU m
X
i=1
vixLij 0;
j = 1; ; n; j 6= p;
s
X
r=1
uryrpL m
X
i=1
vixUip 0;
vi; ur 0: (4)
The purpose of Models 3 and 4 is to raise the maximum eciency in the interval state. Input and output vectors are individually considered as interval and Upper (U) and Lower (L) bounds. Two states are considered for each of input and output vectors: In the rst state, the input value is minimum and maximum such that Xij 2 [xLij; xUij]. In the second
state, the output value is minimum and maximum such that Yrj2 [yLrj; yUrj].
The purpose of Model 3 is to nd the best condition of unit under assessment, DMUp, which
includes xij(p) and yrj(p) vectors. In this model, the
goal is to nd an increase in outputs and a decrease in inputs for the unit under assessment. On the contrary, for other units (j 6= p), the purpose is to nd the worst condition, implying a decrease in outputs and an increase in inputs. In Model 4 (lower bound, L),
the objective is nding the worst condition for DMUp
which consists of xij(p) and yrj(p). In this model, the
target is to nd a decrease in outputs and an increase in inputs for the unit under assessment. Contrarily, for other units (j 6= p), the purpose is to nd the best condition, implying a mean increase in outputs and a decrease in inputs.
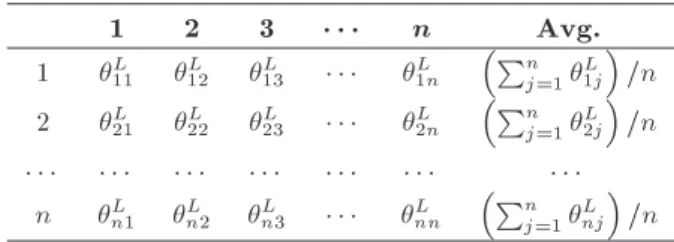
2.3. Cross-eciency matrix
Sexton et al. [11] introduced the cross-eciency matrix in 1986. This approach aids us in evaluating eciency of one DMU considering the optimal input and output
weights of another DMU [9]. Matrix element, ij, of the
Cross-Eciency Matrix (CEM) in the ith column and the jth row of CEM represents the eciency of DMUi
when evaluated with the optimal weights of DMUj,
according to the following relationship: DMUj
DMUi = ij = ei(u
j; vj) =Xs r=1
uryrp: (5)
It is expected that `good' DMU has several high values in its row.
2.4. Cluster analysis
Clustering is a popular data mining approach that deals with the separation of a set of objects from a useful set of mutually exclusive clusters in order that the similarity between the observations from the dierent clusters (i.e., subset) is low, whereas the similarity between the observations within each cluster is high [8]. Unlike decision trees which assign a class to an instance (supervised method), clustering procedures are applied when instances are divided into natural groups (unsupervised method). There are dierent ways of producing these clusters. The groups may be exclusive, that is, any instance belongs to only one group:
1. Probabilistic or fuzzy, i.e., an instance belongs to each group to a certain degree or probability (membership value);
2. Hierarchical group: There is a crude division of instances into groups at the top level, and each of these groups is rened further up to individual instances [12].
In other literature, the overview of the two general approaches to clustering was provided: hierarchical clustering and partitional clustering (e.g., k-means, k-median). The hierarchical clustering could make clusters by one of the two methods: agglomerative or divisive. An agglomerative method assumes that each data point is its own cluster and, with each step of the clustering process, these clusters are combined to form larger clusters, which are eventually combined to form a single cluster [13]. A divisive method of the hierarchical clustering, on the contrary, commences with the single cluster including all data points within the sample and proceeds to divide it into the smaller dissimilar clusters. Unlike hierarchical clustering, k-means clustering requires the number of resulting cluster, k, to be specied prior to analysis. Thus, k-means clustering will produce dierent k clusters of the greatest possible distinction [8].
3. Methodology
In this section, a multi-step algorithm is introduced to compute the weights of the combination of lower
and upper bound eciencies of DMUs so that the crisp eciency can be obtained rather than the interval eciency.
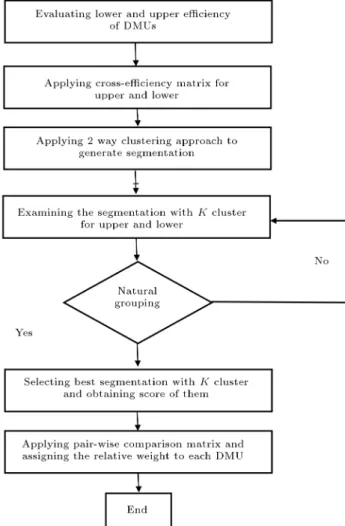
In the proposed algorithm, there are ve stages as follows:
1. Evaluating eciency of DMUs: The DMU's per-formance is measured using DEA (L; U) based
on Eqs. (3) and (4). It is underlined that input-oriented model was applied, because, in the con-ducted research by Samoilenko et al. (2008) [13], the most natural grouping of DMUs was provided by the results of that model using a Constant Return to Scale (CRS) criterion (i.e., CCR model); 2. Applying the cross-eciency matrix: The ecient DMUs are prioritized according to CEF and Eq. (5). The matrices are implemented as in Tables 1 and 2. 3. Cluster analysis of upper and lower bounds: The DMUs are clustered using the k-mean approach (indicators including outputs and inputs as the attributes):
a. Clustering of DMUs with lower eciency is done according to the data points of Table 3; b. Clustering of DMUs with upper eciency is
applied by the data points of Table 4.
4. Obtaining the score for each cluster: The average relative eciency of some clusters identied in the
Table 1. CEM for the lower eciency of the DMU.
1 2 3 n Avg.
1 L
11 12L L13 1nL Pnj=11jL
=n 2 L
21 22L L23 2nL Pnj=12jL
=n
n L
n1 n2L Ln3 Lnn Pnj=1njL
=n Table 2. CEM for the upper eciency of the DMU.
No. 1 2 3 n Avg.
1 U
11 12U U13 U1n Pnj=11jU
=n
2 U
21 22U U23 U2n Pnj=12jU
=n
n U
n1 Un2 n3U Unn Pnj=1Unj
=n Table 3. Clustering with lower eciency.
Indicators
A
ttributes
xL
11 xLi1 xLm1 yL11 yr1L ys1L
xL
ij yrjL
xL
1n xLin xLmn yL1n yrjL yLsn
Table 4. Clustering with upper eciency. Indicators Cluster no.
A
ttributes
xU
11 xUi1 xUm1 yU11 yr1U yUs1
xU
ij yrjU
xU
1n xUin xUmn y1nU yrjU yUsn
previous step is computed according to the research by semoilinko et al. (2008). It is noted that average of the clusters in the lower bound is dierent from that for clusters in the upper bound.
5. Assigning the relative weight to each DMU: A numerical scale and a derived graphic scale in AHP are approximated (analytic hierarchy process) and assigned to each cluster according to given score. A pair-wise comparison matrix is used in order to obtain relative importance for indices (e.g., clusters) and rank them. In fact, results indicate relative importance of DMU within each cluster considering the obtained relative importance of its cluster.
As a result, the nal crisp eciency of each DMU is calculated by computing Weighted Average (W.A.) of (Pnj=1L
1j)=n and (
Pn
j=1U1j)=n. Therefore, more
W.A. indicates more ranks for each DMU. The pro-posed algorithm is shown in Figure 1 [14].
4. Numeric example and results 4.1. Data
The numerical example is taken into account, and this approach is applied to the selected commercial bank branch in Iran, used as interval data in the conducted research by Jahanshahloo and Hosseinzadeh Lot in 2009 [15] (reference of data). Each branch utilizes three inputs to generate ve outputs, and there are 20 branches. The three inputs are payable interest, personnel, and non-performing loans. The ve outputs of the bank include the total sum of four main deposits, other deposits, granted loans, received interest, and fee. 4.2. Implementation, results, and discussion First, the cluster analysis is applied to the whole data including 20 bank branches. For this purpose, the k-means approach is employed according to the introduced approach of the conducted research by Samoilenko et al. in 2008 [13]; hence, they dened Kmax
and Outlier as parameters, and then Kmax clusters
was generated. Following the examination of the segmentation with K clusters, they were able to show that the current segmentation with K clusters does not provide the natural grouping of DMUs; if K > 1, there is at least one cluster that includes less than Outlier percentage of DMUs. Therefore, by decreasing
Figure 1. Proposed algorithm for evaluating DMUs.
the number of clusters, the previous examination is repeated in order to evaluate a new segmentation. Otherwise, they could access the best segmentation with K clusters.
It should be noted that Outlier is an index to
identify natural clustering. Moreover, a silhouette index introduced by Peter J. Rousseeuw in 1987 is considered so as to nd natural and qualied clustering. Average silhouette width is inside the interval [ 1; 1] so that the value close to 1 indicates natural grouping and that close to 1 indicates incorrect clustering.
Parameters Kmax and Outlier are set to 5 and
10%; thus, with the average silhouette more than 0.5, we could come up with two solutions that disaggregate upper data and lower data into two and three clusters, respectively. Results of clustering are shown in Table 5. As discussed in the steps of algorithm, CCR (constant return to scale) and input-oriented models are applied in order to measure the relative eciency of DMUs with interval data. Details are shown in Table 6. In addition, the average relative eciencies of the two and three identied clusters of upper and lower data are calculated separately, and the results are shown in Table 7.
Table 5. Results of clustering. Number of
clusters
Number of DMUs in each cluster
Average Silhouette
width
Upp
er Five clustersFour clusters 1, 7, 1, 6, 511, 5, 3, 1 0.24810.4734 Three clusters 7, 1, 12 0.5098 Two clusters 12, 8 0.6037
Lo
w
er Five clusters 3, 5, 8, 3, 1 0.2335 Four clusters 7, 1, 5, 7 0.2039 Three clusters 3, 14, 3 0.5735
Table 6. Interval eciency of DMU. DMU (L; U) DMU (L; U)
1 (1.0, 0.29) 11 (1.0, 1.0) 2 (0.21, 0.77) 12 (0.32, 0.49) 3 (0.52, 1.0) 13 (0.44, 0.70) 4 (1.0, 1.0) 14 (0.25, 0.72) 5 (0.63, 0.38) 15 (0.41, 1.0) 6 (0.90, 1.0) 16 (0.22, 1.0) 7 (0.73, 1.0) 17 (1.0, 1.0) 8 (1.0, 1.0) 18 (0.26, 0.95) 9 (1.0, 1.0) 19 (0.99, 1.0) 10 (1.0, 1.0) 20 (0.18, 0.97)
Table 7. Score of clusters. Cluster no. Score
Upper C1 0.9113
C2 0.8317
Lower
C1 0.9967
C2 0.6433
C3 0.5814
Table 8. Numerical scale of lower data.
Index C1 C2 C3
C1 1 2 7
C2 0.5 1 6
C3 0.143 0.167 1
Sum 1.643 3.147 14
In this stage, a numerical scale is approximated considering the given score of each cluster (Tables 8 and 9). Therefore, the relative importance or the weight of each DMU for upper and lower eciencies is obtained (Table 10).
com-Table 9. Numerical scale of upper data.
Index C1 C2
C1 1 2
C2 0.5 1
Sum 1.5 3
Table 10. Relative importance of clusters. Cluster Weight
Upper C1 0.67
C2 0.33
Lower
C1 0.58
C2 0.35
C3 0.07
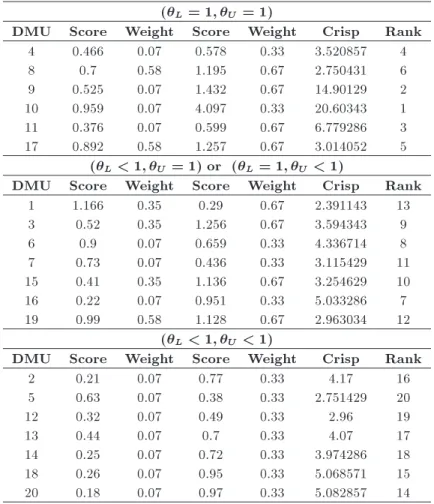
puted using the obtained relative weight and score concerning to upper and lower data in interval data (Table 11). The ranking process is implemented for the following parts separately:
1. DMU with the interval eciency (L= 1, U = 1);
2. DMU with the interval semi-eciency (L < 1,
U = 1) or (L= 1, U < 1);
3. DMU with the interval ineciency (L < 1, U <
1).
It is noted that the ecient value of DMUs is set according to results of the cross-eciency matrix. 5. Conclusion
This paper studied the ranking methodology of DMUs with the interval data. There are several approaches to prioritizing DMUs using the combination of DEA and ranking techniques such as AHP or TOPSIS. In contrast, Data Mining (DM) techniques were applied, similar to cluster analysis, in order to investigate partitional data (DMUs) based on their attributes. Assigning the relative weights to DMUs with interval data (lower and upper) helped compute the weighted average of lower and upper data; however, the ap-proximation of weights and suitable methodology to obtain these is an important problem. Therefore, clustering as a DM approach has the ability to explore appropriate relative importance for all DMUs that are similar to each other. On the other hand, the eciency of DMUs was evaluated by applying DEA and was ranked using the CEM approach. The proposed
Table 11. Ranking DMU with interval data. (L= 1; U= 1)
DMU Score Weight Score Weight Crisp Rank
4 0.466 0.07 0.578 0.33 3.520857 4
8 0.7 0.58 1.195 0.67 2.750431 6
9 0.525 0.07 1.432 0.67 14.90129 2
10 0.959 0.07 4.097 0.33 20.60343 1
11 0.376 0.07 0.599 0.67 6.779286 3
17 0.892 0.58 1.257 0.67 3.014052 5
(L< 1; U = 1) or (L= 1; U< 1)
DMU Score Weight Score Weight Crisp Rank
1 1.166 0.35 0.29 0.67 2.391143 13
3 0.52 0.35 1.256 0.67 3.594343 9
6 0.9 0.07 0.659 0.33 4.336714 8
7 0.73 0.07 0.436 0.33 3.115429 11
15 0.41 0.35 1.136 0.67 3.254629 10
16 0.22 0.07 0.951 0.33 5.033286 7
19 0.99 0.58 1.128 0.67 2.963034 12
(L< 1; U< 1)
DMU Score Weight Score Weight Crisp Rank
2 0.21 0.07 0.77 0.33 4.17 16
5 0.63 0.07 0.38 0.33 2.751429 20
12 0.32 0.07 0.49 0.33 2.96 19
13 0.44 0.07 0.7 0.33 4.07 17
14 0.25 0.07 0.72 0.33 3.974286 18
18 0.26 0.07 0.95 0.33 5.068571 15
algorithm was employed for 20 bank branches. Results show the crisp eciency obtained for each DMU by using the combined cluster analysis, and CEM was computed based upon the correct weighting. Because this weighting originates from natural similarity of DMUs to each other, their inputs and outputs have been considered as attributes. Future works could focus on the DEA and cluster analysis with fuzzy data. In addition, the multi-stage DEA with fuzzy data can be considered as our next research in the future. Nomenclature
yL
r Lower limit of an output vector
yu
r Upper limit of an output vector
xL
i Lower limit of an input vector
xu
i Upper limit of an input vector
u Eciency of upper limit
p Eciency of \P " point
vi Input weight
ur Output weight
xi Input vector
yr Output vector
L Eciency of lower limit
References
1. Lu, T. and Liu, S.T. \Ranking DMUs by
compar-ing DEA cross-eciency intervals uscompar-ing entropy mea-sures", Entropy, 18(12), p. 452 (2016).
2. Sadeghi Gavgani, S. and Zohrehbandian, M. \A
Cross-eciency based ranking method for nding the most ecient DMU", Math. Probl. Eng., 2014, pp. 1-6 (2014).
3. Wu, J., Sun, J., Song, M., and Liang, L. \A ranking
method for DMUs with interval data based on DEA cross-eciency evaluation and TOPSIS", J. Syst. Sci. and Syst. Eng., 22(2), pp. 191-201 (2013).
4. Mirhashemi, A. and Izadikhah, M. \Ranking DMUs in
the presence of undesirable data", J. Basic. Appl. Sci. Res., 3(4), pp. 910-919 (2013).
5. Jahanshahloo, G.R., Hosseinzadeh Lot, F., Shoja, N.,
Tohidi, G., and Razavyan, S. \Ranking using l1-norm in data envelopment analysis", Appl. Math. Comput., 153(1), pp. 215-224 (2004).
6. Akbarian, D. \Ranking all DEA-ecient DMUs based
on cross eciency and analytic hierarchy process meth-ods", J. Opt., 2015, pp. 1-10 (2015).
7. Zohrehbandian, M. and Sadeghi Gavgani, S.
\Cross-eciency evaluation under the principle of rank pri-ority of DMUs", World. Appl. Sci. J., 21, pp. 46-49 (2013).
8. Yang, F., Ang, S., Xia, Q., and Yang, C. \Ranking
DMUs by using interval DEA cross eciency ma-trix with acceptability analysis", Eur. J. Oper. Res., 223(2), pp. 483-488 (2012).
9. Caklovic, L. and Hunjak, T. \Measuring
DMU-eciency by modied cross-DMU-eciency approach", Math. Communication, 17, pp. 559-573 (2012).
10. Entani, T., Maeda, Y., and Tanaka, H. \Dual models
of interval DEA and its extension to interval data", Eur. J. Oper. Res., 136(1), pp. 32-45 (2002).
11. Sexton, T.R., Silkman, R.H., and Hogan, A.J. \Data
envelopment analysis: critique and extensions" In: Silkman, R.H. (Ed.), Measuring Eciency: An As-sessment of Data Envelopment Analysis, Jossey-Bass, San Francisco, CA (1986).
12. Dai, X. and Kuosmanen, T. \Best-practice
benchmark-ing usbenchmark-ing clusterbenchmark-ing methods: Application to energy regulation", Omega, 42(1), pp. 179-188 (2014).
13. Samoilenko, S. and Osei-Bryson, K.M. \Increasing the
discriminatory power of DEA in the presence of the sample heterogeneity with cluster analysis and decision trees", Exp. Syst. .Appl., 34(2), pp. 1568-1581 (2008).
14. Amin, G.R., Emrouznejad, A., and Rezaei, S. \Some
clarications on the DEA clustering approach", Eur. J. Oper. Res., 215(2), pp. 498-501 (2011).
15. Jahanshahloo, G.R., Hosseinzadeh Lot, F., Rostamy
Malkhalifeh, M., and Ahadzadeh Namin, M. \A gen-eralized model for data envelopment analysis with interval data", Appl. Math. Model., 33(7), pp. 3237-3244 (2009).
Biographies
Kianoosh Kianfar is a PhD Student of Industrial Engineering, Operations Research, and Systems Engi-neering in Science and Research Branch, Islamic Azad University, Tehran, Iran. His research interests are in-dustrial engineering, data envelopment analysis, oper-ations research, and decision theory. He has published two papers in national and international journals. Mahnaz Ahadzadeh received his PhD degree in Applied Mathematics from the Science and Research Branch, Islamic Azad University, Tehran, Iran in 2009. She is currently an Assistant Professor in Islamic Azad University, Shahr-e-Qods Branch. Her research interests are data envelopment analysis, eciency analysis, applied mathematics, productivity analysis, and applied econometrics. Some of her publications are available in https://www.researchgate.net/prole/ Mahnaz Namin
Akbar Alam Tabriz received his PhD degree in Management from Turkey in 1989. He is currently an Associated Professor in Shahid Beheshti University. His research interests are performance evaluation in
production industries, implementation of Total Quality Management (TQM), and eciency and productivity measurement in Industry. He has published several papers in national and international journals.
Esmaeil Naja received his PhD in Industrial En-gineering from Science and Research Branch, Islamic Azad University, Tehran, Iran in 2009. He is currently an Associated Professor in Islamic Azad University, Science & Research Branch. His research interests are industrial engineering, applied and computational Mathematics, operations management, and optimiza-tion. Some of his publications are available in the
following link: https://www.researchgate.net/prole/ Esmaeil Naja3
Farhad Hosseinzadeh Lot received his PhD de-gree in Applied Mathematics from Science & Re-search Branch, Islamic Azad University, Tehran, Iran in 2000. He is currently a Professor in Islamic Azad University, Science & Research Branch. His research interests are mathematics, operation re-search, data envelopment analysis, and eciency. Some of his publications are available in the follow-ing link: http://scholar.google.com/citations?user=gc qn8gAAAAJ&hl=en