Ellis B. Johns. Detecting Disease from Administrative Data: What Diseases Can We Really Detect and Implications for Clinical Decision Support. A Master’s Paper for the M.S. in I/L.S degree. April, 2009. 30 pages Advisor: Robert Losee.
Objective: To identify rule sets based on administrative data to detect the IOM priority conditions (Persistent Asthma, Diabetes, Heart Failure, COPD, Hypertension, MI, Stroke, & Hyperlipidemia) as well as obesity and depression, and also to evaluate each rule set's applicability to clinical decision support (CDS)
Design: Administrative Code based rule sets generated by an iterative process and evaluated by direct comparison with a chart review based gold standard.
Data sources: Medicaid claims data from North Carolina Health Information Exchange compared with electronic medical records from the Duke University Health System. Results: 10 diseases were included in our study. Of these 10, only 2 diseases,
hypertension (HTN) and diabetes mellitus (DM) produced adequate rule sets for clinical decision support. HTN had PPVs ranging from 0.89 to 0.94, and DM had PPVs ranging from 0.91 to 0.94. The rule sets for the other diseases all had PPVs less then 0.90, and were thus not considered to be useful for clinical decision support. Because not everyone using disease detection algorithms has a CDS focus, we have included the performance of all our generated rule-sets in tabular format.
Conclusions: Several factors were closely correlated with a rule set’s ability to accurately detect the presence of a particular disease. Perhaps the greatest of these factors was the granularity of the underlying code system. For the 2 diseases which had very specific ICD codes (i.e. HTN and DM), a simple and accurate rule set was created.
Headings:
Clinical Informatics Clinical Decision Support Administrative Code Review Medical Chart Audit
DETECTING DISEASE FROM ADMINISTRATIVE DATA: WHAT DISEASES CAN WE REALLY DETECT AND IMPLICATIONS FOR CLINICAL DECISION
SUPPORT
by Ellis B. Johns
A Master’s paper submitted to the faculty of the School of Information and Library Science of the University of North Carolina at Chapel Hill
in partial fulfillment of the requirements for the degree of Master of Science in
Information/Library Science.
Chapel Hill, North Carolina April 2009
Approved by
Introduction
Evaluating Rule Sets for Clinical Decision Support
In this study, the authors evaluated candidate rule sets for 10 chronic diseases and sought to determine which diseases could be accurately detected using only healthcare related administrative data. Our chief purpose was to determine if our candidate rule sets could be used for clinical decision support (CDS), and thus we sought to optimize each rule set’s positive predictive value. However, we did document non-CDS related statistical measures such as the negative predicative value, sensitivity, specificity, and Youden’s index so that our results might be extended to non-CDS applications
Background for Clinical Evaluation and Transparency
which created an impetus for healthcare transparency at all levels of the healthcare system (Health and Human). As a result of this initiative, a number of regional “data partnerships” were initiated between private and public health plans for the purpose of evaluating our healthcare system. One such system, the North Carolina Health
Information Exchange (NCHIE), has enabled multiple patient care interventions to improve the care that Medicaid beneficiaries receive in central North Carolina (Lobach et al.; M. Schatz and D).
What Information is Being Shared and How It is Used
have certain illnesses are only effective at a suboptimal level (Pawlson, Scholle and Powers). One of these evaluation methods, which is known as the Healthcare
Effectiveness Data Information Set (HEDIS), was developed by the National Committee for Quality Assurance’s (NCQA) Committee on Performance Measurement (NCQA; Treadwell and Treadwell). This NCQA committee does not publish their methods for deriving the HEDIS healthcare measures, but does sell the finished algorithms in its volume 2 specification manual. With these finished algorithms, a commercial health plan’s performance can be rated and compared with other commercial and government health plans (i.e. Medicare/Medicaid and VA)(Pawlson, Scholle and Powers; N. M. Mencke and J; Landon et al.).
Advantages and Disadvantages of HEDIS
Although research demonstrates that patients under managed care organizations (MCO) with higher HEDIS scores tend to have reduced healthcare costs and improved disease management, the criterion HEDIS uses to determine which patients have a certain disease has been shown to lack sensitivity and specificity when compared with national
HEDIS’ Applicability to Clinical Informatics
Currently, there is a push outside of the managed care industry to find ways of using healthcare administrative data to improve patient care at the hospital and primary care levels. The hope is that the use of shared administrative data will allow primary care physicians and managed care coordinators to better utilize information technology. Such information will provide better tools to determine which patients will likely need
increased attention, which patients are not adhering to medical advice, and which patients are not being treated according to current standards of care. In essence, this
administrative data can be utilized to better inform the healthcare providers instead of being used only by the healthcare payers (e.g. insurance agencies). A number of tools to accomplish this task have already been created and implemented, and they continue to impact communities such as Durham, NC (Eisenstein et al.). However, continued improvement and refinement of these clinical informatics tools is still needed. The standards currently being employed to guide these informatics tools, like HEDIS, still need to be rigorously scrutinized and evaluated to determine if these standards can be optimized further before they are applied in clinical informatics areas such as pay for performance or decision support.
Creating Standard Rule Sets to Detect Disease from Administrative Data
that these improved algorithms do not address, and consequently many diseases do not have an optimized administrative code detection algorithm. This study aimed at generating improved detection algorithms for all of the IOM’s eight priority conditions (persistent asthma, diabetes, heart failure, COPD, hypertension, MI, stroke, &
hyperlipidemia)(Adams and Corrigan) with the addition of obesity and depression. Additionally, we sought to determine if the improved rule sets found in literature applied to the North Carolina Piedmont Medicaid population.
Clinical Decision Support (CDS) Systems and Administrative Code Optimization
CDS systems rely on accurate information reaching the care provider in a timely and workflow inclusive manor (Kawamoto et al.). Additionally, delivering accurate recommendations to the care provider with the minimum number of false positives is extremely important to any CDS system’s utility (Solberg et al.). To assess the ability of a particular rule/criteria to accurately predict the presence of a disease, a positive
predictive value (PPV) is normally used. “PPV is defined as the proportion of patients with positive test results who are correctly diagnosed. It also is the most important measure of a diagnostic method as it reflects the probability that a positive test reflects the underlying condition being tested for (Contributors).” It can be calculated using the equation:
TP/(FP+TP)
Where TP= true positives and FP = false positives
Where FN= false negatives and TN= true negatives
NPV is often used to evaluate a test’s ability to predict the absence of a disease (i.e. rule-out a disease). Also, a value known as Youden’s index (Sensitivity + Specificity -1) is often used as a measure of overall rule performance since this value takes into account a rule’s overall ability to predict the presence or absence of a disease. (note: a Youden’s index of 1 implies perfect PPV and NPV, while an index of -1 implies a poorly
performing rule/test)(Wakefield and Cloutier). Because this study was aimed at improving an administrative code based rule/test’s ability to accurately predict the presence of disease, optimizing a disease detection algorithm’s PPV was of central importance, however, we included all of the above mentioned statistical values in the hope that our results might be extended to non-CDS applications as well.
NCHIE to Evaluate and Generate Improved Disease Detection Code Sets
Methods
Methods Overview
This study was broken down into four main parts. The first part involved writing a java/SQL filter to select only patients from the underlying claims database (a.k.a. COACH) that met our inclusion criteria (See Figure 1). Following this step, a chart review was conducted to record which studied disease(s) were present in each of the selected patients. Next, a java and SQL based computer program was created to retrieve each patient’s administrative codes that represented a specific disease studied by our group. Finally, a comparison was made between these code counts and the chart review generated gold standard.
Patient Record Selection
Chart Review and Filtering Criteria
In order to critically evaluate the accuracy of each code based disease detection
algorithm, a “gold standard” tuple of each patient’s clinically diagnosed disease(s) paired with their unique identifier was generated. To determine which patients qualified as having a particular disease of interest, a chart review of all non-filtered COACH records was conducted (See Figure 1). These chart audits were done by a 4th year medical student with the oversight and guidance of senior physicians from the Duke Department of Community and Family Medicine.
This audit consisted of:
1. Observing each patient's last 4 records, or last 2 years of records (whichever comes first), generated by an internal or primary care physician (PCP or generalist).
a. A physician was considered a PCP if they served as a particular patient's primary care physician (i.e. the physician was treating, and or monitoring, a patient's health maintenance), and the physician had training in an internal/family medicine residency to acquire their practicing license. This choice was made due to the observation during initial chart audits that Duke Family Medicine, Duke Outpatient, and Duke General Medicine notes included the most comprehensive medical records available to the auditor.
b. We found that 96% of IOM diseases of interest were found by
diagnoses were found by reviewing a patient's past 2 years of medical records.
2. Observing all acute care records occurring after the latest PCP’s note.
a. The authors decided to review these recent acute care records to ensure that a diagnoses coded after the most recent PCP note would not be missed by our audit (e.g. a myocardial infarction emergency room record for a patient who had not had not yet had a follow-up
appointment with their PCP would have produced an erroneous gold standard result if we had not included this criteria).
3. Manually observing each record's problem list to determine if a particular IOM disease was/is present based on clinical evaluation.
Results
Below are the results for each of the diseases studied, as well as background information for each algorithm’s developmental process.
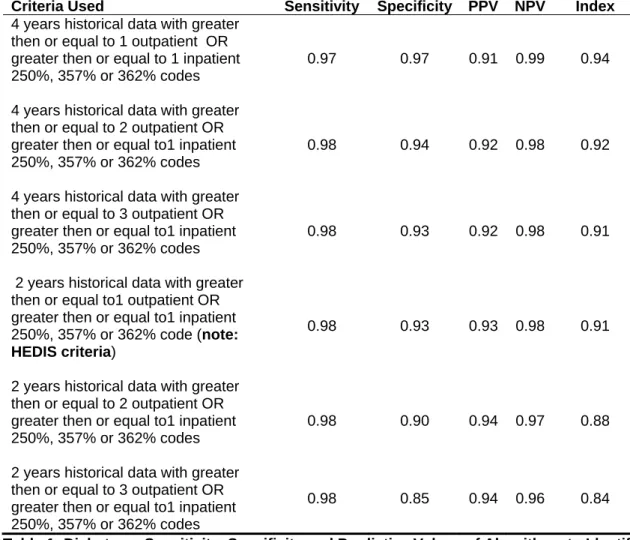
Diabetes Mellitus (DM)
Criteria Used Sensitivity Specificity PPV NPV
Youden's Index 4 years historical data with greater
then or equal to 1 outpatient OR greater then or equal to 1 inpatient 250%, 357% or 362% codes
0.97 0.97 0.91 0.99 0.94
4 years historical data with greater then or equal to 2 outpatient OR greater then or equal to1 inpatient 250%, 357% or 362% codes
0.98 0.94 0.92 0.98 0.92
4 years historical data with greater then or equal to 3 outpatient OR greater then or equal to1 inpatient 250%, 357% or 362% codes
0.98 0.93 0.92 0.98 0.91
2 years historical data with greater then or equal to1 outpatient OR greater then or equal to1 inpatient 250%, 357% or 362% code (note: HEDIS criteria)
0.98 0.93 0.93 0.98 0.91
2 years historical data with greater then or equal to 2 outpatient OR greater then or equal to1 inpatient 250%, 357% or 362% codes
0.98 0.90 0.94 0.97 0.88
2 years historical data with greater then or equal to 3 outpatient OR greater then or equal to1 inpatient 250%, 357% or 362% codes
0.98 0.85 0.94 0.96 0.84
Table 1: Diabetes -- Sensitivity, Specificity and Predictive Values of Algorithms to Identify Probable Diabetes in the Medicaid Study Group
Myocardial Infarction (MI)
graft (CABG)” did not improve our results (it is included here only for documentation purposes). (See Table 2)
Criteria Used Sensitivity Specificity PPV NPV
Youden's Index Greater then or equal to 1 inpatient
410.% code diagnosis in the past 4
years (note: HEDIS criteria) 0.99 0.24 0.67 0.97 0.23
Greater then or equal to 1 inpatient 410.% code diagnosis or CABG in the
past 4 years 0.99 0.24 0.67 0.97 0.23
Greater then or equal to 2 inpatient 410.% code diagnosis or CABG in the past 4 years
0.99 0.24 0.67 0.97 0.23
Greater then or equal to 3 inpatient 410.% code diagnosis or CABG in the
past 4 years 1.00 0.20 0.71 0.97 0.20
Greater then or equal to 1 inpatient 410.% code diagnosis or CABG in the
past 2 years 0.99 0.20 0.63 0.97 0.19
Greater then or equal to 2 inpatient 410.% codes diagnosis or CABG in
the past 2 years 0.99 0.20 0.63 0.97 0.19
greater then or equal to 3 inpatient 410.% codes diagnosis or CABG in the past 2 years
1.00 0.12 0.60 0.96 0.12
Table 2: Myocardial Infarction -- Sensitivity, Specificity and Predictive Values of Algorithms to Identify Probable Myocardial Infarction in the Medicaid Study Group
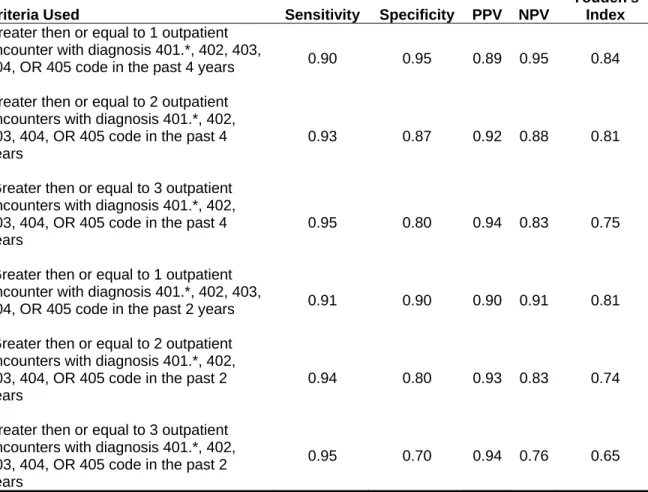
Hypertension (HTN)
Hypertension, like DM, was extremely prevalent in our patient population (294/601, 48.9%) and thus our statistical significance was adequate to make accurate evaluations of our generated rules. There have been many articles published on developing
algorithms did not include drug data in their final HTN code based detection algorithm. (See Table 3)
Criteria Used Sensitivity Specificity PPV NPV
Youden's Index Greater then or equal to 1 outpatient
encounter with diagnosis 401.*, 402, 403,
404, OR 405 code in the past 4 years 0.90 0.95 0.89 0.95 0.84
Greater then or equal to 2 outpatient encounters with diagnosis 401.*, 402, 403, 404, OR 405 code in the past 4 years
0.93 0.87 0.92 0.88 0.81
Greater then or equal to 3 outpatient encounters with diagnosis 401.*, 402, 403, 404, OR 405 code in the past 4 years
0.95 0.80 0.94 0.83 0.75
Greater then or equal to 1 outpatient encounter with diagnosis 401.*, 402, 403,
404, OR 405 code in the past 2 years 0.91 0.90 0.90 0.91 0.81
Greater then or equal to 2 outpatient encounters with diagnosis 401.*, 402, 403, 404, OR 405 code in the past 2 years
0.94 0.80 0.93 0.83 0.74
Greater then or equal to 3 outpatient encounters with diagnosis 401.*, 402, 403, 404, OR 405 code in the past 2 years
0.95 0.70 0.94 0.76 0.65
Table 3: Hypertension -- Sensitivity, Specificity and Predictive Values of Algorithms to Identify Probable Hypertension in the Medicaid Study Group
Cerebral Ischemia (Stroke)
The prevalence of Cerebral Ischemia in this population was extremely small (21/601, 3.5%) thus the significance of our results is questionable. However some insight can still be gained from our findings. We noticed that strokes are very frequently coded
(75%). After trying many variations of the AHRQ set (see bottom of Table 4), we found no benefit (i.e. increased PPV) to eliminating any of the AHRQ codes from the bundle (Research). (See Table 4)
Criteria Used Sensitivity Specificity PPV NPV
Youden's Index Greater then or equal to 1 inpatient
AHRQ* acute cerebral vascular disease
diagnosis code in the past 4 years 0.99 0.19 0.57 0.97 0.19
Greater then or equal to 2 inpatient AHRQ* acute cerebral vascular disease
diagnosis codes in the past 4 years 1.00 0.14 0.75 0.97 0.14
Greater then or equal to 3 inpatient AHRQ* acute cerebral vascular disease
diagnosis codes in the past 4 years 1.00 0.05 1.00 0.97 0.05
Greater then or equal to 1 inpatient AHRQ* acute cerebral vascular disease
diagnosis code in the past 2 years 1.00 0.19 0.67 0.97 0.19
Greater then or equal to 2 inpatient AHRQ* acute cerebral vascular disease
diagnosis codes in the past 2 years 1.00 0.09 1.00 0.97 0.09
Greater then or equal to 3 inpatient AHRQ* acute cerebral vascular disease diagnosis codes in the past 2 years
1.00 0.05 1.00 0.97 0.05
Table 4: Cerebral Ischemia (Stroke) --Sensitivity, Specificity and Predictive Values of Algorithms to Identify Probable Cerebral Ischemia in the Medicaid Study Group
*AHRQ acute cerebral disease codes: '346.60', '346.61', '346.62', '346.63', '433.01', '433.11', '433.21', '433.31', '433.81', '433.91', '434.0', '434.00', '434.01', '434.1', '434.10', '434.11', '434.9', '434.90', '434.91','433.10'
Obesity
Criteria Used Sensitivity Specificity PPV NPV
Youden's Index Greater then or equal to 1 diagnosis
V85.2-5 or 278% code(s) in the past 4
years 0.87 0.61 0.67 0.84 0.48
Greater then or equal to 2 diagnosis V85.2-5 or 278% code(s) in the past 4
years 0.93 0.44 0.72 0.79 0.36
Greater then or equal to 3 diagnosis V85.2-5 or 278% code(s) in the past 4
years 0.95 0.34 0.74 0.77 0.29
Greater then or equal to1 diagnosis V85.2-5 or 278% code(s) in the past 2
years 0.90 0.47 0.67 0.79 0.37
Greater then or equal to 2 diagnosis V85.2-5 or 278% code(s) in the past 2
years 0.94 0.33 0.73 0.76 0.28
Greater then or equal to 3 diagnosis V85.2-5 or 278% code(s) in the past 2 years
0.96 0.25 0.75 0.75 0.22
Table 5: Obesity --Sensitivity, Specificity and Predictive Values of Algorithms to Identify Probable Obesity in the Medicaid Study Group
Hyperlipidemia (HLD) (see Table 6)
HLD was similar to obesity in that it had a high prevalence (163/601, 27%) but lacked adequate positive predicative value (PPV). The code sets used for this algorithm were derived from an AHRQ bundle and a list of NDC codes corresponding to
Criteria Used Sensitivity Specificity PPV NPV
Youden' s Index Greater then or equal to 1 272.%
outpatient codes OR greater then or
equal to 1 HLD drug in past 4 years 0.91 0.82 0.77 0.93 0.73
Greater then or equal to 2 272.% outpatient codes OR greater then or
equal to 1 HLD drug in past 4 years 0.91 0.79 0.77 0.92 0.70
Greater then or equal to 3 272.% outpatient codes OR greater then or
equal to 1 HLD drug in past 4 years 0.91 0.75 0.76 0.91 0.67
Greater then or equal to 1 272.% outpatient codes OR greater then or
equal to 1 HLD drug in past 2 years 0.91 0.81 0.78 0.93 0.72
Greater then or equal to 2 272.% outpatient codes OR greater then or
equal to 1 HLD drug in past 2 years 0.91 0.78 0.77 0.92 0.69
Greater then or equal to 3 272.% outpatient codes OR greater then or
equal to 1 HLD drug in past 2 years 0.91 0.75 0.76 0.91 0.67
Greater then or equal to 1 272.% outpatient codes OR greater then or
equal to 2 0.72HLD drug in past 4 years 0.91 0.82 0.77 0.93 0.73
Greater then or equal to 2 272.% outpatient codes OR greater then or
equal to 2 HLD drug in past 4 years 0.91 0.80 0.77 0.92 0.71
Greater then or equal to 3 272.% outpatient codes OR greater then or
equal to 2 HLD drug in past 4 years 0.91 0.75 0.76 0.91 0.67
Greater then or equal to 1 272.% outpatient codes OR greater then or
equal to 2 HLD drug in past 2 years 0.91 0.81 0.78 0.93 0.72
Greater then or equal to 2 272.% outpatient codes OR greater then or
equal to 2 HLD drug in past 2 years 0.91 0.78 0.77 0.92 0.69
Greater then or equal to 3 272.% outpatient codes OR greater then or
equal to 2 HLD drug in past 2 years 0.91 0.75 0.76 0.91 0.67
Greater then or equal to 1 272.% outpatient codes OR greater then or
Greater then or equal to 2 272.% outpatient codes OR greater then or
equal to 3 HLD drug in past 4 years 0.91 0.80 0.77 0.92 0.71
Greater then or equal to 3 272.% outpatient codes OR greater then or
equal to 3 HLD drug in past 4 years 0.91 0.75 0.76 0.91 0.67
Greater then or equal to 1 272.% outpatient codes OR greater then or
equal to 3 HLD drug in past 2 years 0.91 0.81 0.78 0.93 0.72
Table 6: Hyperlipidemia --Sensitivity, Specificity and Predictive Values of Algorithms to Identify Probable Hyperlipidemia in the Medicaid Study Group
Depression
Criteria Used Sensitivity Specificity PPV NPV
Youden's Index 292.2%, 266.3%, 300.4% or 311%
with 1 or more outpatient or at least 1
inpatient in last 4 years 0.92 0.47 0.71 0.81 0.39
292.2%, 266.3%, 300.4% or 311% with 1 or more outpatient or at least 2
inpatient in last 4 years 0.94 0.43 0.74 0.80 0.37
292.2%, 266.3%, 300.4% or 311% with 2 or more outpatient or at least 1
inpatient in last 4 years 0.95 0.36 0.75 0.78 0.31
292.2%, 266.3%, 300.4% or 311% with 2 or more outpatient or at least 2
inpatient in last 4 years 0.97 0.30 0.79 0.77 0.26
292.2%, 266.3%, 300.4% or 311% with 3 or more outpatient or at least 1
inpatient in last 4 years 0.96 0.33 0.76 0.78 0.28
292.2%, 266.3%, 300.4% or 311% with 3 or more outpatient or at least 2
inpatient in last 4 years 0.98 0.26 0.82 0.76 0.23
292.2%, 266.3%, 300.4% or 311% with 1 or more outpatient or at least 1
inpatient in last 2 years 0.94 0.38 0.73 0.79 0.32
292.2%, 266.3%, 300.4% or 311% with 1 or more outpatient or at least 2
inpatient in last 2 years 0.95 0.31 0.71 0.77 0.26
292.2%, 266.3%, 300.4% or 311% with 2 or more outpatient or at least 1
inpatient in last 2 years 0.96 0.28 0.77 0.77 0.24
292.2%, 266.3%, 300.4% or 311% with 2 or more outpatient or at least 2
inpatient in last 2 years 0.97 0.21 0.76 0.75 0.18
292.2%, 266.3%, 300.4% or 311% with 3 or more outpatient or at least 1
inpatient in last 2 years 0.98 0.26 0.82 0.76 0.23
292.2%, 266.3%, 300.4% or 311% with 3 or more outpatient or at least 2 inpatient in last 2 years
0.98 0.17 0.81 0.74 0.15
Congestive Heart Failure (CHF)
CHF, like MI, suffered from low representation in our population under study (17/601), and also like MI, it lacked adequate code granularity to accurately detect the disease’s presence in our patient population. (See Table 8). The PPV range was 0.30 to 0.57, and thus none of our rule sets should be used for CDS.
Criteria Used Sensitivity Specificity PPV NPV
Youden's Index Greater then or equal to1 428.%
encounters in past 4 years
0.95 0.71 0.30 0.99 0.66
Greater then or equal to2 428.%
encounters in past 4 years 0.97 0.71 0.40 0.99 0.68
Greater then or equal to3 428.%
encounters in past 4 years 0.98 0.71 0.50 0.99 0.69
Greater then or equal to4 428.%
encounters in past 4 years 0.98 0.59 0.48 0.99 0.57
Greater then or equal to5 428.%
encounters in past 4 years 0.98 0.59 0.48 0.99 0.57
Greater then or equal to1 428.%
encounters in past 2 years 0.97 0.65 0.39 0.99 0.62
Greater then or equal to2 428.%
encounters in past 2 years 0.98 0.53 0.41 0.99 0.51
Greater then or equal to3 428.%
encounters in past 2 years 0.99 0.47 0.50 0.98 0.46
Greater then or equal to4 428.%
encounters in past 2 years 0.99 0.47 0.53 0.98 0.46
Greater then or equal to5 428.%
encounters in past 2 years 0.99 0.47 0.57 0.98 0.46
Chronic Obstructive Pulmonary Disease (COPD)
COPD prevalence in our population under study was only 4% (28/601). The PPV’s were similar throughout our entire rule set iterations, and with a max PPV of 64%, it is
unlikely that a purely code based algorithm could be used effectively in a COPD CDS system. Also of note: we decided not to use drug codes because of the overlap between asthma and COPD medications in adult populations.
Criteria Used Sensitivity Specificity PPV NPV
Youden's Index Greater then or equal to 1 493.2%, or
496% diagnoses in 4 year history 0.95 0.86 0.46 0.99 0.81
Greater then or equal to 2 493.2% or
496% diagnoses in 4 years history 0.97 0.82 0.56 0.99 0.79
Greater then or equal to 3 493.2% or
496% diagnoses in 4 year history 0.98 0.75 0.64 0.99 0.73
Greater then or equal to 1 493.2% or
496% diagnoses in 2 year history 0.95 0.86 0.46 0.99 0.81
Greater then or equal to 2 493.2% or
496% diagnoses in 2 year history 0.97 0.82 0.56 0.99 0.79
Greater then or equal to 3 493.2% or
496% diagnoses in 2 year history 0.98 0.75 0.64 0.99 0.73
Table 9: Chronic Obstructive Pulmonary Disease (COPD) --Sensitivity, Specificity and Predictive Values of Algorithms to Identify COPD in the Medicaid Study Group
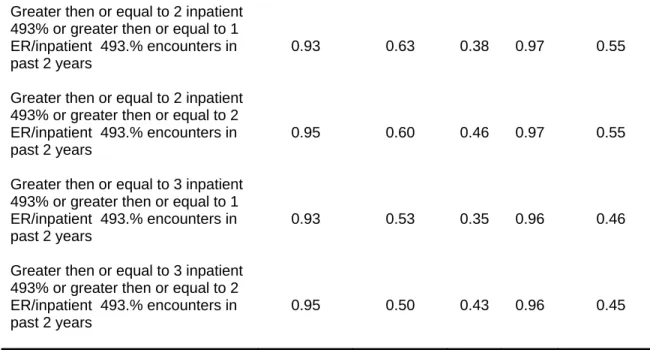
Persistent Asthma
we had used a purely pediatric patient population, the drug codes could have been included. Wakefield et. al. included drug codes in a similar pediatric study and found that including drug information did improve overall performance (Wakefield and Cloutier).
Criteria Used
Sensitivity Specificity PPV NPV Youden's Index Greater then or equal to 1 inpatient
493% or greater then or equal to1 ER/inpatient 493.% encounters in past 4 years
0.88 0.78 0.32 0.98 0.66
Greater then or equal to 1 inpatient 493% or greater then or equal to 2 ER/inpatient 493.% encounters in past 4 years
0.91 0.78 0.38 0.98 0.69
Greater then or equal to 2 inpatient 493% or greater then or equal to 1 ER/inpatient 493.% encounters in past 4 years
0.89 0.73 0.33 0.98 0.62
Greater then or equal to 2 inpatient 493% or greater then or equal to 2 ER/inpatient 493.% encounters in past 4 years
0.93 0.70 0.40 0.98 0.63
Greater then or equal to 3 inpatient 493% or greater then or equal to 1 ER/inpatient 493.% encounters in past 4 years
0.91 0.70 0.35 0.98 0.61
Greater then or equal to 3 inpatient 493% or greater then or equal to 2 ER/inpatient 493.% encounters in past 4 years
0.94 0.68 0.43 0.98 0.61
Greater then or equal to 1 inpatient 493% or greater then or equal to 1 ER/inpatient 493.% encounters in past 2 years
0.92 0.70 0.39 0.98 0.62
Greater then or equal to 1 inpatient 493% or greater then or equal to 2 ER/inpatient 493.% encounters in past 2 years
Greater then or equal to 2 inpatient 493% or greater then or equal to 1 ER/inpatient 493.% encounters in past 2 years
0.93 0.63 0.38 0.97 0.55
Greater then or equal to 2 inpatient 493% or greater then or equal to 2 ER/inpatient 493.% encounters in past 2 years
0.95 0.60 0.46 0.97 0.55
Greater then or equal to 3 inpatient 493% or greater then or equal to 1 ER/inpatient 493.% encounters in past 2 years
0.93 0.53 0.35 0.96 0.46
Greater then or equal to 3 inpatient 493% or greater then or equal to 2 ER/inpatient 493.% encounters in past 2 years
0.95 0.50 0.43 0.96 0.45
Table 10: Persistent Asthma--Sensitivity, Specificity and Predictive Values of Algorithms to Identify Persistent Asthma in the Medicaid Study Group
Discussion
The fact that only 2 of the 10 conditions studied could be detected accurately from code based data implies that 8 of our 10 clinical performance judgments must rely on manual patient chart audits by trained health care associates. As discussed previously, this is not a viable option, and more must be done to increase the accuracy of our machine-based disease detection methods. This might be accomplished in a number of ways, namely further refinement of these rule sets using machine learning (e.g. support vector machine), or more appropriately, adding further granularity to the ICD code set so that common chronic conditions can be coded unambiguously. However, both these
Limitations
Small sample testing may be a feasible and important part of validating administrative code based disease detection algorithms, but it is important to recognize that there were some significant limitations to our approach. First, small sample sizes limit the precision of our calculated PPV. One author estimated that it would take about 200 or so randomly selected chart audits per disease to achieve a 95% confidence interval around a PPV point estimate as narrow as +- 4% to 5% (Solberg et al.). Given our limited sample set, we could have only applied this confidence interval to our HTN cohort. Additional limitations resulting from our small sample set include the over performance of certain rules (see cerebral ischemia PPV of 1.00) and the under performance of others.
Conclusions
Our results also point to the need for greater granularity in our current disease coding schemas. Even though we exhausted all relevant codes for each disease studied, only two of the disease rule sets (HTN and DM) possessed adequate PPV’s for CDS. This
References
Adams, Karen, and Janet M. Corrigan. Priority Areas for National Action: Transforming Health Care Quality, 2003.
Bullano, M. F., et al. "Agreement between Administrative Claims and the Medical Record in Identifying Patients with a Diagnosis of Hypertension." Med Care 44.5 (2006): 486-90.
Cabana, M. D., et al. "Limits of the Hedis Criteria in Determining Asthma Severity for Children." Pediatrics 114.4 (2004): 1049-55.
Caetano, P. A., J. M. Lam, and S. G. Morgan. "Toward a Standard Definition and Measurement of Persistence with Drug Therapy: Examples from Research on Statin and Antihypertensive Utilization." Clinical therapeutics 28.9 (2006): 1411-24; discussion 10.
Contributors, Wikipedia "Positive Predictive Value." Wikipedia, the free encyclopedia, 2009.
Eisenstein, E. L., et al. "Assessing the Potential Economic Value of Health Information Technology Interventions in a Community-Based Health Network." AMIA ...Annual Symposium proceedings / AMIA Symposium.AMIA Symposium (2005): 221-25.
Health Level Seven, Inc. "Health Level 7 Home Page". Ann Arbor, 2009. <http://www.hl7.org/>.
Health, U. S. Department of, and Services Human. "Value-Driven Health Care Home [News Release]." Vol. 2008. Ed. Anonymous.
Hude Quan, Bing Li L. Duncan Saunders Gerry A. Parsons Carolyn I. Nilsson Arif Alibhai William A. Ghali. "Assessing Validity of Icd-9-Cm and Icd-10
Administrative Data in Recording Clinical Conditions in a Unique Dually Coded Database." Health Services Research 43.4 (2008): 1424-41.
IOM, Institute of Medicine. Crossing the Quality Chasm. Richard and Hinda Rosenthal Lectures. Ed. Anonymous. Washington, D.C.: National Academy Press, 2003. Kawamoto, K., et al. "Improving Clinical Practice Using Clinical Decision Support
Systems: A Systematic Review of Trials to Identify Features Critical to Success." BMJ 330.7494 (2005): 765.
Landon, B. E., et al. "Quality of Care in Medicaid Managed Care and Commercial Health Plans." Jama-Journal of the American Medical Association 298.14 (2007): 1674-81.
Lobach, D. F., et al. "Proactive Population Health Management in the Context of a Regional Health Information Exchange Using Standards-Based Decision Support." AMIA Annu Symp Proc (2007): 473-7.
Mainous, A. G., and J. Talbert. "Assessing Quality of Care Via Hedis 3.0 - Is There a Better Way?" Archives of Family Medicine 7.5 (1998): 410-13.
N. M. Mencke, L. G. Alley, and Etchason J. "Application of Hedis (R) Measures within a Veterans Affairs Medical Center."
NCQA. "Hedis and Quality Compass". 2003. webpage. What is HEDIS? : NCQA. 9/19 2008. <www.ncqa.org/tabid/187/Default.aspx>.
Pawlson, L. G., S. H. Scholle, and A. Powers. "Comparison of Administrative-Only Versus Administrative Plus Chart Review Data for Reporting Hedis Hybrid Measures." The American Journal of Managed Care 13.10 (2007): 553-58. Research, Agency for HealthCare Quality. "Hcup-Us Tools & Software Page". 2009.
<http://www.hcup-us.ahrq.gov/toolssoftware/ccs/ccs.jsp>.
Sidorov, J., et al. "Does Diabetes Disease Management Save Money and Improve Outcomes?" Diabetes Care 25.4 (2002): 684-89.
Solberg, L. I., et al. "Are Claims Data Accurate Enough to Identify Patients for Performance Measures or Quality Improvement? The Case of Diabetes, Heart Disease, and Depression." Am J Med Qual 21.4 (2006): 238-45.
Tang, P. C., et al. "Comparison of Methodologies for Calculating Quality Measures Based on Administrative Data Versus Clinical Data from an Electronic Health Record System: Implications for Performance Measures." J Am Med Inform Assoc 14.1 (2007): 10-5.
Treadwell, R., and J. Treadwell. "Hedis, What Is It? What Does It Mean to Me? How Does It Affect My Practice?" Missouri medicine 92.7 (1995): 330-31.