Sharif University of Technology
Scientia IranicaTransactions D: Computer Science & Engineering and Electrical Engineering http://scientiairanica.sharif.edu
A less-eort method for spatial network planning
M.R. Habibi
a, M. Rashidinejad
b;, A. Hajebrahimi
a, and A. Abdollahi
b a. Department of Electrical Engineering, Kerman Graduate University of Technology, Kerman, Iran.b. Department of Electrical Engineering, Shahid Bahonar University of Kerman, Kerman, Iran. Received 23 June 2015; received in revised form 2 June 2016; accepted 29 October 2016
KEYWORDS Geographical Information System (GIS);
Spatial network planning; Transmission expansion planning; Transmission line routing.
Abstract. This paper presents a method to solve Spatial Network Planning (SNP) in power systems expansion. SNP is an integration of Transmission Expansion Planning (TEP) and optimal line routing problems. In fact, SNP considers the impacts of lines routing on the network power ow. Therefore, it can exploit such impacts to attain a signicant techno-economic solution. In this work, a preprocessing stage is employed to reduce the computational eort demanded by line routing. Furthermore, a meta-heuristic algorithm is engaged to solve such a complicated problem. Applying these modications made it possible to solve SNP for large-scale systems with high-resolution rasterized maps. The proposed method is applied to a 3-bus system, an 18-bus test system as well as the original and modied versions of the IRAN southeast high-voltage transmission network to demonstrate the capability of the proposed methodology.
© 2018 Sharif University of Technology. All rights reserved.
1. Introduction
Transmission Expansion Planning (TEP) is an essential issue in the development of power systems. TEP problem oers the most economic expansion plan for transmission lines, while this plan must be capable of facilitating the forecasted future load as well as future generation patterns [1-3]. A comprehensive review of this problem is provided in [4].
A route of a transmission line has a signicant inuence on line reactance as well as construction costs. These are two important parameters in a TEP concerning power ow study. In recent years, the optimal line routing problem has been investigated to nd the most economical route for a power line [5,6],
*. Corresponding author.
E-mail addresses: [email protected] (M.R. Habibi); [email protected] (M. Rashidinejad); [email protected] (A. Hajebrahimi);
[email protected] (A. Abdollahi) doi: 10.24200/sci.2017.4486
where a general model for overhead line routing is presented in [7]. This model uses the satellite images to identify environmental constraints while evaluating transmission line investment. In fact, the model employs the developing image-processing methods for such an application. West et al. [8] presents a dis-tribution line routing method for rural areas, where it divides the studied area into dierent cost regions. The practical obstacles are modeled as innite cost regions and they are modied in [9] using Geographical Information System (GIS). In fact, GIS is a proper tool for transmission line routing [10,11]. In the early literature of power line routing, vector GIS maps are employed to describe environmental elements. A vector map describes multifarious regions and infrastructures by irregular points, lines and polygons, which impose some diculties on optimal line routing problem [12]. Reference [13] describes a method to convert a GIS vector map into a rasterized map which is a regular grid of cells where each cell represents properties of a geographical position. GIS rasterized map is adopted in [5,6,12] as a state-of-the-art model for GIS mapping.
Other recent studies are focused on more accurate cost evaluation of line routes. Summarily, most researchers in this eld are trying to optimize the equipment in-stallation and maintenance costs subject to geographic, environmental, social, and legal constraints [6].
In the most traditional view, the optimal routes of candidate lines are specied before solving TEP. Therefore, the construction costs and their reactance are kept as constants [14-18]. However, the interaction of TEP with optimal routing of these lines is considered in three dierent studies as follows:
Interaction with substation placing problem. An interaction between these two problems is modeled in the studies dealing with simultaneous TEP and substation placing [19]. In this case, the route of new lines connected to unconstructed substations should be evaluated during the optimization process and cannot be determined before solving TEP.
Interaction with power-line technology selec-tion. One model of TEP presented in [20] refers to the dependency of line routing on technology selection of new lines. For example, the optimal route of a line is inuenced by the decision of constructing overhead lines or underground cables as well as using HVAC or HVDC technology.
The Spatial Network Planning (SNP). This model of TEP problem is presented in [12]. SNP considers a modication of the candidate line routes as an option to inuence network power ows. This may help diminish power ow violations and lead to the expansion that is more economical [12]. Shu et al. [21] presents SNP considering generation expansion planning. In [22] some other aspects of power system expansion such as substation placement and sizing, as well as the line type selection, are added to SNP problem while it considers operation costs and uses an AC power ow.
The SNP is solved in [12] via a very complex non-linear programming formulation. Although [12,21,22] illustrate a good framework for SNP problem, the main drawback of such a formulation is that the number of variables and constraints will increase dramatically especially when a high-resolution rasterized map is considered. Therefore, the computational complexities as well as computational eort of such modeling may restrict its usage only for poor-resolution GIS rasterized maps.
Here, a method is proposed to solve the most basic model of SNP problem (i.e. presented in [12]). It employs a preprocessing stage to reduce the com-putational eort required to handle line routing sub-problems. The output of this pre-processing stage
illustrates the optimal construction costs of each circuit as a function of its desired reactance. Using such a preprocessing stage is indispensable to handling power line routing sub-problems; otherwise, the evaluation of a single-trial solution may take hours in a system with high-resolution rasterized maps. Moreover, a meta-heuristic method has been developed to solve such a complicated problem.
The rest of this paper is organized as follows: In Section 2, the proposed SNP mathematical mod-eling is introduced. Section 3 describes the proposed methodology to provide line routing preprocessed data. The developed solution algorithm for SNP problem is presented in Sections 4. Numerical case studies are provided in Section 5. Finally, Section 6 is devoted to concluding remarks.
2. Mathematical modeling problem
Here, a new formulation for Spatial Network Planning (SNP) problem has been developed. The SNP is an integration of TEP and optimal line routing, while its goal is to nd the optimal network expansion plan as well as the optimal route of new lines in order to satisfy the operation constraints with less investment costs. The operational constraints are formulated based on DC Power Flow (DCPF) model. A reformulation is also performed to facilitate the model to be able to employ pre-processed data.
2.1. SNP mathematical framework
Jun et al. [12] proposed the objective function of SNP as:
v = min Nc
k=1p2Mp2N(p) 0:5k(p; p)D(p; p)Bk(p);
(1) N(p) =fpjp(X(p) X(p))2+ (Y (p) Y (p))2
p2w; p 6= pg: (2)
Therefore, 8 neighbours for each cell can be dened. The binary variables k(p; p) (known as direction
variables) represent decision variables whether circuit k has passed through both neighbor cells p and p or not. D(p; p) is the Euclidean distance between p and p:
D(p; p) = p
(X(p) X(p))2+(Y (p) Y (p))2+(H(p) H(p))2:
(3) If a line element connects two neighbor cells, then half of the line element will be in one cell and the other half will be in the other cell, where parameter 0:5 is included in Eq. (1). In [12], the following restrictions are considered to limit the direction variables:
Non-terminal points: If p is a non-terminal point of candidate circuit k (i.e., circuit k does not start from or end to point p), circuit k may or may not cross point p. If a circuit does not cross point p then binary variables, k(p; p), are equal to zero for
all p 2 N(p). Otherwise, circuit k crosses point p and two of its neighbors. Therefore, the value of p2N(p) k(p; p) equals 0 or 2;
Terminal points: If p is a terminal point of circuit k, then p2N(p) k(p; p) equals 1. Otherwise the value
of p2N(p) k(p; p) is equal to 0;
Decision variables k(p; p) and k(p; p) are equal for
each two-neighbor cells;
Power lines, routes must be without any loop; A power line route must not pass through avoidance
areas. Avoidance areas are prohibited to construct transmission lines such as farms, ranges, forests, wetlands, wild life lodging, military zones, etc.; If candidate circuit k is not constructed, then all
k(p; p) variables are zero.
In this formulation, the possible route of circuit k can be represented as a set of k variables, satisfying
the aforementioned restrictions. If k = fk(p; p) : p 2
M; p 2 N(p)g is a possible route for circuit k, then: p2Mp2N(p) 0:5k(p; p)D(p; p)Bk(p)=ykcl(fkg);
(4) where yk is equal to 1 if circuit k is constructed, and 0
otherwise.
2.2. SNP reformulation
The left side of Eq. (4) is equal to construction costs of circuit k if circuit k is decided to be constructed and otherwise it is equal to 0. Therefore, the objective function of SNP in Eq. (1) is rewritten as:
v = min Nc
k=1yk ck(k): (5)
Dening nijas the number of circuits to be constructed
in the right-of-way i j, Eq. (5) is rewritten as Eq. (6). All the candidate circuits in the same right-of-way are assumed to have similar properties:
v = min (i;j)2nijcij(ij): (6)
The constraints of the proposed formulation are as follows:
Nodal power balance. The following equality con-straint represents the conservation of active power at each node:
Pg(i) Pd(i) = (i;j)2ifij: (7)
Transmission line power ow limit. This in-equality constraint is applied to limit the power ow of each transmission line:
jfijj (n0ij+ nij) fij: (8)
This work employs a DCPF model; therefore, power ow through line i j is calculated using Eq. (9).
fij =(n 0 ij+ nij)
xij (i j): (9)
Due to the impacts of line route on its reactance, Eq. (9) is written as follows:
fij =(n 0 ij+ nij)
xij(ij) (i j): (10)
The right-of-ways with the already existing power circuits are assumed with a pre-dened route; so the value of xij for the existing lines is kept constant.
Right-of-way limitation. The number of circuits that can be installed in each right-of-way is limited by:
0 nij nij: (11)
Interconnectivity. Here, the interconnectivity of a network is considered.
Based on the aforementioned equations, SNP problem can be written as follows:
v = min (i;j)2nij cij(ij); (12)
subject to:
jfijj (n0ij+ nij) fij; (12a)
fij =(n 0 ij+ nij)
xij(ij) (i j); (12b)
Pg(i) Pd(i) = (i;j)2ifij; (12c)
0 nij nij; (12d)
Interconnectivity: (12e)
Considering r
ij; r = 1; : : : ; Rij as dierent candidate
routes in the right-of-way i j, ij can be written as:
ij := f(x; c) : x = xij(rij); c = cij(rij);
r = 1; : : : ; Rijg: (13)
Based on Eq. (13), SNP mathematical framework is presented as:
subject to:
jfijj (n0ij+ nij) fij; (14a)
fij =(n 0 ij+ nij)
xij (i j); (14b)
(xij; cij) 2 ij; (14c)
Pg(i) Pd(i) = (i;j)2ifij; (14d)
0 nij nij; (14e)
Interconnectivity: (14f)
It is noted that ijsets are obtained from the following
pre-processing stage.
3. The line routing preprocessing stage
In this section, for the sake of simplicity, three following denitions are provided.
Denition 1. A \unit transmission line" is dened as a ctitious type of transmission line having unit construction costs in a typical environment.
Denition 2. A \least cost route" between points p1 and p2 is the cheapest route between these two
points. Considering the least cost route between these two points, the length and construction costs of a unit transmission line are denoted by lLC(p
1; p2) and
cu(p
1; p2), respectively.
Suppose that the same type line is selected for right-of-way i j with the least cost route between two points p1 and p2. Eqs. (15) and (16) dene the
construction cost and reactance of each circuit of such a line:
cLC
ij (p1; p2) = cij cu(p1; p2); (15)
xLC
ij (p1; p2) = xij lLC(p1; p2): (16)
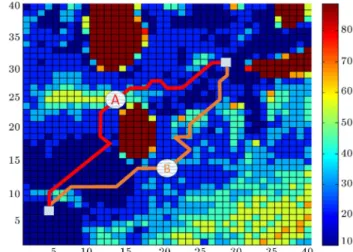
Denition 3. \A route with one degree of obliga-tion" between points p1and p2with obligation point p
is the cheapest route to construct a power line between two points p1and p2while it has to pass through point
p. Such a route is composed of two parts: a least cost route between points p1 and p and a least cost route
between points p and p2. In this work, the candidate
routes are selected among this kind of routes. Figure 1 shows two sample routes between points p1and p2with
dierent obligation points (A and B). For example, the route with obligation point A is composed of two parts: one between p1and A and the other between A and p2.
This denition helps to have a set of candidate routes
Figure 1. Sample routes with dierent obligation points A and B.
whose their lengths as well as construction costs can be calculated easily in the pre-processing stage.
Considering p as an obligation point, the reac-tance and construction costs of a circuit in right-of-way i j are calculated by Eqs. (18) and (20), respectively: cij(p) = cLCij (pbusi ; p) + cLCij (pbusj ; p); (17)
cij(p) = cij (cu(pbusi ; p) + cu(pbusj ; p)); (18)
xij(p) = xLCij (pbusi ; p) + xLCij (pbusj ; p); (19)
xij(p) = xij (lLC(pbusi ; p) + lLC(pbusj ; p)): (20)
Denition 4. The reactance class of a route with obligation point p for right-of-way i j is dened as:
$
xij(p)
xLC
ij (pbusi ; pbusj ) m
% ;
where bc denotes a oor function. The proper value of m as a constant can be advised empirically (0 < m < 1). Between various routes of a specied right-of-way with the same reactance class, the cheapest one is preferred. This classication helps to remove candidate routes with close values of reactances. A too small value of m may cause a large number of candidate routes. Some of those routes might not be acceptable due to cheaper routes with almost the same reactance. In contrast, a very large value of m will result in losing some acceptable candidate routes. To obtain ij sets,
the reactance and construction costs of line i j for various possible routes should be calculated and stored using the following steps:
Step 1. Calculate cu(pbus
i ; p) and lLC(pbusi ; p)) for
each bus i and each point p 2 M based on well-known Dijkstra's algorithm [23,24].
Step 2. For each (i; j) 2 C, only one route denoted
by ij can be considered as an option:
ij = f(xij(ij); cij(ij)g; 8(i; j) 2 C:
Step 3. For each (i; j) 2 C, do Steps 4 to 6.
Step 4. For each point p 2 M, do Steps 5 and 6. Step 5. Consider p as the obligation point of ij .
Calculate xij(p) and cij(p).
Step 6. Add (xij(p); cij(p)) to set ij. If there is
another (x; c) 2 ij in the same reactance class, then
keep the cheaper one and remove the more expensive alternative.
4. The proposed algorithm to solve SNP problem
Any meta-heuristic method can be modied to solve the proposed model, such as those presented in [3,25]. The key aspects of implementing a meta-heuristic tech-nique are coding and evaluating solutions. The coding refers to representing a candidate solution in the search space. Moreover, the algorithm denes a scheme to handle infeasible solutions and calculate the objective function. The encoding is similar to the ones employed by most genetic algorithm implementations [26-28]. The major dierence is the meaning of each element in the coding vector. Elements of the coding vector indicate the candidate route selected for each right-of-way as well as the number of transmission lines added in the route.
In the beginning, the algorithm performs the pre-processing stage described in Section 3 for once. Having the pre-processed data (i.e., ij), the objective
function can be calculated for each candidate solution. To evaluate a candidate solution, rst, simply read the values of (xij; cij) 2 ij according to the selected
candidate path for each right-of-way. In order to check the feasibility of a solution, a DCPF should perform and check the line overows Relation (14a) as well as
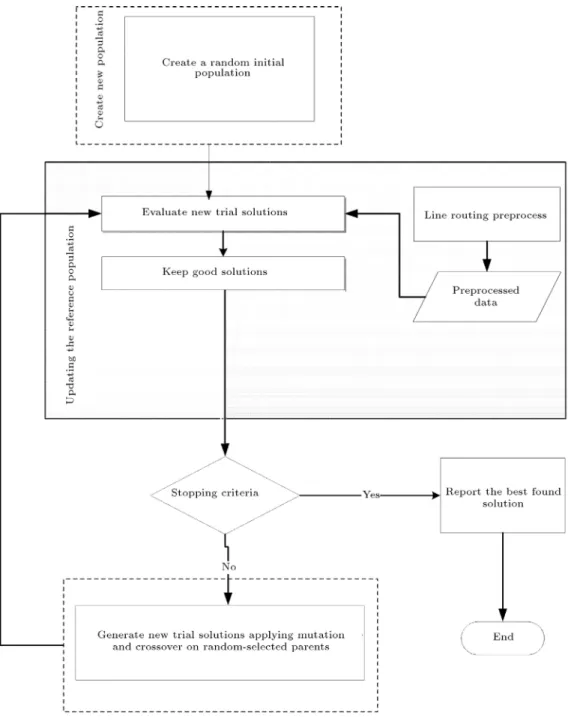
the number of added line limits Relation (14e) and network interconnectivity Relation (14f). Most of the meta-heuristic techniques can be adopted to use such coding and evaluation scheme. In the present case, minor changes were applied to the algorithm presented in [29] to solve the proposed expansion problem as it is illustrated in Figure 2.
5. Case studies
In this section, the proposed methodology is applied to four case studies. The rst test case is a 3-bus test sys-tem on which the concept of the proposed methodology is explained via a numerical example. The second case is the 18-bus test system to compare the performance and eectiveness of the proposed methodology with those of [12]. In addition, the original and modied versions of 51-bus southeast network of Iran are studied as practical systems.
5.1. 3-bus test system
This case study is performed to explain the proposed methodology via a numerical study. Figure 3 shows the topology of the considered 3-bus system. System data are provided in Tables 1 and 2.
The GIS data of this system are presented by a 15 15 rasterized map where each cell represents a 10 km10 km area. Figure 4 shows the cost map of this system, where blue cells represent typical environment and cost factor in pink-colored areas is 3. The altitudes of all cells are assumed identical. Employing Dijkstra's algorithm, the values of cu(pbus
i ; p) and lLC(pbusi ; p) are
obtained as in Figure 5. Using Relations (8) and (20), the values of c1 2(p) and x1 2(p) are obtained for each
point of the map as in Figure 6.
Figure 7 illustrates dierent values of (x1 2(p) ,
c1 2(p)).
Considering the least-cost route for lines 1-2, cost and reactance of any additional circuit would be 27 M$ and 13.5 p.u, respectively. Therefore, using the classical TEP formulation, the optimal solution results in an investment of 54 M$, consisting of adding two
Table 1. Generations and loads of 3-bus test system. Bus Generation
(MW)
Load
(MW) X coordination Y coordination
1 100 0 2 2
2 0 100 14 2
3 0 0 N/A N/A
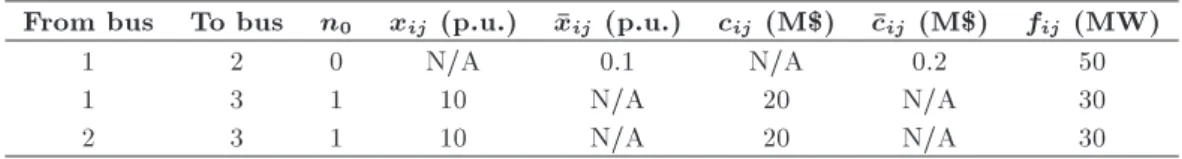
Table 2. Circuit data of 3-bus test system.
From bus To bus n0 xij (p.u.) xij (p.u.) cij (M$) cij (M$) fij (MW)
1 2 0 N/A 0.1 N/A 0.2 50
1 3 1 10 N/A 20 N/A 30
Figure 2. The proposed algorithm to solve SNP problem.
transmission lines in the right-of-way 1-2. Figure 8 shows the optimal topology with the corresponding active power ow distribution.
Now, consider another option for lines 1-2 which c1 2 = 32 M$ and x1 2 = 12 p.u. As depicted in
Figure 9, in this case, the addition of a single line in right-of-way 1-2 is sucient and the resulting cost is 32 M$. It can be observed that the least-cost route is not always optimum.
As observed in this case study, the proposed methodology results in a dierent network topology as compared to the classical model. As discussed in the previous sections, the line-routing problem can inuence the optimal transmission network topology.
The proposed model may obtain routes that are more expensive, but it can lower the overall expansion costs. Having understood the dierences brought about by considering line routing sub-problem, the next task is to evaluate the eectiveness and performance of the proposed methodology.
5.2. The 18-bus test system
In this case study, performance and eectiveness of the proposed methodology are compared with those of [12]. The system includes 18 busses, 28 right-of-ways for addition of new circuits with 35870 MW demand for the base topology. The GIS data of this system are presented by a 4040 rasterized map. The system data
Figure 3. Single diagram of the three-bus system.
Figure 4. Cost map of the 3-bus system.
Figure 5. The results of Dijkstra's algorithm.
Figure 6. Cost and reactance of a circuit in line 1-2 as functions of obligation point.
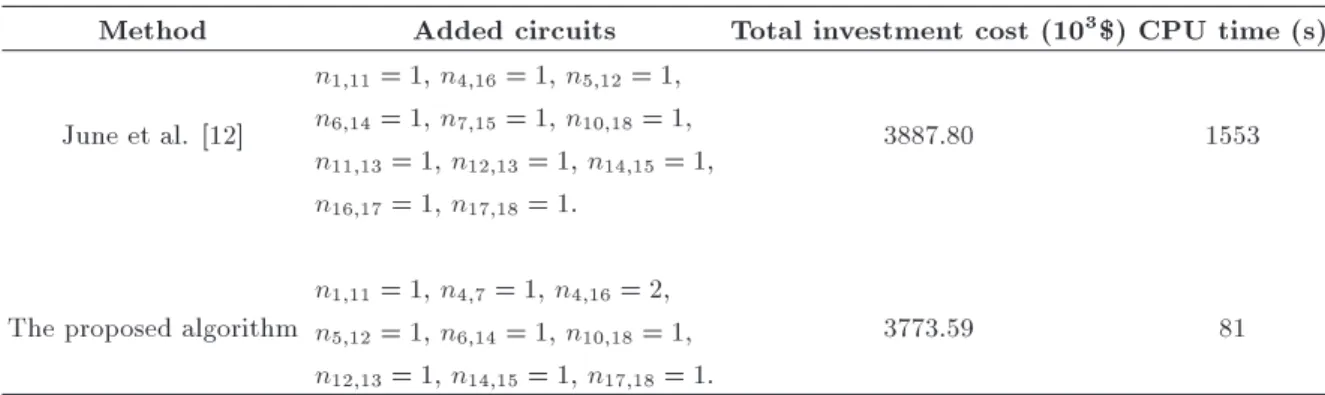
can be found in [12,30]. Table 3 compares the obtained results with those of [12]. It can be seen through numerical results that the proposed algorithm nds a more economical solution with less computational eort.
As illustrated in Table 4 and Figure 10, the route of line 4-16 is modied to help diminish power ow violations. Figure 11 illustrates the relation between the desired reactance and the construction cost of this line. This gure shows that a signicant change in the line reactance can be obtained at rather little extra cost. Similar to the 3-bus system, the planner can choose between short routes through high-cost lands and long routes through low-cost areas. Despite the 3-bus system, in this case, the optimization problem tends to choose a longer route for lines 4-6 to increase the reactance of this line. As it can be observed in this
Figure 7. The obtained relation between construction cost and desired reactance of line 1-2.
Figure 8. Optimal topology obtained with classical methodology.
Figure 9. Optimal topology obtained with the proposed methodology.
Table 3. The obtained optimal solution for 18-bus system.
Method Added circuits Total investment cost (103$) CPU time (s)
June et al. [12]
n1;11= 1, n4;16= 1, n5;12= 1,
n6;14= 1, n7;15= 1, n10;18= 1,
n11;13= 1, n12;13= 1, n14;15= 1,
n16;17= 1, n17;18= 1.
3887.80 1553
The proposed algorithm
n1;11= 1, n4;7= 1, n4;16= 2,
n5;12= 1, n6;14= 1, n10;18= 1,
n12;13= 1, n14;15= 1, n17;18= 1.
3773.59 81
Table 4. The optimal routes for candidate lines.
Line Route xij
xLC
ij (pbusi ;pbusj )
cij
cLC
ij (pbusi ;pbusj )
1-11 The least cost route 1 1
4-7 The least cost route 1 1
4-16 With obligation point (36,19) 1.779 1.168
5-12 The least cost route 1 1
6-14 The least cost route 1 1
10-18 The least cost route 1 1
12-13 The least cost route 1 1
14-15 The least cost route 1 1
17-18 The least cost route 1 1
Figure 10. The optimal result for 18-bus test system: (a) Accompanied with cost map, and (b) accompanied with altitude map.
case study, choosing the least cost routes is expected for most of the power lines. However, modication of power line routes is a useful option in some cases. 5.3. 51 buses belonging to southeast network
of Iran
In this section, the proposed method is applied to the southeast network of Iran. This case study is performed to demonstrate the ability of the proposed algorithm to handle practical power systems with
high-resolution GIS rasterized maps. This system has 51 buses, 91 right-of-ways, and a total demand of 10268 MW. The base year topology is 2010 and the expansion is targeted for the year 2016. Single-line diagram of southeast network of Iran is illustrated in Figure 12. The GIS data of this system are presented by a 1067 1344 rasterized map. The presented rasterized map covers a 1000:75 km 1245:38 km area. Data of this system are provided in [31]. By applying the proposed algorithm to southeast network of Iran,
the optimal solution is obtained as in Table 5 and Figure 13.
All optimal routes consist of the least cost routes, meaning that, in this case, the optimal solution of
Figure 11. The construction cost of line 4-16 as a function of its desired reactance in 18-bus test system.
SNP is the same as that of traditional TEP problem. The reason is that the environment in this case is not complicated enough. Such non-complexity can be implied by the simple relations between construction costs and desired values for reactance of power lines (see Figure 14 as an example). In such a case, a considerable modication in a power line reactance entails a rather large extra cost.
5.4. Modied version of southeast network of Iran
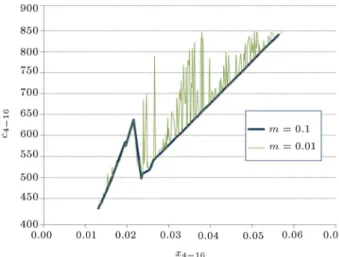
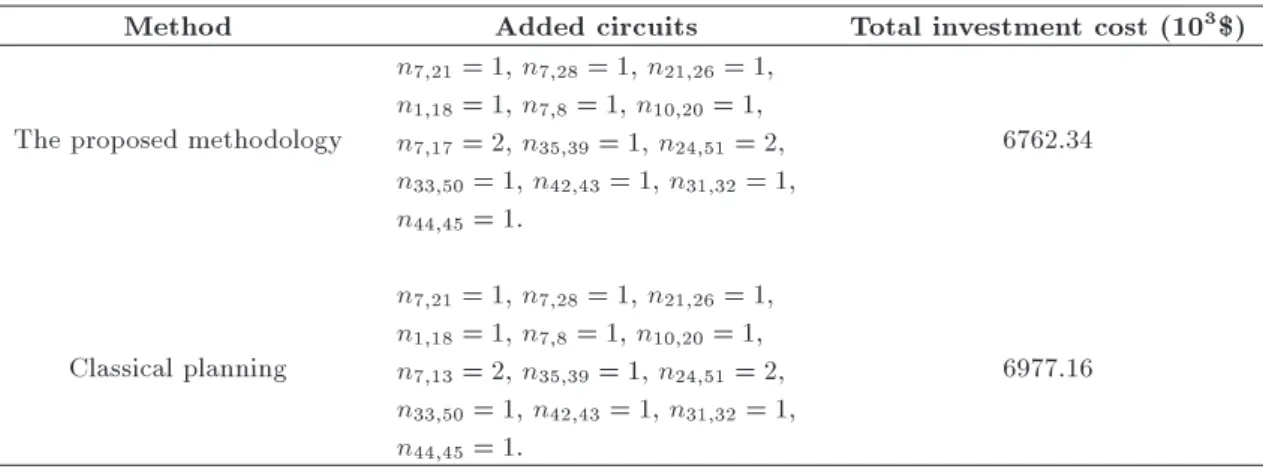
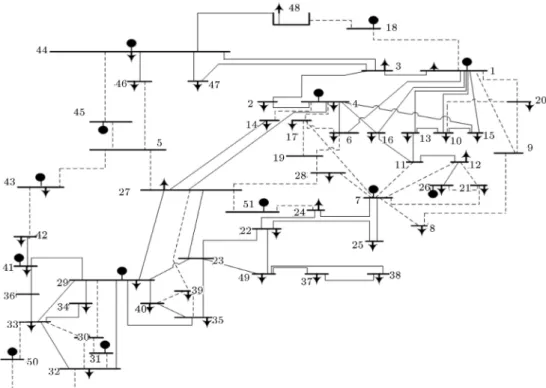
As depicted in Figure 15, the southeast network of Iran is modied in this case study. The applied modications are: adding 300 MWs of load on bus 17 and 300 MWs of generation on bus 7, adding two constructed lines in the right-of-ways 4-17 and 6-17 in the base topology, and to candidate the right-of-way 7-17. The modied data are provided in [31]. By applying these modications, the optimal solution is obtained as in Table 6.
As illustrated in Table 7 and Figure 16, the obligation point of (879; 930) is chosen for routes of
Figure 12. Single diagram of Iran southeast Network. Table 5. The obtained optimal solution for Iran southeast network.
Added circuits Total investment cost (103$)
CPU time (s) n7;21= 1, n7;28= 1, n21;26= 1,
n1;18= 1, n7;8= 1, n10;20= 1,
n35;39= 1, n24;51= 2, n33;50= 1,
n42;43= 1, n31;32= 1, n44;45= 1.
Figure 13. The optimal result for 51-bus test system: (a) Accompanied with cost map and (b) accompanied with altitude map. White colour indicates avoidance areas.
lines 7-17. This results in a less-expensive solution in comparison with classical planning. In this case study, constructing a line in right-of-way 7-17 is a relatively less expensive option to satisfy operational constraints.
Figure 14. The construction cost of line 7-21 as a function of its desired reactance in southeast Network.
Therefore, the algorithm decreases its reactance to pass more power ow through this line.
In fact, this test system is intentionally modied to show the eectiveness of the algorithm. In order to investigate this eectiveness, it is necessary to perform various studies on real systems. However, it can be seen that in some cases, modication of line routes is a useful option to obtain more-optimum solutions. 6. Conclusion
This paper elaborates on a methodology to solve Spa-tial Network Planning (SNP). The main modications and innovations of this work are as follows:
Providing a new formulation for SNP problem, where the proposed formulation makes it possible to handle line routing sub-problem using pre-processed data;
Providing pre-processed data based on optimal line routing. The proposed methodology employs a pre-processing stage to reduce the computational eort of line routing sub-problem;
Table 6. The obtained optimal solution for the modied version of Iran southeast network.
Method Added circuits Total investment cost (103$)
The proposed methodology
n7;21= 1, n7;28= 1, n21;26= 1,
n1;18= 1, n7;8= 1, n10;20= 1,
n7;17= 2, n35;39= 1, n24;51= 2,
n33;50= 1, n42;43= 1, n31;32= 1,
n44;45= 1.
6762.34
Classical planning
n7;21= 1, n7;28= 1, n21;26= 1,
n1;18= 1, n7;8= 1, n10;20= 1,
n7;13= 2, n35;39= 1, n24;51= 2,
n33;50= 1, n42;43= 1, n31;32= 1,
n44;45= 1.
Figure 15. Single diagram of the modied version of Iran southeast network.
Figure 16. The optimal result for the modied version of 51-bus test system: (a) Accompanied with cost map and (b) accompanied with altitude map. White colour indicates avoidance areas.
Table 7. The optimal routes for candidate lines.
Line Route xij
xLC
ij (pbusi ;pbusj )
cij
cLC
ij (pbusi ;pbusj )
7-21 The least cost route 1 1
7-28 The least cost route 1 1
21-26 The least cost route 1 1
1-18 The least cost route 1 1
7-8 The least cost route 1 1
10-20 The least cost route 1 1
7-17 With obligation point (879,930) 0.783 1.43
35-39 The least cost route 1 1
24-51 The least cost route 1 1
33-50 The least cost route 1 1
42-43 The least cost route 1 1
31-32 The least cost route 1 1
Employing a meta-heuristic procedure to solve such a problem is studied. The proposed methodology avoids using classical optimization methods (e.g. linear programming) to solve the SNP problem. Here a modication in the algorithm is easier, and this can simplify the future research studies in this area.
The results obtained from test systems illustrate the eectiveness of the proposed framework. It is observed through numerical studies that the proposed algorithm is able to solve the SNP problem even for large and complex systems with high-resolution GIS rasterized maps. In the following, limitations of the proposed methodology and ideas to improve this work are discussed:
In this work, a route is considered as an integra-tion of vertical, horizontal, and diagonal elements. Therefore, the length of a route can be overesti-mated due to triangular inequality. More advanced line routing methods can improve the accuracy of the model. Considering a larger neighborhood can provide elements in various directions to enhance the eectiveness of the model;
Locating new substations should be considered in TEP problem. Therefore integration of SNP with substation expansion planning problem is suggested for future studies;
The proposed algorithm solves a single-stage DC problem that neglects various aspects of TEP prob-lem including reactive power ows, voltage varia-tions, stability, etc. Therefore, modication of the proposed method to solve an extended SNP problem is suggested, considering multi-objective planning models, uncertain models, multistage planning, etc.; In most cases, the land costs of each point cannot be easily evaluated. Therefore, new probabilistic models are needed to deal with incomplete and inaccurate GIS data;
In this work, candidate routes are chosen among those with one degree of obligation. Considering a wider range of routes, which may improve the method, is suggested.
Nomenclature Indices
i Index for a bus
j Index for a bus
k Index for a circuit
Sets
The set of all right-of-ways
C The set of right-of-ways containing
already constructed circuits
U The set of candidate right-of-ways not
belonging to C
i The set of right-of-ways connected to
bus i
ij The set of pre-processed data for
right-of-way i j
M The set of all center points of cells in
the rasterized map
N(p) The set of all neighbor points of p Variables
ij The route of line i j
r
ij The rth candidate route in right-of-way
i j
k(p; p0) The binary variable represents the
decision whether circuit k has passed through both neighbour cells p and p0
or not
i Phase angle at bus i
cij(p) The investment cost of one circuit
in right-of-way i j in a route with obligation point p
cij The investment cost of one circuit in
right-of-way i j cLC
ij (pi; pj) The construction cost of a line with the
same type considered for right-of-way i j in the least-cost route between two points pi and pj
D(pi; pj) Euclidean distance between pi and pj
fij Active power ow through line i j
lLC(p
i; pj) Length of the least-cost route between
two points pi and pj
nij The number of circuits added to
right-of-way i j
v The objective function value of spatial
network planning problem xij(p) Reactance of one circuit in right
-of-way i j in a route with obligation point p
xLC
ij (pi; pj) Reactance of one circuit with the same
type considered for right-of- way i j in the least-cost route between two points pi and pj.
yk Decision variable of circuit k
construction. References
1. Romero, R., Rider, M.J., and Silva, I.D.J. \A meta-heuristic to solve the transmission expansion
plan-ning", Power Systems, IEEE Transactions on, 22, pp. 2289-2291 (2007).
2. Faria, H. Jr., Binato, S., Resende, M.G.C., and Falcao, D.M. \Power transmission network design by greedy randomized adaptive path relinking", Power Systems, IEEE Transactions on, 20, pp. 43-49 (2005).
3. Sum-Im, T., Taylor, G., Irving, M., and Song, Y.
\Dierential evolution algorithm for static and multi-stage transmission expansion planning", Generation, Transmission & Distribution, IET, 3, pp. 365-384 (2009).
4. Hemmati, R., Hooshmand, R.A., and
Khod-abakhshian, A. \Comprehensive review of generation and transmission expansion planning", Generation, Transmission & Distribution, IET, 7, pp. 955-964 (2013).
5. Yongfu, L., Qing, Y., Wenxia, S., Jiaqi, L., and Tao, Y. \Optimization of transmission-line route based on lightning incidence reported by the lightning location system", Power Delivery, IEEE Transactions on, 28, pp. 1460-1468 (2013).
6. Monteiro, C., Ramirez-Rosado, I.J., Miranda, V.,
Zorzano-Santamaria, P.J., Garcia-Garrido, E., and Fernandez-Jimenez, L.A. \GIS spatial analysis applied to electric line routing optimization", Power Delivery, IEEE Transactions on, 20, pp. 934-942 (2005).
7. Vega, M. and Sarmiento, H.G. \Image processing
application maps optimal transmission routes", Com-puter Applications in Power, IEEE, 9, pp. 47-51 (1996).
8. West, N., Dwolatzky, B., and Meyer, A. \Terrain based routing of distribution cables", Computer Applications in Power, IEEE, 10, pp. 42-46 (1997).
9. Luchmaya, A., Dwolatzky, B., and Meyer, A. \Using terrain information in an electrication planning tool", in Transmission and Distribution Conference and Ex-position, 2001 IEEE/PES, pp. 456-460 (2001).
10. Sumic, Z., Venkata, S., and Pistorese, T. \Automated underground residential distribution design. I. Concep-tual design", Power Delivery, IEEE Transactions on, 8, pp. 637-643 (1993).
11. Sumic, Z., Pistorese, T., Males-Sumic, H., and
Venkata, S. \Automated underground residential dis-tribution design. II. Prototype implementation and results", Power Delivery, IEEE Transactions on, 8, pp. 644-650 (1993).
12. Jun, S., Lei, W., Zuyi, L., Shahidehpour, M., Li-Zi, Z., and Bing, H. \A new method for spatial power network planning in complicated environments", Power Sys-tems, IEEE Transactions on, 27, pp. 381-389 (2012).
13. Yeh, E.-C. and Tram, H. \Information integration in computerized distribution system planning", in Trans-mission and Distribution Conference, Proceedings., IEEE, pp. 602-607 (1996).
14. Correa, C.A., Bolanos, R.A., and Garces, A. \En-vironmental transmission expansion planning using non-linear programming and evolutionary techniques", in Alternative Energies and Energy Quality (SIFAE), 2012 IEEE International Symposium on, pp. 1-5 (2012).
15. Hui, Z., Vittal, V., Heydt, G.T., and Quintero, J. \A mixed-integer linear programming approach for multi-stage security-constrained transmission expan-sion planning", Power Systems, IEEE Transactions on, 27, pp. 1125-1133 (2012).
16. Jabr, R.A. \Optimization of AC transmission system planning", Power Systems, IEEE Transactions on, 28, pp. 2779-2787 (2013).
17. Maghouli, P., Hosseini, S.H., Buygi, M.O., and
Shahidehpour, M. \A scenario-based multi-objective model for multi-stage transmission expansion plan-ning", Power Systems, IEEE Transactions on, 26, pp. 470-478 (2011).
18. Rahmani, M., Romero, R., and Rider, M.J. \Strategies to reduce the number of variables and the combi-natorial search space of the multistage transmission expansion planning problem", Power Systems, IEEE Transactions on, 28, pp. 2164-2173 (2013).
19. Chatthaworn, R. and Chaitusaney, S. \Substation
and transmission line expansion planning using Adap-tive Tabu search algorithm", in Electrical Engineer-ing/Electronics, Computer, Telecommunications and Information Technology (ECTI-CON), 2013 10th In-ternational Conference on, pp. 1-6 (2013).
20. Ergun, H., Rawn, B., Belmans, R., and Van Hertem, D. \Technology and topology optimization for multi-zonal transmission systems", in IEEE Transactions on Power Systems, 29(5), pp. 2469-2477 (Sept. 2014).
21. Shu, J., Wu, L., Zhang, L., and Han, B. \Spatial power network expansion planning considering generation expansion", Power Systems, IEEE Transactions on, pp. 1-10 (2014).
22. Shu, J., Wu, L., Han, B., and Zhang, L. \Enhanced multidimensional power network planning based on ant colony optimization", International Transactions on Electrical Energy Systems, 25, pp. 1024-1222 (2015).
23. Dijkstra, E.W. \A note on two problems in connexion with graphs", Numerische Mathematik, 1, pp. 269-271 (1959).
24. Jasika, N., Alispahic, N., Elma, A., Ilvana, K., Elma, L., and Nosovic, N. \Dijkstra's shortest path algorithm serial and parallel execution performance analysis", in MIPRO, 2012 Proceedings of the 35th International Convention, pp. 1811-1815 (2012).
25. Verma, A., Panigrahi, B., and Bijwe, P. \Harmony search algorithm for transmission network expansion planning", Generation, Transmission & Distribution, IET, 4, pp. 663-673 (2010).
26. Escobar, A., Gallego, R., and Romero, R. \Using
algorithm population applied to the transmission ex-pansion planning problem", Revista Ingeniera e In-vestigacin Universidad Nacional de Colombia, 31, pp. 127-143 (2011).
27. Gallego, L.A., Rider, M.J., Lavorato, M., and Paldilha-Feltrin, A. \An enhanced genetic algorithm to solve the static and multistage transmission network expansion planning", Journal of Electrical and Computer Engi-neering, 2012(5) (2012).
28. Silva, I.D.J., Rider, M.J., Romero, R., and Murari, C.A. \Genetic algorithm of Chu and Beasley for static and multistage transmission expansion planning", in Power Engineering Society General Meeting, 2006. IEEE, p. 7 (2006).
29. Silva, I.J., Rider, M.J., Romero, R., and Murari, C.A. \Genetic algorithm of Chu and Beasley for static and multistage transmission expansion planning", in Power Engineering Society General Meeting, 2006. IEEE, p. 7 (2006).
30. 18 bus test system: Data and Results. Available: urlfhttp://tepstudies.ir/TestSystems/18bussystem -for-snp/g
31. 51 bus test system Data. Available: urlfhttp://
tepstudies.ir/TestSystems/iranian-51-bus-system-for-snp/g
Biographies
Mohammad R. Habibi was born in Baft, Iran in 1988. He received his MSc degree in Electri-cal Engineering from Kerman Graduate University of Technology (KGUT) at Kerman, Iran in 2011. He is now working for PhD degree at Electrical Engineering Department of KGUT. His research interests include
power system planning, power system optimization, and power system operation.
Masoud Rashidinejad received BSc degree in Elec-trical Engineering MSc degree in Systems Engineer-ing, from Isfahan University of Technology, Isfahan, Iran, and PhD degree in Electrical Engineering from Brunel University, London, U.K. in 2000. He is currently a Professor with the Department of Electrical Engineering, Shahid Bahonar University of Kerman, Kerman, Iran. His current research interests include power system optimization, power system planning, electricity restructuring, and energy management. Ali Hajebrahimi received BSc and MSc degrees in Electrical Engineering from Shahid Bahonar University and Kerman Graduate University. He is currently working toward PhD degree in Electrical Engineering from Laval University, Quebec, Canada. His research interests include power electronic, management of wind power system, power system reliability, mathematical power system modeling and smart grid.
Amir Abdollahi received BSc degree from Shahid Bahonar University of Kerman, Kerman, Iran in 2007, MSc degree from Sharif University of Technology, Tehran, Iran in 2009, and PhD degree from Tarbiat Modares University, Tehran, Iran in 2012, all in Electri-cal Engineering. He is currently an Assistant Professor at the Department of Electrical Engineering, Shahid Bahonar University of Kerman, Iran. His research interests include demand-side management, planning, reliability and economics in smart electricity grids.