35
A new methodology for COVID-19 preparedness centers based on
a location-allocation platform
Mohammad Alipour-Vaezi
1, Reza Tavakkoli-Moghaddam
1*1School of Industrial Engineering, College of Engineering, University of Tehran, Tehran, Iran
[email protected], [email protected]
Abstract
COVID-19 diseaseis spreading all over the planet. It is more than necessary that any researcher does his/her part to control this pandemic disease. Since this virus is infectious, and due to the limitations of hospitals, in different matters, such as human recourses (expertise) and needed equipment, it is reasonable to identify a pre-determined number of hospitals as COVID-19 pandemic centers and trying to equip them as much as possible to treat a relative patient in them. This study proposes a methodology based on a multi-criteria decision making (MCDM) method, namely BWM-WASPAS, for COVID-19 preparedness centers based on a location-allocation problem. This methodology is examined in Tehran city as a real-life case study. We find out that the most important item in this decision making is the ICU capacity. However, ignoring the other criteria is not allowed at all.
Keywords: Pandemic preparedness, COVID-19, location-allocation,
multi-criteria decision making, best-worst method.1- Introduction
COVID-19 is the new pandemic disease that threats all human lives. As you know, if a disease affects people on several continents, it is called pandemic disease in the literature. When a disease identified as pandemic, it is mandatory that several researchers do studies not only on how to prevent its propagation but also on learning about preparedness of future pandemic disasters (Guery et al., 2013; Huang et al., 2020; Jin et al., 2020). In this case, hospitals play a critical role on health care services, especially when a pandemic disease emerges. The inventory level of hospitals needed equipment for the disease treatment and the expertise efficiency are directly related to the effectiveness of the treatment. The more equipped a hospital is with needed equipment and expertise staff, the more likely it is to be effective in treating the disease.
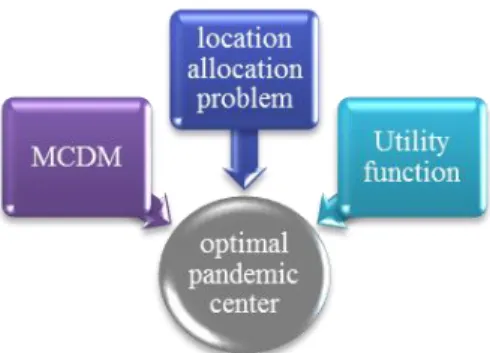
This paper uses a multi-criteria decision making (MCDM) method for hospital location-allocation problem in pandemic situation. Figure 1 asserts the content of this research. It is noteworthy that a hybrid of the best-worst method (BWM) and the weighted aggregated sum product assessment (WASPAS) method, namely BWM-WASPAS, is used in this paper.
*Corresponding author
ISSN: 1735-8272, Copyright c 2020 JISE. All rights reserved Winter (January) 2020
36
Fig. 1. Summary of the presented research
2- Literature review
Badri (1999) proposed an analytic hierarchy process (AHP) combined with global programing is a multi-objective method for reaching the global result in a location-allocation problem. Their methodology can be used to formulate feasible location strategies in a complex facility designing environment. Zhou and Liu (2003) introduced novel models for a capitated location-allocation problem. In this model, stochastic demand is formulated as three models: expected value, dependent-chance programing, and dependent-chance-constrained programing methods. Zhou and Liu (2007) formulated fuzzy demand models as follows: fuzzy α-cost minimization, fuzzy expected cost minimization, and credibility maximization models. Duhamel et al. (2016) proposed a mathematical model for a multi-period location-allocation problem considering an impact of over population and logistic resources constraints. They also proposed an insight on resiliency of the system. Zarrinpoor et al. (2017) designed a reliable hierarchal location-allocation problem for health service networks in a disruption situation using a two-stage robust approach. Hospital location-allocation problems have been neglected by researchers for many years.
Karamyar et al. (2018) developed a bi-objective model for a hospital location-allocation problem, whose budget and costs of establishing facilities are uncertain. An integrated objective, multi-period model was proposed by Mogale et al. (2018) for a location-allocation problem of food grain silo with dwell time. Mohammadnazari and Ghannadpour (2018) used an MCDM method (i.e., BWM-TOPSIS) for a hospital construction location-allocation problem considering a utility function. For determining the location of hazardous materials, Fan et al. (2019) proposed a reliable location-allocation model considering the risk of disruption. Paul and Wang (2019) used a robust programming model to design a location-allocation network for the earthquake preparedness with the objective of minimizing the total social cost. Their model optimizes a number of locations and the capacity of distribution centers. Diaz and Pawlik (2020) proposed a methodology for optimal location-allocation of centralization of hospitals performing pancreas resection in California. Rabbani et al. (2020) considered a sustainable multi-period multi-objective location-allocation model for a green supply chain with carbon emission of vehicles. Other important studies in this issue are as follows: Du et al. (2020), Harper et al. (2005), Mestre et al. (2015), Narula and Ogbu (1979), and Or and Pierskalla (1979).
According to the mentioned bold articles, we find that no article uses MCDM methods for a location-allocation problem. Also, the pandemic preparedness is not the platform of an article in the location-allocation issue. The BWM is one the newest MCDM methods applied in this article. It is worth to note that a utility function has been neglected in many studies on location-allocation problems.
3- Problem description and formulation
Today by advent of COVID-19 human societies understands the importance of disruption preparedness centers more than ever. One of the most critical preparedness centers for epidemic disease is hospitals. Obviously, special equipment is needed to treat a disease and needless to say that hospital equipment is limited. So, at the time of an epidemic (or pandemic) disease, it makes sense to
37
focus as much equipment and expertise as possible on a few specific hospitals as preparedness centers and commence the treatment of the relevant patients. However, the main question is which hospitals should be chosen to observe the most efficiency.
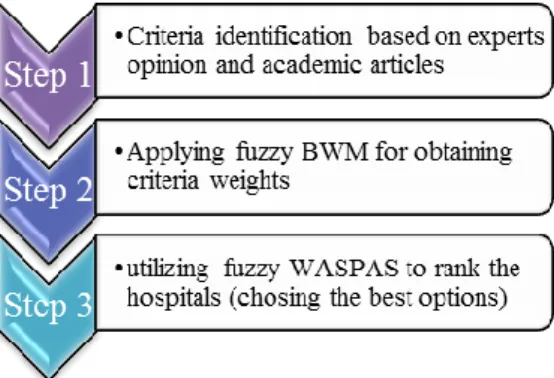
According to figure 2 in this paper, we determine which hospitals should be chosen as COVID-19 preparedness centers using a BWM-WASPAS method. In the first step, we review the related literature and important papers about the necessities that are known helpful for treating the COVID-19 patients. Also we identify the experts’ opinion criteria. In the next step, the impact of each criterion on choosing the optimal hospitals is obtained by using the BWM. In the final step of this methodology, the optimal hospitals are recognized by benefiting the WASPAS method.
Fig. 2. Methodology of the research
3-1- Criteria identification
With the help of expert’s opinion and reviewed papers from the literature, main criteria should be identified. It is very important that the defined criteria cover all the aspects of the considered subject. Otherwise, the results will not be reliable. Since this methodology is aimed for disruption preparedness centers of a location-allocation problem, it is obvious that criteria (e.g., accessibly and equipment) should be identified.
3-2- Obtaining weights of each criterion by using the BWM
The best-worst method (BWM) was proposed in (Rezaei, 2015, 2016) to help the decision makers for a better decision according to several criteria. The reason that this method is applied in this research is its novelty that has less computation compared to the similar methods. This strong MCDM method can exert as follows:
Step 1) Among the identified criteria in section 3.1, the best and worst criterion are identified according to the expert’s opinion.
Step 2) In this step, an expert gives a preference rate for the best criteria over all other criterions using a scale of 1 to 9.
Step 3) In this step, the expert gives a preference rate for each criterion over the worst criteria using a scale of 1 to 9.
Step 4) The optimized weights of each criterion (i.e., 𝑤1, 𝑤2, … , 𝑤𝑛) are computed in this step.
Min 𝜀𝑙
(1)
s.t.
|𝑤𝐵− 𝑎𝐵𝑗𝑤𝑗| ≤ 𝜀𝑙 ∀𝑗
|𝑤𝑗− 𝑎𝑗𝑊𝑤𝑊| ≤ 𝜀𝑙 ∀𝑗
∑ 𝑤𝑗
𝑗
= 1
38
This model is the linear BWM method proposed by Rezaei (2016). By benefitting this model, the weight of each criterion can be calculated.
3-3- Ranking the alternatives using WASPAS
The weighted aggregated sum product assessment (WASPAS) method is one of the important methods among MCDM techniques. This novel method proposed by Zavadskas et al. (2012). This method is applied for ranking the alternatives since its novelty, efficiency and validity (Ghorabaee et al., 2016). This method is a combination of the weighted sum model (WSM) and weighted product model (WPM) as follows:
Step 1) In the WASPAS method, the first step is to normalize the decision matrix by using equations (2) and (3) for positive (beneficial) and negative (non-beneficial) criteria, respectively.
𝑥̅𝑖𝑗=
𝑥𝑖𝑗
min
𝑖 𝑥𝑖𝑗
For beneficial criteria (2)
𝑥̅𝑖𝑗=
min
𝑖 𝑥𝑖𝑗
𝑥𝑖𝑗
For non-beneficial criteria (3)
where 𝑥𝑖𝑗 is the performance rate of alternative number i, where 𝑖 ∈ {1,2, … , 𝑚} according to criteria
i, where 𝑗 ∈ {1,2, … , 𝑛}. It is obvious that 𝑥̅𝑖𝑗 is the normalized value of 𝑥𝑖𝑗.
Step 2) Calculating the relative importance of the alternatives based on the WSM method is the task of second step in this methodology that can be done by:
𝑄𝑖(1)= ∑ 𝑥̅𝑖𝑗𝑤𝑗 𝑛
𝑗=1
(4)
𝑄𝑖(1) is the total relative importance factor of option number i, which is calculated based on the WSM method and the 𝑤𝑗 is the weight of criteria number 𝑗 (it is notable that this parameter is obtained in previous stage using the BWM method).
Step 3) Just like Step 2, the relative importance of the alternatives is calculated. However, in this step, calculation is based on the WPM method and using Equation (5). 𝑄𝑖(2) is the total relative importance factor using the WPM method.
𝑄𝑖(2)= ∏(𝑥̅𝑖𝑗)𝑤𝑗 𝑛
𝑗=1
(5)
Step 4) Based on Equation (6), the importance factor of options is calculated. According to 𝑄𝑖 ranking process of options is done.
𝑄𝑖 = 𝜆𝑄𝑖 (1)
+ (1 − 𝜆)𝑄𝑖(2) (6)
Equations (7) – (10) are identified aiming to calculate the optimal amount of λ considering the standard deviation. It is worth to note if 𝜆 = 0, the WASPAS model is equal to the WPM model and if
𝜆 = 1, the WSM model is the only component of the WASPAS method. Equations (8) and (9) calculate the variances.
𝜆 = 𝜎
2(𝑄 𝑖 (2)
) 𝜎2(𝑄
𝑖 (1)
) + 𝜎2(𝑄 𝑖 (2)
39
𝜎2(𝑄𝑖(1)) = ∑ 𝑤𝑗2𝜎2(𝑥̅𝑖𝑗) 𝑛
𝑗=1
(8)
𝜎2(𝑄𝑖(2)) = ∑ ( ∏ (𝑥̅𝑖𝑗)
𝑤𝑗
𝑤𝑗 𝑛
𝑗=1
(𝑥̅𝑖𝑗)(𝑤𝑗)(𝑥̅ 𝑖𝑗)
(1−𝑤𝑗)) 2
𝜎2(𝑥̅𝑖𝑗) 𝑛
𝑗=1
(9)
𝜎2(𝑥̅
𝑖𝑗) = (0.05𝑥̅𝑖𝑗)2 (10)
4- Case study
In this section, to clarify the matter, we use Tehran’s hospitals as a case study. Table 1 asserts the criteria identified by experts based on the literature of COVID-19. In Table 2, the weight of each criterion is obtained by using experts’ opinion through the BWM method.
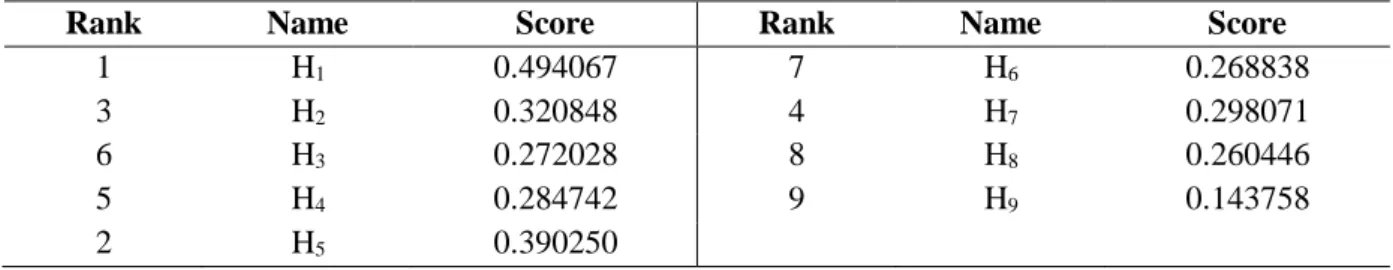
Table 3 shows the ranking of options (hospitals) using the weight of each criterion as the input of the WASPAS method. After this step, the first 3 of hospitals in this priority are chosen as COVID-19 preparedness centers. H1, H2, and H5 are the chosen hospitals according to the results. It is worth to
note that the number of chosen hospitals is a parameter that is predetermined here by the authors according to a population of Tehran city and its rate of the disease growth.
Because of its great capacity in both regular and ICU beds and the high performance of its treatment staffs, H1 is chosen as the best option for the COVID-19 preparedness canter. The bold difference
between H2 and H3 rankings is the profound impact of the ICU capacity. That is why H9 can be
expected to get the worst ranking. However, H4 is much more ICU capacity and H5 is better option.
This is the evidence of other criterion influence and asserts that although the ICU capacity is the most important criteria; however, it should not make us to ignore other criteria.
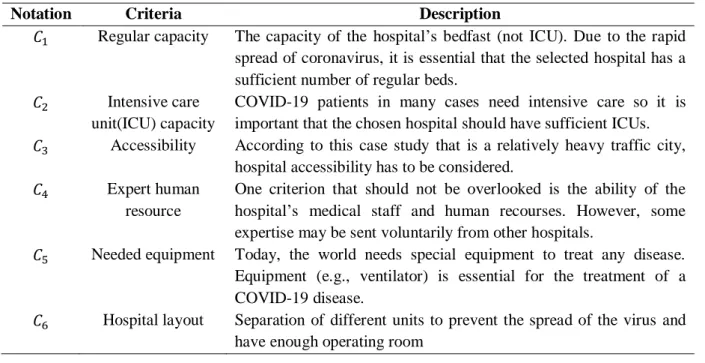
Table 1. Criteria description
Notation Criteria Description
𝐶1 Regular capacity The capacity of the hospital’s bedfast (not ICU). Due to the rapid spread of coronavirus, it is essential that the selected hospital has a sufficient number of regular beds.
𝐶2 Intensive care unit(ICU) capacity
COVID-19 patients in many cases need intensive care so it is important that the chosen hospital should have sufficient ICUs.
𝐶3 Accessibility According to this case study that is a relatively heavy traffic city, hospital accessibility has to be considered.
𝐶4 Expert human resource
One criterion that should not be overlooked is the ability of the hospital’s medical staff and human recourses. However, some expertise may be sent voluntarily from other hospitals.
𝐶5 Needed equipment Today, the world needs special equipment to treat any disease. Equipment (e.g., ventilator) is essential for the treatment of a COVID-19 disease.
𝐶6 Hospital layout Separation of different units to prevent the spread of the virus and have enough operating room
40
Table 2. Weight of each criterion in the BWM method
Criteria 𝐶1 𝐶2 𝐶3 𝐶4 𝐶5 𝐶6
Weight 0.126821 0.314296 0.05435 0.190232 0.286727 0.027569
Table 3. Ranking of hospitals benefitting the WASPAS method
Rank Name Score Rank Name Score
1 H1 0.494067 7 H6 0.268838
3 H2 0.320848 4 H7 0.298071
6 H3 0.272028 8 H8 0.260446
5 H4 0.284742 9 H9 0.143758
2 H5 0.390250
5- Conclusion
In this paper, a framework for COVID-19 preparedness centers based on a location-allocation problem was proposed with the aim of not only to prevent the spreading of the virus as much as possible but also to accelerate the service level and quality of health care services in the issue. The BWM-WASPAS method was proposed and applied because of its novelty and validity. It was remarkable that the predetermined criteria of this methodology were based on interviews with the experts. The BWM identified the most and least important criterion and the impact factor of each criterion on the efficiency of COVID-19 preparedness center. The WASPAS method ranked the options proposed by the experts for the location of preparedness centers. To the best of our knowledge, this study is the first study conducted in the platform of the location-allocation problem in pandemic preparedness centers (especially COVID-19) by using MCDM methods. Also, the combination of the BWM and WASPAS methods was a reliable method, which was not common in the MCDM papers.
References
Ahmadi, G., Torabi, S.A. and Tavakkoli-Moghaddam, R. (2016). A bi-objective location-inventory model with capacitated transportation and lateral transshipments, Int. J. of Production Research, 54(7), 2035-2056.
Cicek, C.T., Gultekin, H. and Tavli, B. (2019). The location-allocation problem of drone base stations. Computers and Operations Research, 111, 155-176.
Deb, K. (2001). Multi-objective optimization using evolutionary algorithms. John Wiley and Sons.
Deb, K., Pratap, A., Agarwal, S. and Meyarivan, T. (2002). A fast and elitist multiobjective genetic algorithm: NSGA-II. IEEE Transactions on Evolutionary Computation, 6(2), 182-197.
Kahag, M.R., Akhavan Niaki, S.T., Seifbarghy, M. and Zabihi, S. (2019). Bi-objective optimization of multi-server intermodal hub-location-allocation problem in congested systems: modeling and solution. Journal of Industrial Engineering International, 15(2), 221-248.
Kaya, O. and Urek, B. (2016). A mixed integer nonlinear programming model and heuristic solutions for location, inventory and pricing decisions in a closed loop supply chain. Computers and Operations Research, 65, 93-103.
41
Mehrabad, M.S., Aazami, A. and Goli, A. (2017). A location-allocation model in the multi-level supply chain with multi-objective evolutionary approach. Journal of Industrial and Systems Engineering, 10(3), 140-160.
Mousavi, S., Alikar, N., Niaki, S. and Bahreininejad, A. (2015). Optimizing a location allocation-inventory problem in a two-echelon supply chain network: A modified fruit fly optimization algorithm. Computers and Ind. Eng., 87, 543-560.
Nobari, A., Kheirkhah, A. and Esmaeili, M. (2019). Considering chain to chain competition in forward and reverse logistics of a dynamic and integrated supply chain network design problem.
Journal of Industrial and Systems Engineering,12(1), 147-166.
Puga, M. and Tancrez, J. (2016). A heuristic algorithm for solving large location–inventory problems with demand uncertainty. European Journal of Operational Research, 259(2), 413-423.
Sadati, A., Tavakkoli-Moghaddam, R., Naderi, B. and Mohammadi, M. (2019). A bi-objective model for a scheduling problem of unrelated parallel batch processing machines with fuzzy parameters by two fuzzy multi-objective meta-heuristics. Iranian Journal of Fuzzy Systems, 16(4), 21-40.
Sadeghi, J., Sadeghi, S. and Niaki, S.T.A. (2014). A hybrid vendor managed inventory and redundancy allocation optimization problem in supply chain management: An NSGA-II with tuned parameters. Computers and Operations Research, 41, 53-64.
Salehi, H., Tavakkoli-Moghaddam, R. and Nasiri, G. (2015). A multi-objective location-allocation problem with lateral transshipment between distribution centers. International J. of Logistics Systems and Management, 22(4), 464-482.
Sardou, I. and Ameli, M. (2016). A fuzzy-based non-dominated sorting genetic algorithm-II for joint energy and reserves market clearing. Soft Computing, 20(3), 1161-1177.
Soolaki, M. and Arkat, J. (2018). Supply chain design considering cellular structure and alternative processing routings. Journal of Industrial and Systems Engineering, 11(1), 97-112.
Srinivas, N. and Deb, K. (1994). Muiltiobjective optimization using nondominated sorting in genetic algorithms. Evolutionary Computation, 2(3), pp. 221-248.
Yadegari, E., Alem-Tabriz, A. and Zandieh, M. (2019). A Memetic Algorithm with a Novel Neighborhood Search and Modified Solution Representation for Closed-loop Supply Chain Network Design. Computers and Industrial Engineering, 128, 418-436.
Zahiri, B., Jula, P. and Tavakkoli-Moghaddam, R. (2018). Design of a pharmaceutical supply chain network under uncertainty considering perishability and substitutability of products. Information Sciences, 423, 257-283.
Zhen, L., Wu, Y., Wang, S., Hu, Y. and Yi, W. (2018). Capacitated closed-loop supply chain network design under uncertainty. Advanced Engineering Informatics, 38, 306-315.
Zheng, X., Yin, M. and Zhang. Y. (2019). Integrated optimization of location, inventory and routing in supply chain network design. Transportation Research Part B, 121, 1-20.