Optimization of Selection Plan Components
for Palas Meat Line
R
ă
zvan Popa
1, Dana Popa
1, Marius Maftei
1, Livia Vidu
1, Dorel Dronca
2,
Mihaela Ivancia
3, Georgeta Dini
ţă
1, Carmen Nicolae
11University of Agricultural Sciences and Veterinary Medicine of Bucharest, Faculty of Animal Sciences,
011464-Bucureşti, B-dul Marasti, 59, Romania
2Banat University of Agricultural Sciences and Veterinary Medicine from Timisoara, Faculty of Animal Sciences and Biotechnologies, 300645-Timişoara, Calea Aradului, 119, Romania
3University of Agricultural Sciences and Veterinary Medicine of Iasi, Faculty of Animal Sciences,
700490-Iaşi, Aleea Mihail Sadoveanu, 3, Romania
Abstract
The aim of the paper work is to optimize the population structure in a selection plan, according to model developed by Colburn (1961), which will be proposed to be applied for live weight and traits associated with carcass and meat quality improvement in Palas Meat Line. The method used in this paper work is modeling, which exist in the most animal breeding scientifically papers. After the simulations, we observed that the most convenient variant was that which prefigure 400 females in nucleus, a weight of the groups by A – 24%, B – 19% + 19%, C – 38%, 13 rams in nucleus and maximum values for demographical parameters.
Keywords: optimization, selection plan, sheep.
1. Introduction
The breeding program represent a deliberate combination of breeding factors for obtains populations with economic adapted genetic structures. Based on three criteria, we can judge the breeding programs and choose optimum variant [1]:
- the selection effect;
- the inbreeding management (to sustain the genetic variability);
- the expenses related with program realization and implementation.1
These three criteria cannot be separated in choosing of optimum variant.
The selection plan is an indissoluble component of breeding program. The selection plan is drafts which contain all operations related with replace animals in nucleus.
*Correspondent author: Razvan Popa,
Each component of this draft can constitute an object of optimization: population size and structure, demographical parameters, animal recording (recording method, capacity of testing space, family structure in testing space, etc.), selection method (BLP or BLUP).
The selection plan efficiency must be seen from two points of view: genetic and economic. These two aspects must be optimum combined, so that the final variant shall ensure maximum genetic gain with minimum effort, expenses and time. From genetic point of view, in 1944 Dickerson and Hazel [2, 3] say that a selection plan is efficient if: (a) selection effect increase more than generation interval, or (b) selection effect increase and generation interval decrease.
2. Materials and methods
Research method used is simulation. The population structure is:
- population: 400 females and 20 males; - birth rate: 123.5%;
- rate of survival: 80%;
- h2 for traits associated with growth speed is 0.3
and for traits associated with carcass and meat quality is 0.5;
- cv%: for average daily gain 15%, for live weight at 150 days is 16%, for slaughter efficiency is 12% and for carcass quality is 12%.
For Meat Line of ICDDOC Palas Constanta we propose a plan to improve growth speed and traits associated with carcass and meat quality, according to the model proposed by Colburn. In 1961, Colburn [2-4] develop a scheme for rams selection for live weight at 6 month and carcass quality.
In Colburn plan, genetic gain is induced in the population only to males (selected in two moments), females being admitted to reproduction without selection (genetic gain by females will be null).
The response of selection can be estimated for the two moments:
- based on average performances of offspring appreciate for carcass quality:
AA P
A
Desc i
h r n
n h
i r R
desc
, 2
.
1 1 5 . 0
.
In which:
.
,Pdesc
A
r
= offspring selection accuracy; i= selection intensity;A
= genetic additive standard deviation; n = number of relatives (12 descendants); h2 = heritability for carcass quality.- based on own performance for live weight at 6 month:
A A
P A
P
r
i
h
i
R
i
,i
In which:
i
P A
r
, = own performances selection accuracy; h2 = heritability for live weight.On the current parameters of population, according to model developed by Colburn, the program involves dividing the population into 3 groups as follows:
1. Group A - composed of 96 virgin sheep used or not to reproduction;
2. Group B – composed of 152 females, in which 76 females are at second calving and 76 females at third calving respectively;
3. Group C – composed of 152 females at over third calving.
The 152 females from Group B are mates with 19 one year old rams. The sex ratio is 1:8. From those 19 candidate rams it will be choose 10 rams from at least 4 fathers (very important condition for avoiding inbreeding) based on offspring performances, weigh and slaughtered at 5 month. Those 10 rams are mated in the next reproduction season with 152 females from Group C. On the current reproductive parameters will get 150 descendants. From those, 76 females will go into nucleus without selection. From 74 males, it will be selected at 5 month, based on own performances (for traits associated with growth speed) 19 rams will be promoted at reproduction activity and cycle repeats [2-4].
3. Results and discussion
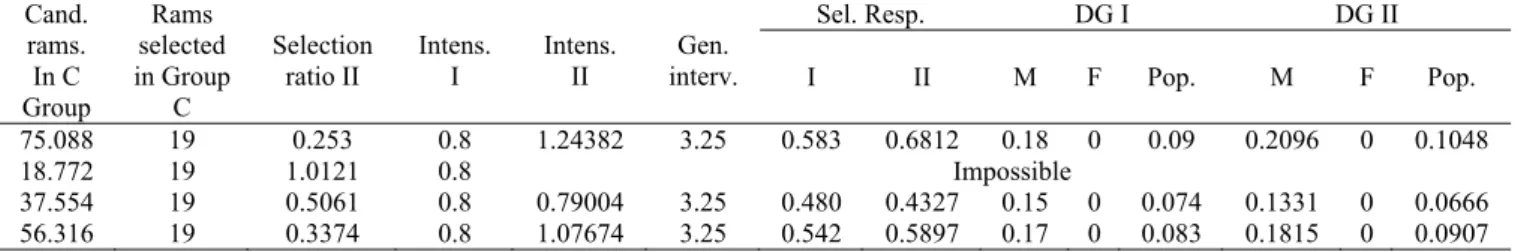
To optimize the population size were envisaged 4 plan variants may enter in the competition, the other parameters remaining constant. Thus, four variants were: 100, 200, 300 and 400 females. Variations resulting from the simulation are presented in the Table 1a and 1b.
From the analysis of the results set out in the Table 1a and 1b, it may be noted that, while maintaining the same structure of the population (A-24%, B-19%+19%, C-38%) at different sizes, the variant that allowed obtaining the largest annual effect of the selection is the one that provides 400 females, providing a genetic gain of 0.2096 σA for characters associated with carcass
and meat quality and 0.1048
σ
A for growth speed.a result, different selection ratio, with repercussions for the intensity of the selection.
Table 1a. Optimization of population size
Females in nucleus
Males in nucleus
Birth rate
Survival rate
Sex ratio
No of desc. for each ramas
Accuracy I
Accuracy II
Rams selected
for second
stage
Selection ratio I
Offspring obtained
in C Group
A B1 B2 C
96 76 76 152 19 1.24 0.8 8 7.904 0.728 0.5477 9.5 0.5 150.176
24 19 19 38 19 1.24 0.8 2 1.976 0.469 0.5477 9.5 0.5 37.544
48 38 38 76 19 1.24 0.8 4 3.952 0.601 0.5477 9.5 0.5 75.088
72 57 57 114 19 1.24 0.8 6 5.928 0.677 0.5477 9.5 0.5 112.632
Table 1b. Optimization of population size (further)
Cand. rams. In C Group
Rams selected in Group
C
Selection
ratio II Intens. I Intens. II interv. Gen.
Sel. Resp. DG I DG II
I II M F Pop. M F Pop.
75.088 19 0.253 0.8 1.24382 3.25 0.583 0.6812 0.18 0 0.09 0.2096 0 0.1048
18.772 19 1.0121 0.8 Impossible
37.554 19 0.5061 0.8 0.79004 3.25 0.480 0.4327 0.15 0 0.074 0.1331 0 0.0666
56.316 19 0.3374 0.8 1.07674 3.25 0.542 0.5897 0.17 0 0.083 0.1815 0 0.0907
Have not been taken into account sizes larger than 400 females, which are unacceptable for ICCDOC Palas Constanta, as a result of the limited resources available to the Institute. With regard to the structure of the population (weighting of the three groups), it cannot be the object of the optimization whereas the weights laid down by Colburn (1961) are optimal from the point of view of routing the breeding animals. In order to ensure a normal movement of the breeding animals, the three groups must replenish each other. Thus, the weight of Group A must be equal to ½ of the Group B weight, while group B weight shall be equal to the Group C weight. Group C must foment, year by year, group A.
To optimize the sex ratio were imagined 15 variants, by changing the number of sheep for each ram. By increasing the sex ratio, changed offspring selection accuracy (I stage of selection) of the rams, by increasing the number of descendants slaughtered for each candidate. Also, sex ratio increasing determines the decreasing selection ratio in the second stage of the selection (on own performance), with positive consequences on the intensity of the selection. Increasing the sex ratio is in close connection with the population inbreeding. By overgrowth of the sex ratio it appears the danger of inbreeding and what is gaining through selection it losing through
the depression of inbreeding. May not be allowed to the elite farms keep populations in danger to transform in moderate inbreeding lines.
A fundamental importance link, which must be taken into account in all breeding programs, is that which is established between the intensity of selection and effective size of population. Also, in all selection strategies, special attention should be granted to the rate of inbreeding (in direct correlation with the effective size), which grows due the accuracy of the genetic evaluation or the intensity of the selection. In addition, the inbreeding increase in relation to the number of males used in each generation is associated with a reduction in the variance of the population. Influence of variation of sex ratio on the selection effect in the studied population is given in the Table 2a and 2b.
From the analysis of the data presented in the Table 2a and 2b, it may notice that the biggest selection effect is obtain in variant no 14 which have a number of 4 rams in nucleus. However, in the light of what is stated above, starting with ΔF< 0.01, that will be recommended variant no 6, which involves a number of 13 rams in nucleus, the annual genetic gain being 0.0971 σA for
Table 2a. Optimization of sex ratio
Females in nucleus Males in
nucleus Birth
rate
Survi-val rate
Sex ratio
No of desc. for each ramas
Accur acy I
Accu-racy II
Rams selected
for second
stage
Selectio n ratio I
Offspring obtained
in C Group A B1 B2 C
96 76 76 152 19 1.235 0.8 8 7.904 0.728 0.5477 9.5 0.5 150.176
96 76 76 152 18 1.235 0.8 8.44 8.343 0.737 0.5477 9.0 0.5 150.176
96 76 76 152 17 1.235 0.8 8.94 8.834 0.747 0.5477 8.5 0.5 150.176
96 76 76 152 16 1.235 0.8 9.5 9.386 0.757 0.5477 8.0 0.5 150.176
96 76 76 152 15 1.235 0.8 10.13 10.012 0.767 0.5477 7.5 0.5 150.176
96 76 76 152 14 1.235 0.8 10.86 10.727 0.778 0.5477 7.0 0.5 150.176
96 76 76 152 13 1.235 0.8 11.69 11.552 0.789 0.5477 6.5 0.5 150.176
96 76 76 152 12 1.235 0.8 12.67 12.515 0.801 0.5477 6.0 0.5 150.176
96 76 76 152 11 1.235 0.8 13.82 13.652 0.813 0.5477 5.5 0.5 150.176
96 76 76 152 10 1.235 0.8 15.2 15.018 0.826 0.5477 5.0 0.5 150.176
96 76 76 152 9 1.235 0.8 16.89 16.686 0.839 0.5477 4.5 0.5 150.176
96 76 76 152 8 1.235 0.8 19 18.772 0.853 0.5477 4.0 0.5 150.176
96 76 76 152 7 1.235 0.8 21.71 21.454 0.868 0.5477 3.5 0.5 150.176
96 76 76 152 6 1.235 0.8 25.33 25.029 0.884 0.5477 3.0 0.5 150.176
96 76 76 152 5 1.235 0.8 30.4 30.035 0.900 0.5477 2.5 0.5 150.176
96 76 76 152 4 1.235 0.8 38 37.544 0.918 0.5477 2.0 0.5 150.176
Table 2a. Optimization of sex ratio (further)
Cand. rams. In C Group
Rams selected
in Group
C
Selection ratio II
In-tens
I
In- tens.
II
Gen. interv .
Sel. Resp. DG I DG II
I II M F Pop. M F Pop.
75.088 19 0.253 0.8 1.244 3.25 0.5825 0.6812 0.1792 0 0.0896 0.2096 0 0.1048
75.088 18 0.240 0.8 1.273 3.25 0.5898 0.6973 0.1815 0 0.0907 0.2146 0 0.1073
75.088 17 0.226 0.8 1.304 3.25 0.5975 0.7141 0.1838 0 0.0919 0.2197 0 0.1099
75.088 16 0.213 0.8 1.336 3.25 0.6054 0.7315 0.1863 0 0.0931 0.2251 0 0.1125
75.088 15 0.199 0.8 1.369 3.25 0.6136 0.7498 0.1888 0 0.0944 0.2307 0 0.1154
75.088 14 0.186 0.8 1.404 3.25 0.6222 0.7690 0.1915 0 0.0957 0.2366 0 0.1183
75.088 13 0.173 0.8 1.441 3.25 0.6312 0.7893 0.1942 0 0.0971 0.2428 0 0.1214
75.088 12 0.160 0.8 1.480 3.25 0.6406 0.8108 0.1971 0 0.0985 0.2495 0 0.1247
75.088 11 0.146 0.8 1.523 3.25 0.6503 0.8339 0.2001 0 0.1001 0.2566 0 0.1283
75.088 10 0.133 0.8 1.568 3.25 0.6606 0.8588 0.2033 0 0.1016 0.2642 0 0.1321
75.088 9 0.120 0.8 1.617 3.25 0.6714 0.8859 0.2066 0 0.1033 0.2726 0 0.1363
75.088 8 0.106 0.8 1.672 3.25 0.6827 0.9157 0.2100 0 0.1050 0.2817 0 0.1409
75.088 7 0.093 0.8 1.733 3.25 0.6946 0.9490 0.2137 0 0.1069 0.2920 0 0.1460
75.088 6 0.080 0.8 1.802 3.25 0.7071 0.9869 0.2176 0 0.1088 0.3037 0 0.1518
75.088 5 0.067 0.8 1.883 3.25 0.7203 1.0311 0.2216 0 0.1108 0.3172 0 0.1586
75.088 4 0.053 0.8 1.980 3.25 0.7343 1.0844 0.2260 0 0.1130 0.3336 0 0.1668
In this variant, the sex ratio result is perfectly viable for sheep, in natural reproduction conditions.
Increasing the value of the demographic parameters affects the genetic gain through two levers: on the one hand increases the number of descendants slaughtered on each ram and in this way it appear a positive change in offspring selection accuracy (first stage of selection), and on the other hand increases the number of candidate
rams, thus changing the intensity of individual selection (second stage of selection).
annual genetic gain will be 0.0934 σA for
characters associated with carcass and meat quality and 0.1132 σA for growth speed. Fully
optimized variant bring together optimal solutions for each factor that was varied. Population structure (for full optimized version): population size: 400 females and 13 males; birth rate: 140%; survival rate: 85%. Because the females come into nucleus without selection, their effect is zero, that making the genetic gain of population, to reduce by half. In full optimized version, the annual genetic gain will
be 0.1066 σ
Afor characters
with carcass and meat quality and 0.1328 σ
Afor growth speed.
4. Conclusions
The selection plan efficiency must be seen from two points of view: genetic and economic. These two aspects must be optimum combined, so that the final variant shall ensure maximum genetic gain with minimum effort, expenses and time. For ICDDOC Palas Constanta Meat Sheep Line we propose for genetic increase of prolificacy a selection plan, according to the model proposed by Colburn, whose components must be optimized.
Respecting the selection plans optimization principles, a maximum genetic gain will be obtain in a population which prefigure 400 females and 13 males; birth rate: 140%; survival rate: 85%. The weight of the 3 groups will be:A-24%, B-19%+19%, C-38%. The structure of the population (weighting of the three groups), it cannot be the object of the optimization. In full optimized version, the annual genetic gain will be 0.1066 σA for characters associated with carcass
and meat quality and 0.1328 σA for growth speed.
Acknowledgements
The paper work was elaborate based on researches financed by contract no 52163/2008.
References
1. Bijma, P., Dekkers, J., Van Arendonk, J., Genetic improvement of Livestock, Animal Breeding and Genetics group, Department of Animal Sciences, Wageningen University, 2005, pp. 23.
2. Grosu, H., Programe de ameliorare, Editura AgroTehnica, Bucuresti, 2003, pp. 43-156.
3. Grosu, H., Oltenacu, P. et al., Programe de ameliorare genetic in zootehnie, Editura Ceres, Bucuresti, 2005, pp. 554-620.