13
The Influence of Some Phytoadditives on Growth
Performances and Meat Quality in Rainbow Trout
(Oncorhynchus Mykiss)
Gabor Erol-Florian, Aurel Şara, Florin Molnar, Mihai Benţea
University of Agricultural Sciences and Veterinary Medicine Cluj-Napoca, 400372, Manastur Street 3-5, Romania
Abstract
The experiment aimed to determine the bioproductive effects of the administration of phytoadditives in rainbow trout feeds. The additives were represented by garlic, ginger, oregano and Echinacea that where added into rainbow trout feed in proportions of 2% garlic (L1E), 1% ginger (L2E), 1% oregano (L3E) and 0.5% Echinacea (L4E). The experimental period was 116 days. The greatest weight gain was recorded in the L3E group and the lowest in the L4E group. The highest specific growth rate was recorded in the L4E group. The lowest feed conversion ratio was recorded in the L3E group and the highest in the control group Analyzing the meat chemical composition, the highest increase in dry matter was recorded in L1E group compared with the control group; the biggest increase in the Gross Protein value was recorded in L4E group, the L3E group showing a decrease compared with the control group. Regarding the Gross Fat content, the highest value was recorded in the L1E compared to the control group while the L3E group showed a decrease of GF content, compared with the control group. The results obtained confirm the beneficial effects of these phytoadditives on the growth and consumption indices in rainbow trout.
Keywords: phytoadditives; growth indices; garlic; ginger; oregano; Echinacea; rainbow trout
1. Introduction
Phytoadditives are fodder additives obtained from medicinal plants or plants extract. They are being used on a wide range, by humans as well as by animals, including fish. Recent studies tried to show the effects of phytoadditives usage in all farmed animals. Among the noticed effects there we can mention the immunostimulator effect, bioproductive effect, antioxidant effect and antimicrobial effect, their ability to stimulate the enzymatic equipment and to increase the nitrogen absorption.1
The main advantage of using these phytoadditives is that they are natural substances that don’t pose any threat to fish health, human health or to the environment. Researches are still in progress to determine their way of action and the possible side
* Corresponding author: Gabor Erol-Florian, Tel. 0747040538, Email: gogu13us@yahoo.com
effects that can appear as a result of their use, and to determine the possibility of using other plants as phytoadditives.
Metwally (2009) [1] administered garlic to Nile Tilapia (Oreochromis niloticus). He reported bigger final weight in the group fed with garlic containing feeds. The same group showed an increase in the growth rate and in the fee conversion ration, compared with the control group. Shalaby et al. (2006) [2] administered garlic in Nile tilapia and reported an increase in the final weight and an improved growth rate compared with the control group. Nya and Austin (2009) [3] used garlic to control an Aeromonas
hydrophila infection in rainbow trout
(Oncorhynchus mykiss), recording at the same
14 Zheng et al. (2009) [4] evaluated the effect of the oregano essential oil on growth in channel catfish
(Ictalurus punctatus). He reported an increase in
weight gain and an improvement of the feed conversion ratio in the oregano feed group, compared with the control group. Nya and Austin (2009) [5] studied the possibility to use ginger to control an Aeromonas hydrophila infection in rainbow trout, while recording the growth and consumption indices. The ginger fed group showed a greater body weight gain and a better feed conversion ratio compared to the control group.
Salah et al. (2008) [6] studied the effects of Echinacea in Nile tilapia, reporting the improvement of the body weight gain and the growth rate.
The aim of this research was to determinate the influence of some phytoadditives (garlic, ginger, oregano and Echinacea) on growth and consumption performances in rainbow trout
(Oncorhynchus mykiss).
2. Material and method
The research took place at the trout farm ICAS Gilău, situated Cluj County using a total number of 1000 fish (rainbow trout) divided in 5 groups (one control group and four experimental groups), each group consisting of 200 fish. Mean body weight at the beginning of the experiment was
63.3g. The fish were reared in concrete tanks, in the same rearing conditions (water quality, rearing density, feeding time, fodder quantity/quality). The experiment took place over a period of 116 days (3.06.1010 – 29.09.2010). The fodder administered was made by Skretting (41% protein, 12% fat, 7.8% ash). Phytoadditives where introduced in the fodder in different amounts: garlic 2% (L1E), ginger 1% (L2E), oregano 1% (l3E) and Echinacea 0.5% (L4E).
During the experiment the body mass evolution, the weight gain, the growth ratio and the feed conversion ratio have been recorded. At the end of the experiment we determined the biometrical indices (standard length, head length, big height and the big perimeter) based on which the body indices were calculated (Fulton coefficient, Kiselev indices and the carnosity indices).
The data obtained was statistically analyzed using GraphPad Instat® software v 3.05, using the Student test.
Water quality
The water parameters were monitored throughout the experimental period. The water samples were analyzed in the Zoohygiene Laboratory from USAMV Cluj-Napoca. pH and dissolved oxygen were determined in situ.
Chemical parameters values are presented in Table 1.
Table 1. Chemical parameters of the water Parameter M.U. Biological limit* Value Results
pH 6-8.5 6.9
Dissolved O2 mg/l 8-12 8.36
Cl- mg/l 0.04-0.2 0.12
H2S mg/l <1 0
NH3 mg/l 0.03-2 0.1
NO2 mg/l <0.2 0.015
NO3 mg/l <20 1.7
* Bud I. et al. [7]
Analyzing Table 1, it can be seen that all the parameters were in the limits described in the cited literature.
3.Results and discussions
The mean values of the body weight are presented in Table 2
15 through the appetite stimulation effect of ginger [7]. Group L1E, fed on garlic containing diet, showed an increased body weight (308.93g)
compared with group L4E (308.17g), fed on an Echinacea containing diet, and compared to the control group (304.57g)
Table 2. Mean body weight of rainbow trout at the end of the experimental period Specification M (Garlic) 1E (Ginger) 2E (Oregano) 3E (Echinacea) 4E
n 30 30 30 30 30 Initial body
weight (g) 63.35 63.35 63.35 63.35 63.35
Final body
weight (g) 304,5667 308,9333 325,6333 325,9333 308,1667 X ± SX 304,5667 ± 12.037 308,9333 ± 8.329 325,6333 ± 8.633 325,9333 ± 9.331 308,1667 ± 10.590
Variability was medium in all experimental groups (10%<V%<20%), the control group showing a high variability (V%>20%). All the
differences obtained are statistically insignificant (p>0.05).
0 50 100 150 200 250 300 350
Iunie Iulie August Sept
M
L1E
L2E
L3E
L43
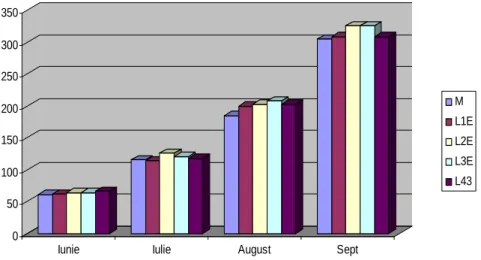
Fig 1. Body mass evolution of rainbow trout throughout the experimental period
Analyzing the chart for the body mass evolution throughout the experimental period (fig. 1), a constant evolution is being observed throughout the experimental period. The stress caused by the change in the environment or by handling was at a low level, this fact reflecting in the growth dynamics, which is constant and without
regressions. Another factor that contributed to this dynamic was the constant value of the water parameters.
The effects of the administered phytoadditives on the growth and consumption indices are presented in table 3.
Table 3. Growth and consumption indices values at the end of the experimental period
Specification M (Garlic) L1E (Ginger) L2E (Oregano) L3E (Echinacea) L4E
Weight gain (g) 241.24 245.59 262.28 262.58 244.81
Specific growth rate (g/day) 2.079 2.117 2.261 2.263 2.11
16 Analyzing the main growth indices recorded throughout the experimental period (table 3), it can be observed a favorable influence of the administered additives in experimental groups L1E, L2E and L3E on the weight gain. The greatest weight gain was recorded in group L3E (262.58g), fed on an oregano containing diet, followed closely by the L2E group (262.28g), fed on a ginger containing diet, compared with the control group (241.24g). Also, groups L1E and L4E showed an increased weight gain (245.59 respectively 244.81g) compared with the control group. Regarding the specific growth rate, the highest values were recorded in groups L2E and L3E (2.26 g/day), compared with the
control group (2.08 g/day). Also, garlic supplementation of the fodder led to the increase of the specific growth rate (2.12), compared to the control group. The lowest value of the specific growth rate was recorded in the control group. Analyzing the FCR values, the lowest was recorded in group L3E (1.41:1) followed closely by group L2E (1.42:1), compared with the control group. Groups L2E and L3E showed a FCR value under 1.5:1, while the control group and experimental groups L1E and L4E showed a value greater than 1.5:1 (1.543:1 in the control group, 1.504:1 in L1E group, 1.525:1 in L4E group, respectively).
The biometric indices values recorded at the end of the experimental period are presented in table 4.
Table 4. The biometric indices values recorded at the end of the experimental period
Group Specification Lst Lh H P
M X ± SX 27.415±0.432 6.65±0.126 8.27±0.198 17.98±0.492
Min 24.2 5.7 6.96 15.3
Max 32.3 7.9 10.7 23.7
L1E (garlic)
X ± SX 27.68±0.381 6.695±0.06 8.35±0.132 18.±0.291
Min 24 6.4 7.2 15.9
Max 30.7 7.2 7.9 21.8 L2E
(ginger)
X ± SX 27.615±0.664 6.645±0.115 8.6±0.189 18.27±0.455
Min 19.2 5.5 6.5 13
Max 31.4 7.5 10.0 21.7
L3E (oregano)
X ± SX 27.767±0.427 6.681±0.095 8.605±0.149 18.257±0.334
Min 24.4 5.8 7.6 16
Max 32.1 7.8 10.4 22.4
L4E (Echinacea)
X ± SX 28.190±0.494 6.709±0.104 8.614±0.173 18.338±0.348
Min 21.2 5.3 6.8 14.6 Max 31.6 7.4 9.9 21.3 Lst – standard length, Lh – head length, H – great height, P – perimeter.
Based on these biometric indices, body indices were calculated (growth coefficient, the Kiselev
and the carnosity indices). The values obtained for these indices are presented in table 5.
Table 5. Body indices values recorded at the end of the experimental period on rainbow trout
Indices Group M L1E L2E L3E L4E K 1.458 1.451 1.483 1.465 1.470
Ik 1.525 1.520 1.511 1.517 1.523
Ic 23.257 24.404 24.063 24.158 23.968
K – Fattening coefficient; Ik –Kiselev indices; Ic – Carnosity indices
Analyzing the obtained values, it can be seen that they are close in all groups, the differences being insignificant.
17
Table 6. Survival rates and recorded losses throughout the experimental period
Specification Group
M (garlic) L1E (ginger) L2E (oregano) L3E (Echinacea) L4E
Initial number 200 200 200 200 200
Final number 176 179 175 176 175
Losses (%) 12 10.5 12.5 12 12.5
Survival (%) 88 89.5 87.5 88 87.5
Analyzing the losses recorded during the experimental period, it can be observed that the biggest survival rate was recorded in group L1E (89.5%), fed with garlic supplemented diet; this result can be explained by the immunostimulating effect of the garlic and also by the presence of allicine, a natural antibiotic found in garlic. The lowest survival rate was
recorded in groups L2E and L4E (87.5% in both cases). Both the control group and the L3E group showed a survival rate of 88%. Results obtained are confirmed by the ones presented by Salah et al. (2008), Zheng et al. (2009) and by Nya and Austin (2009).
The crude chemical composition of the trout meat is presented in table 7.
Table 7. Crude chemical composition of the trout meat
Specification M (garlic) L1E (ginger) L2E (oregano) L3E (Echinacea) L4E Reference values
DM % 25.9679 ± 0.7272 27.8423 ± 0.9543 26.3717 ± 0.5063 27.4949 ± 0.7568 24.3410 ± 0.2902 22,97 (Bud I. Vioara Mireşan, Şi 2008)[8]
CP % 18.6769 ± 0.1331 17.9829 ± 0.2093 18.8497 ± 0.3552 17.7502 ± 0.2456 19.1798 ± 0.2263 14,00-18,90 (Savic N)
CF % 5.9375 ± 0.1774 6.5520 ± 0.5285 6.1740 ± 0.0916 4.7064 ± 0.7057 4.8759 ± 0.4134 (www.fao.org)[9] 2,70-10,60 DM – dry matter; CP – crude protein; CF – crude fat
Table 8. Statistical significance of the differences between the 5 groups regarding crude chemical composition of the trout meat (Student test)
DM CP Difference of
mean significance Statistical Difference of mean significance Statistical
L3E vs. L4E +3.124 * -1.430 **
L3E vs. L2E - ns -1.100 *
L3E vs. M - ns -0.927 *
L1E vs. L4E +3.501 * -1.197 *
*- significant differences; **- distinctively significant differences Analyzing the data in table 7, a greater dry matter
content can be observed in groups L2E and L3E (26.37% and 27.49%), compared with the control group (25.97%); significant differences regarding the dry matter content were recorded between groups L3E and L4E and L4E and L1E respectively. Regarding the crude protein content, a distinctively significant difference can be observed between groups L3E and L4E and
18 group L1E (6.55%) and the lowest in the L3E group (4.71%).
4. Conclusions
The fodder supplementation with
phytoadditives (garlic, ginger, oregano and Echinacea) determined a better food assimilation and an improvement of the growth performances
The specific growth rate was improved in all experimental groups compared to the control group
The use of phytoadditives had also an influence on the feed conversion ration; the lowest value was recorded in group L3E (fed with an oregano containing diet). All the experimental groups showed better FCR values compared with the control group
The supplementation of the fodder with phytoadditives also influenced the survival rate; the greatest survival rate was recorded in L1E group, explained by the immunostimulating effect of garlic and by the presence of allicine (substance with antibiotic properties). Groups L2E and L4E showed lower survival rates compared to the control group.
The use of phytoadditives led to an increase in crude protein content in groups L2E and L4E and to a decrease o crude protein value in groups L1E and L3E
Regarding the crude fat content, a decrease has been observed in groups L3E and L4E; an increase of the crude fat content has been observed in groups L1E and L2E.
References
1.Metwally, M. A. A., Effects of Garlic (Allium sativum) on Some Antioxidant Activities in Tilapia
Nilotica (Oreochromis niloticus); World Journal of
Fish and Marine Sciences, 20091, (1), 56-64
2.Shalaby, A. M., Khattab, Y. A., Abdel, R. A. M., Effects of garlic (Allium sativum) and chloramphenicol
on growth performance, physiological parameters and survival of Nile tilapia (Oreochromis niloticus); J.
Venom. Anim. Toxins incl. Trop. Dis., 2006, 12(2), 172-201
3.Nya, E. J., Austin, B., Use of garlic, Allium sativum,
to control Aeromonas hydrophila infection in rainbow
trout, Oncorhynchus mykiss (Walbaum); Journal of
Fish Diseases, 2009, 32, 963–970
4.Zheng, Z. L., Tan, J. Y. W., Liu, H. Y., Zhou, X. H., Xiang, X., Wang, K. Y., Evaluation of oregano essential oil (Origanum heracleoticum L.) on growth,
antioxidant effect and resistance against Aeromonas hydrophila in channel catfish (Ictalurus punctatus);
Aquaculture, 2009, 292, 214–218
5.Nya, E. J., Austin, B., Use of dietary ginger, Zingiber officinale Roscoe, as an immunostimulant to control Aeromonas hydrophila infections in rainbow trout, Oncorhynchus mykiss (Walbaum); Journal of Fish
Diseases, 2009, 32, 971–977
6.Salah, M. A., Mohamed, F. M., George, J. Echinacea as immunostimulatory agent in Nile tilapia (Oreochromis niloticus) via earthen ponds experiment;
8th International Symposium on Tilapia in Aquaculture 2008
7.Yamahara, J., et al Gastrointestinal motility enhancing effect of ginger and its active constituents. Chem Pharm Bull (Tokyo), 1990, 38(2), 430-1
8.Bud, I., Miresan, V., Contributions concerning the quality indices’ appreciation in main aquatic organisms, which fall under human consumption. AACL Bioflux, 2008, 1, 73-83, Printed version: ISSN 1844-8143 Online version: ISSN 1844-9166 available at: http://www.bioflux.com.ro/docs/vol1/2008.1.73-83.pdf