INTAKE PORT FLOW STUDY ON CYLINDER
H
EAD USING
F
LOWBENCH
M. F. Samuri,
aM. F. Muhamad Said,
a,*, N. A. Mohamad Shafie,
aZ. Abdul
Latiff,
aA. Abdul Aziz,
aa
Automotive Development Centre,
Faculty of Mechanical Engineering,
Universiti Teknologi Malaysia,
81310 UTM Johor Bahru, Malaysia.
Article history Received 26 April 2015 Received in revised form
26 June 2015 Accepted 26 August 2015
*Corresponding author
[email protected]
G
RAPHICALA
BSTRACTK
EYWORDSFlowbench; intake port; flow; porting
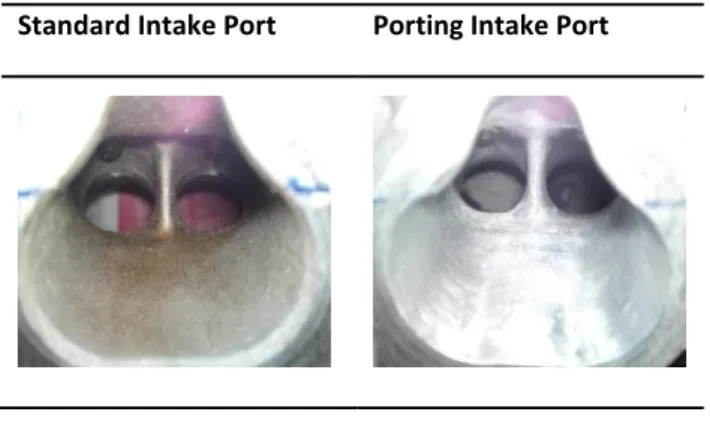
Standard Intake Port
Porting Intake Port
A
BSTRACTHomogeneous air-fuel mixture that enters
the combustion chamber during intake
process can tremendously optimize the
engine performance output. There are a
number of factors that affect the mixture,
but this study focuses on the flow through
a cylinder head port. This study caters the
shape and condition of a 1.6-liter Spark
Ignition (SI) gasoline engine cylinder head
after
modification
process.
The
modification consists of porting and
polishing jobs. Effects of modification have
been experimentally tested by opening the
valve lift with significant value, by
calculation using SuperFlow SF 600
FlowBench machine. Since flow losses are
caused by port expansion rather than
contraction, the greatest flow loss in the
intake port is due to expansion of air out
of the valve. The air flow through the
I
NTRODUCTIONThe design of the cylinder head for automotive SI engine is important because it affects the performance, fuel economy and emissions. Designing and developing an effective intake port is one of the major research areas in SI engine, since it determines the volumetric efficiency and in-cylinder charge motion of the spark ignition engine, which influences the thermodynamic properties and is directly related to power output and emissions [1]. In order to achieve higher thermal efficiency and better emission control, intake air motion should be enhanced in combustion. An interesting challenge in designing the SI engine intake port is to pursue a maximized mass flow while maintaining in-cylinder motion within a reasonable range. The volumetric efficiency can be improved by allowing more mass flow into the engine.
Delivery of the air-fuel mixture to the combustion chamber is one of the most important aspects in designing effective cylinder head. Loss of horsepower and torque in the operating range of the engine due to inappropriate cylinder head port geometry causes the air-fuel mixture to drip out of suspension or puddle on the floor of the port [2]. Flow bench testing of the cylinder head in modified and unmodified form can give some idea on the horsepower and torque developed in the engine. Turbulence intensity, swirl and tumble content in the incoming airflow to the combustion chambers are the key parameters in controlling the emission level [3]. The postulations of several flow regimes are classified by the occurrence of flow separation at the valve face or valve seat. The separation at the valve face and seat has been shown to be crucial for the prediction of flow losses in intake regions. There could be little variation of the flow with valve lift in the upstream part of the port, but the flow pattern in the vicinity of the valve and inside the cylinder may vary with lift.
Port and valve design determines the discharge coefficient (Cd) of the port and consequently the volumetric efficiency of the engine [4]. Discharge coefficient describes the behaviour of all real flows contract in area as they pass through any restriction [5]. Since the performance of the engine is dependent on the amount of air entering the combustion chamber, the port design introduced in this study is aimed to increase the flow and improve its quality.
M
ETHODOLOGYThe methodology used in performing the present work is as follows:
1. Flow bench setup – All the apparatus and equipment are designed to meet the requirement of testing procedure. Since Flow bench is designed to test various designs of cylinder head, all the adapters used for this machine are fabricated in-house and data logger from Performance Trends “Black Box” is used to record the data.
2. Intake flow measure (original intake port) – the tested cylinder head is measured in term of flow rate that is produced at variable valve lift configuration. This data is recorded for comparison later with the modified intake port.
3. Intake flow measure (original intake port with addition of intake runner and air box) – This testing is estimated to represent the actual condition of engine operating in car.
4. Intake port modification – In order to increase the flow that enters the cylinder head, modification through the wall of intake port is performed. This modification consists of port and polish job.
5. Intake flow measure (modified intake port) - The modified intake port cylinder head then is tested using Flowbench to measure the improvement in flow. Data after modification is important in order to estimate the horsepower gained after the modification.
Testing / Experiment Setup
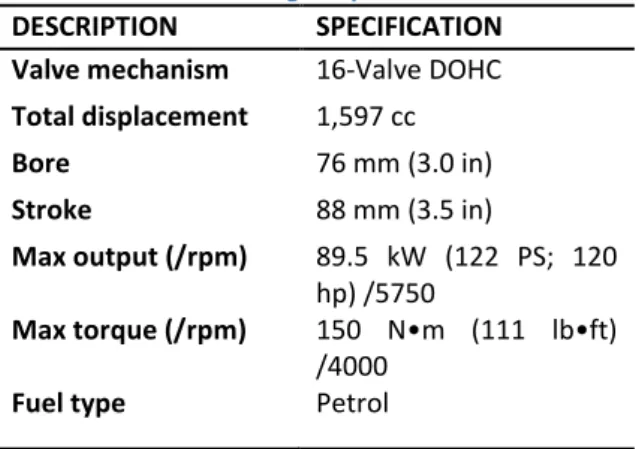
The engine that has been selected is a 1.6-liter engine, and its specifications are shown in Table 1.
Table 1: Engine specification
DESCRIPTION SPECIFICATION
Valve mechanism 16-Valve DOHC
Total displacement 1,597 cc
Bore 76 mm (3.0 in)
Stroke 88 mm (3.5 in)
Max output (/rpm) 89.5 kW (122 PS; 120
hp) /5750
Max torque (/rpm) 150 N•m (111 lb•ft)
/4000
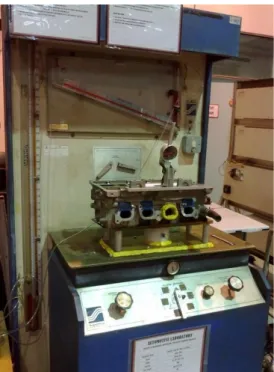
Figure 1: SF600 FlowBench machine with tested cylinder head
Flow bench testing procedure
I. Set the vertical test pressure meter to zero by adjusting the nut at the bottom of the meter.
II. Set the incline flow meter to zero by sliding it along its resting frame. This can be done by loosening the adjuster (bolt) and re-tightening them after adjusting.
III. Ensure the whole Flowbench is on a level ground by checking the spirit level. The bubble should be in the middle.
IV. Set the levers to “INTAKE” and “INTAKE BELOW 150CFM”.
V. Bolt the cylinder adapter to the Flow bench table.
VI. Bolt the cylinder head to the top plate of the cylinder adapter, including the gasket under the cylinder head to replicate an actual engine and reduce leakage.
VII. Remove the intake camshaft. Then, remove the tappets so that the valve adapter and plunger can press directly on the valves.
VIII. Place some gasket pieces at the lower bearing so that the valve plunger will have a tight fit and will not rotate. Then, place it on the bearing. Ensure the valve tips are visible through the holes in the valve plunger.
IX. Place the bearing caps on the valve plunger and bolt them.
X. Insert the bolt (M8 x 1 x 100) and rotate it until it touches the valve tips.
XI. Bolt the valve gauge to the valve adapter and place it between the bolts to measure the valve lift.
XII. Turn the valve gauge clock wise until it touches the end of bolt; this is where valve lift is zero.
XIII. Close off the fuel injector section with some tapes to prevent getting higher (incorrect) reading. This is to produce the condition when the cylinder head is fitted with the intake manifold and fuel injectors.
XIV. Run the Port Flow Analyser v3.58 software on computer/laptop, and also connect the Performance Trend “Black Box” with power supply and attach a tube that available between the incline and vertical manometer.
XV. Switch on the power supply.
XVI. Set range to 1.
XVII. Run the Port Flow Analyser v3.58
software and set all the ranges and pressure to be measured.
XVIII. Rotate the bolt clock wise at valve
plunger until valve gauge reading is in a difference of 0.039inch (1mm).
XIX. Turn on the motor and adjust the intake Flow Control Knob clock wise until pressure at Port Flow Analyser v3.58 shows 10” H20.
XX. When the pressure reaches 10”, press F1 to record the data for that particular testing.
XXI. Increase the valve lift and record the value. Continue until all the valve lifts have been tested. The maximum valve lift for this cylinder head engine, according to specification, should be 9mm.
XXII. If the Flowbench gets overheated from long runs, it will automatically shut down. Switch off the power supply and allow cooling for about half an hour before resuming the test.
Porting analogy
engine. Methods for porting usually include the use of CNC machine to carve the basic shape of the port.
This porting process to the cylinder heads and intake ensures that the flow mixture enters the cylinder head chamber with the maximum amount of velocity. Higher flow restriction in any engine is usually within the cylinder head. Porting is needed to reduce the flow restriction at the particular area to increase performance of the engine, compared to the same engine with same displacement without porting.
Higher flow entering the engine cylinder will cause increment in the velocity of the air flow, and at the same time, the performance in term of horsepower will also be affected. Intake ports are modified strictly the same as how much the porting works is done depending on the parameters that have been fixed.
Porting modification
Table 2: Different views of standard and porting intake
Polishing analogy
Polishing is another type of modification of the cylinder head. Polishing does not give extra air intake for greater horsepower. This analysis was conducted to see the change in term of horsepower between the rough surface and the smooth surface after polishing.
Rough surface can provide turbulent flow, thus enhancing the mixture of the fuel and air in the combustion chamber. Smooth surface will make the fuel evaporate, as the boundary layer for smooth surface is not zero, and thus the fuel will touch the surface and enhance the mixture of the air and fuel because both are in the same phase and condition.
Polishing modification
Table 3: Different views of standard and polishing intake view
Standard intake port around valve seat
Polishing intake port around valve seat
R
ESULT AND DISCUSSIONFigure 2: Graph of comparison for Flow, cfm vs. Valve lift
When flow of air passes through some particles or restriction of surface, it will face flow losses at some point. This can be observed from assembling a runner and air box through the cylinder head. The flow will experience a pressure drop along intake runner and air box. Figure 2 shows the difference in the value of flow when intake runner and air box are applied; the flow will be reduced at some point and further reduced at higher engine load or speed.
0.0 20.0 40.0 60.0 80.0 100.0
Fl
o
w,
c
fm
Valve lift, inch
Flow, cfm vs. Valve lift, inch
Cyl.Head
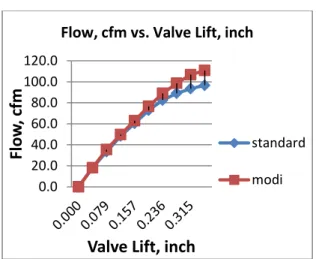
Figure 3: Graph of comparison for Flow, cfm vs. valve lift
The value of flow in intake port is measured in term of cfm (cubic feet per minute). Figure 3 shows that maximum flow the cylinder head can be achieved with variation of valve lift for both standard and modified ports.
The graph also shows that the maximum improvement for flow in the modified cylinder head can reach maximum valve lift at 0.354inch (9mm) with an improvement of 12.7 %, while the lowest is at minimum valve lift at 0.039inch (1mm) with only 1.6 % improvement.
From the experiment, percentages of improvement started to increase drastically at 0.295inch (7.5mm); relatively in real condition, this engine is running at high speed or with heavy load.
When the graph shows an inclination, either starting to decrease in small margin or constantly rising, it shows that the intake port flow pattern has limitation of producing a great flow of air due to maximization of valve lift design or pattern.
This data is important for any engine builder or racer in order to choose the correct degree of camshafts, since for any naturally aspirated engine, combustion chamber that produces a high compression ratio will have a limitation of valve lift to prevent it from in contact with the piston surface. High valve lift also has limitation of producing a high flow of air.
With this method of collecting data, engine designers can determine the best maximum valve lift for their engine cylinder head.
Figure 4: Graph of Cd, discharge coefficient vs. L/D valve lift over diameter
Although increasing the valve lift can increase the air flow, increase in friction causes the reduction of the flow capacity of the intake manifold.
In this study, the valve lift had been examined in the test, and the result showed that the air in the intake port of gasoline engine could be optimized up to specific potential flow, subjected to valve lift to diameter ratio (L/D).
From this experiment, the discharge coefficient was successfully calculated theoretically, whose value varied depending on valve lift to diameter ratio.
√
(1)
Where:
ṁ = mass flow rate ∆P = pressure difference
d = density of air D = valve diameter
Figure 4 shows the graph of discharge coefficient vs L/D, in which the maximum valve lift to diameter ratio (0.29) for modified cylinder head was calculated with 0.94 for discharge coefficient and the lowest one (L/D = 0.032) was 0.15. For the standard cylinder head, the discharge coefficient was 0.82 at maximum valve lift to diameter ratio 0.0
20.0 40.0 60.0 80.0 100.0 120.0
Fl
ow
, cf
m
Valve Lift, inch
Flow, cfm vs. Valve Lift, inch
standard
modi
0.00 0.20 0.40 0.60 0.80 1.00
Cd
, Di
sch
ar
ge
Co
e
ff
ic
ie
n
t
L / D
Cd, Discharge coefficient vs. L / D
STANDARD
and 0.15 value of drag coefficient at the lowest L/D value.
Comparison of average air flow (cfm) by
experimental value
Engine power is directly proportional to the amount of air drawn into the cylinders, and stored until ignition occurs. By reducing the intake air flow resistance and exhaust duct, cylinder filling is improved and thus increasing engine power directly.
The average air flow through each engine cylinder can be estimated as follows:
Average air flow (cfm) = 1.67 x HP per cylinder
(May 2004. SF-600FC FlowBench Operators Manual)
Maximum flow rate of air intake for one cylinder should be about 2.5 times greater than the average air flow to the cylinder, as an acquisition occurs from only 40% of the total cycles.
Exceptions to this rule are the primary valve or through a small, long pass. The test pressure must be kept at minimum to ensure the flow remains turbulent and does not slow down and become laminar.
Comparison of volumetric efficiency by
experimental value
The volumetric efficiency for gasoline burning engines is estimated using:
Volumetric Efficiency = 123 x kW x100% / (RPM x Litre)
(May 2004. SF-600FC FlowBench Operators Manual)
Power, RPM, engine displacement and airflow capacity are associated in a certain way. With the widespread use of engine dynamometer and flow benches function, it has become possible to measure potential air flow engine, maximum power potential, and the RPM at which the power will be heightened. The porting effect and change in the manifold can anticipate in early and correct
camming changes can be made to take full advantage of the difference.
The total air flow through a gasoline engine determines its maximum power. At peak power, a racing engine uses 1.67 cubic feet of air per minute (cfm) for each horsepower it develops.
Estimated engine airflow:
Gasoline, NA engine cfm = 1.67 x HP
(May 2004. SF-600FC FlowBench Operators Manual)
To increase the power output of the engine, the engine air flow capacity must be increased, or the air-fuel charge must burn more efficiently. Racers tend to focus mainly on improving air flow. To draw more air through the engine, intake manifold flow resistance and the cylinder head must be reduced.
Comparison of engine power due to
experiment
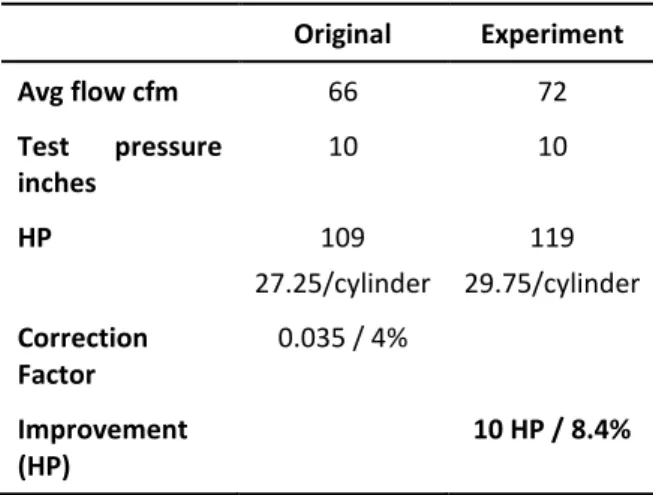
At this level, the engine must also have the maximum compression, the right cam, and an exhaust system. With this formula, at maximum flow through the intake system by 1cfm of water, the engine can gain 0.27 horsepower per cylinder.
HP = 0.27 x (avg test flow cfm) x (25 / test pressure inches)^0.5
(May 2004. SF-600FC FlowBench Operators Manual)
Table 4: Improvement of engine power after modification
Original Experiment
Avg flow cfm 66 72
Test pressure
inches
10 10
HP 109
27.25/cylinder
119 29.75/cylinder
Correction Factor
0.035 / 4%
Improvement (HP)
Comparison of engine speed for peak power
due to experiment
RPM = 1265 (avg test flow cfm) x (25/ test pressure inches)^0.5 /CID per cylinder
(May 2004. SF-600FC Flowbench Operators Manual)
Table 5: Improvement of engine speed for peak power
Original Experiment
Avg flow cfm 66 72
Test pressure
inches
10 10
CID 1.6 liter
97.64 CID 24.4/ cyl
1.6 liter 97.64 CID 24.4/ cyl
RPM 5750 6267
Correction factor 0.059 / 6% 0.059 / 6%
Improvement 517 RPM /
8.2%
C
ONCLUSIONThe increase in flow from the modified head is due to the occurrence of the flow in the intake port. The larger section area of port together with the small cross section near the intake valve causes the velocity to increase, which aids in keeping the mixture in suspension. The modified port has performed throughout the entire lift range. This is due to the air flowing in the port and also the flow quality resulting from the roof or wall of the port being enlarged, causing more areas for the flow to occur. It can be concluded that the newly designed or modified cylinder provides a superior flow and air quality compared to the original cylinder head.
A
CKNOWLEDGEMENTThe authors acknowledge the financial support from Universiti Teknologi Malaysia (UTM) under the research university grant Q.J130000.2509.08H93.
R
EFERENCES[1] Selvara, B.SNS., Indraprakash, G., Senthilkumar, A. and Arvind P., 2011. Effects of Intake Port Geometry on the Performance of an SI Engine. JSAE 20119506 / SAE 2011-32-0506.
[2] Badih, J. and Selin, A, 2013.Cylinder Head Intake Flow Analysis.SAE 2013-01-1409
[3] Yingjin, C.W., Randall, G.S. and Jain, S.K., 1998. Cylinder-to-Cylinder Variation of Losses in Intake Regions of in IC Engines. SAE 1998-02-23.
[4] Cheung, R.S.W, Nadarajah, S., Tindal, M.J. and Yianneskis, M., 1990. An Experimental Study of Velocity and Reynolds Stress Distributions in a Production Engine. SAE 1990-02-01.