VOLUME 17 ISSUE 2
(2019), Page 302 – 311
PERSONAL EMPOWERMENT AS DETERMINANTS OF
ORGANISATIONAL OPPORTUNITY
Aisyah Abu Bakar
1, Mariana Mohamed Osman
2& Muhammad Faris Abdullah
31,2,3
Kulliyyah of Architecture and Environmental Design
INTERNATIONAL ISLAMIC UNIVERSITY MALAYSIA
Abstract
Architects can influence workplace behaviours and manoeuvre workers’
emotions through aligning design strategies with human moods. Design sustains
organisational well-being through strengthening space occupants’ empowerment,
leading to better work performances.
Issue: Existing research has limited
empirical evidence on the impact of personal empowerment (PE) on
organisational opportunity (OO).
Purpose: This paper aims to verify the
statistical predictability of OO based on PE. Approach: Multiple Correlation and
Multiple Linear Regression were carried out to assess linear associations and
parameters of linear equations to predict OO components based on PE items.
Findings: OO components were predictable by the majority of the PE items and
‘monitoring behaviours to suit with situation’ was the strongest predictor of OO.
INTRODUCTION
Human interdependence with other humans (HIH) plays a big part in architectural
psychology as designers now gain a new set of criteria in improving emotional
aspects of spatial designs. HIH is one of the potent causes of subjective
sustainable well-being (SSWB). Personal empowerment (PE) and organisational
opportunity (OO) are dimensions of HIH. Space qualities have a tremendous
impact on occupants’ way of thinking, patterns of actions and, thus promote PE,
leading to improved concentration, willingness to act, and ultimately, OO. Over
time, extensive literature have discussed the positive effect of PE on OO. This
paper assesses the statistical predictability of OO based on PE.
LITERATURE REVIEW
Case studies based on articles from selected Asian Journals from the year 2011
onwards highlight conditional factors and potential determinants of OO. Table 1
summarises these findings.
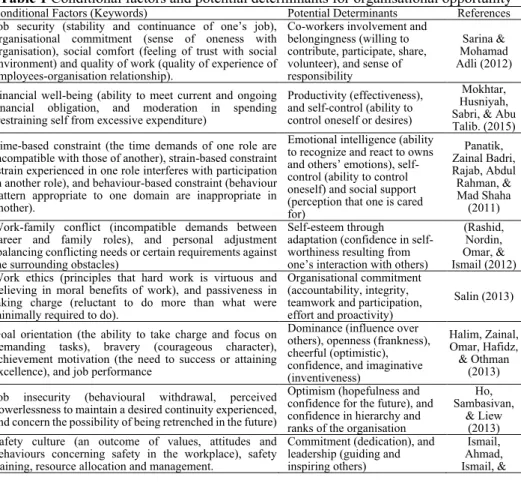
Table 1
Conditional factors and potential determinants for organisational opportunity
Conditional Factors (Keywords) Potential Determinants ReferencesJob security (stability and continuance of one’s job),
organisational commitment (sense of oneness with organisation), social comfort (feeling of trust with social environment) and quality of work (quality of experience of employees-organisation relationship).
Co-workers involvement and belongingness (willing to contribute, participate, share, volunteer), and sense of responsibility
Sarina & Mohamad Adli (2012)
Financial well-being (ability to meet current and ongoing financial obligation, and moderation in spending (restraining self from excessive expenditure)
Productivity (effectiveness), and self-control (ability to control oneself or desires)
Mokhtar, Husniyah, Sabri, & Abu Talib. (2015) Time-based constraint (the time demands of one role are
incompatible with those of another), strain-based constraint (strain experienced in one role interferes with participation in another role), and behaviour-based constraint (behaviour pattern appropriate to one domain are inappropriate in another).
Emotional intelligence (ability to recognize and react to owns
and others’ emotions), self -control (ability to -control oneself) and social support (perception that one is cared for) Panatik, Zainal Badri, Rajab, Abdul Rahman, & Mad Shaha (2011) Work-family conflict (incompatible demands between
career and family roles), and personal adjustment (balancing conflicting needs or certain requirements against the surrounding obstacles)
Self-esteem through adaptation (confidence in self-worthiness resulting from
one’s interaction with others)
(Rashid, Nordin, Omar, & Ismail (2012) Work ethics (principles that hard work is virtuous and
believing in moral benefits of work), and passiveness in taking charge (reluctant to do more than what were minimally required to do).
Organisational commitment (accountability, integrity, teamwork and participation, effort and proactivity)
Salin (2013)
Goal orientation (the ability to take charge and focus on demanding tasks), bravery (courageous character), achievement motivation (the need to success or attaining excellence), and job performance
Dominance (influence over others), openness (frankness), cheerful (optimistic), confidence, and imaginative (inventiveness)
Halim, Zainal, Omar, Hafidz, & Othman
(2013)
Job insecurity (behavioural withdrawal, perceived powerlessness to maintain a desired continuity experienced, and concern the possibility of being retrenched in the future)
Optimism (hopefulness and confidence for the future), and confidence in hierarchy and ranks of the organisation
Ho, Sambasivan,
& Liew (2013) Safety culture (an outcome of values, attitudes and
behaviours concerning safety in the workplace), safety training, resource allocation and management.
Commitment (dedication), and leadership (guiding and inspiring others)
Janipha (2012) Sense of empowerment given to employees in relation to
freedom to perform, and positive emotions translated in job satisfaction.
Competence (capability and efficiency) and task meaningfulness
Aziz & Ennew (2013)
Social-oriented achievement (an inclination to achieve a standard of excellence set by significant others (e.g. teachers, parents) that is pursued and evaluated according to the ways and the standards determined by others)
Security (the state of feeling safe) and conformity (behaving in accordance to accepted conventions or standards set by society)
Liem, Martin, Porter, & Colmar 2012)
The findings from the case studies generate three significant components
of OO: (i) Fluency and Versatility (OOa), (ii) Encouraging Interaction (OOb) and
(iii) Collaborative Engagement (OOc).
Table 2
Components and determinants of organisational opportunity
Definition of OO Components Indicators Code
Optimism and openness expressed in exchange ideas and encouraging interactions that insinuate hope and positive prospect for the future in the working
environment
Fluency and
Versatility sense of clarity and understand of tasks and roles at work OOa flexible in handling different work roles and diverse tasks
Encouraging Interaction
sharing the same stance with my co-workers motivating and assisting co-workers at their work cherishing co-workers’ accomplishments
OOb valuing ideas and suggestions from co-workers
Collaborative Engagement
being engaged in decision-making process delivering ideas and suggestion constructively
OOc sharing skills and knowledge eagerly with co-workers
optimistic with the hierarchy at the organisation
Personal Empowerment (PE) manifests in the opportunity to exercise
control, voice and choice with regards to social surroundings. Qualities adhere to
PE include (i) self-motivation with regards to goal orientation, autonomy and
self-regulation (Fatimah, Lukman, Khairudin, Wan Shahrazad, & Halim, 2011;
Chin, Khoo, & Low, 2012; Kok, 2016), (ii) social acceptance and coherence with
others (Fatimah et al., 2011; Nesbit, Jepsen, Demirian, & Ho, 2012; Kadir, Omar,
Desa, & Yusooff, 2013; Zamani, Khairudin, Sulaiman, Halim, & Nasir, 2013),
and (iii) composure, stability and resilience (Sulaiman, Kadir, Halim, Omar,
Latiff, & Sulaiman, 2013; Sipon, Nasrah, Nazli, Abdullah, & Othman, 2014).
Table 3
Determinants of personal empowerment
Definition of PE Indicators Code
Self-esteem in taking control over life along with sense of composure to progress in the social
environment
setting goals and striving to meet goals PE1 striving and working hard even for easy goals PE2 monitoring behaviours to suit with situations PE3
knowing when somebody is offended PE4
Based on theoretical underpinnings, the research hypothesize that OO
components are predictable by PE. The following sections provide empirical
evidence the predictability of OOa, OOb and OOc based on PE items.
METHOD
A sample of 4,315 was gathered after the data screening process. The Malaysian
respondents were given an 11-point Likert scale to respond to questionnaire items
which include the components of OO and the ten PE items. Pearson correlation
analyses were conducted to observe if there were linear associations between the
OO components and PE items. Ensuing correlation analyses, multiple linear
regression analyses were conducted to estimate parameters of the linear equations
used to predict values of OOa, OOb and OOc from PE items.
RESULTS AND
DISCUSSION
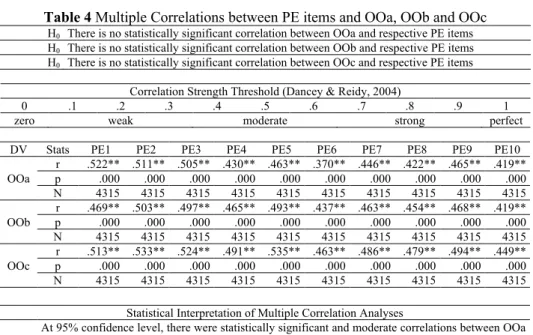
At 95% confidence level, there were statistically significant positive correlations
between (i) OOa and each of PE items, (ii) OOb and each of PE items, and (iii)
OOc and each of PE items. The null hypotheses claiming there are no statistically
significant correlations between (i) OOa and respective PE items, (ii) OOb and
respective PE items, and (iii) OOc and respective PE items were all rejected.
Table 4
Multiple Correlations between PE items and OOa, OOb and OOc
H0 There is no statistically significant correlation between OOa and respective PE itemsH0 There is no statistically significant correlation between OOb and respective PE items
H0 There is no statistically significant correlation between OOc and respective PE items
Correlation Strength Threshold (Dancey & Reidy, 2004)
0 .1 .2 .3 .4 .5 .6 .7 .8 .9 1
zero weak moderate strong perfect
DV Stats PE1 PE2 PE3 PE4 PE5 PE6 PE7 PE8 PE9 PE10
OOa
r .522** .511** .505** .430** .463** .370** .446** .422** .465** .419** p .000 .000 .000 .000 .000 .000 .000 .000 .000 .000 N 4315 4315 4315 4315 4315 4315 4315 4315 4315 4315
OOb
r .469** .503** .497** .465** .493** .437** .463** .454** .468** .419** p .000 .000 .000 .000 .000 .000 .000 .000 .000 .000 N 4315 4315 4315 4315 4315 4315 4315 4315 4315 4315
OOc
r .513** .533** .524** .491** .535** .463** .486** .479** .494** .449** p .000 .000 .000 .000 .000 .000 .000 .000 .000 .000 N 4315 4315 4315 4315 4315 4315 4315 4315 4315 4315
Statistical Interpretation of Multiple Correlation Analyses
OOa
At 95% confidence level, there were statistically significant and moderate correlations between OOa and (i) PE1 (r =.522, p = .000); (ii) PE2 (r =.511, p = .000); (iii) PE3 (r =.505, p = .000); (iv) PE4 (r =.430, p = .000); (v) PE5 (r =.463, p = .000); (vi) PE6 (r =.370, p = .000); (vii) PE7 (r =.446, p = .000); (viii) PE8 (r =.422, p = .000); (ix) PE9 (r =.465, p = .000); (x) PE10 (r =.419, p = .000).
OOb
OOc
At 95% confidence level, there were statistically significant and moderate correlations between OOc and (i) PE1 (r =.513, p = .000); (ii) PE2 (r =533, p = .000); (iii) PE3 (r =.524, p = .000); (iv) PE4 (r =.491, p = .000); (v) PE5 (r =.535, p = .000); (vi) PE6 (r =.463, p = .000); (vii) PE7 (r =.486, p = .000); (viii) PE8 (r =.479, p = .000); (ix) PE9 (r =.494, p = .000); (x) PE10 (r =.449, p = .000).
Three (3) multiple regression analyses were carried out to predict the
values of each of dependent variables (i) OOa, (ii) OOb and (iii) OOc given the
set of PE explanatory variables (PE1, PE2, PE3, PE4, PE5, PE6, PE7, PE8, PE9,
and PE10).
Table 5
Multiple Linear Regression
–
PE predicting OOa
H0There will be no significant prediction of OOa by PE1, PE2, PE3, PE4, PE5, PE6, PE7, PE8, PE9 and PE10
Model Summary
Model R R Square Adjusted R Square Std. Error of the Estimate Durbin-Watson
1 .590 .348 .346 1.33143 1.756
ANOVA
Model Sum of
Squares df Mean Square F Sig.
Regression 4066.801 10 406.680 229.413 .000
Residual 7629.699 4304 1.773
Total 11696.500 4314
Coefficients
Model
Unstandardised
Coefficients Standardised Coefficients
t Sig.
95.0% Confidence Interval for B
B Error Std β Lower Bound Bound Upper
(Constant) 2.842 .127 22.381 .000 2.593 3.091
PE1 .192 .020 .206 9.487 .000 .152 .231
PE2 .074 .023 .075 3.201 .001 .029 .119
PE3 .133 .020 .136 6.557 .000 .094 .173
PE4 .022 .021 .021 1.011 .312 -.020 .064
PE5 .108 .021 .109 5.127 .000 .067 .149
PE6 -.024 .020 -.023 -1.210 .226 -.063 .015
PE7 .067 .023 .069 2.977 .003 .023 .111
PE8 -.071 .024 -.074 -2.957 .003 -.118 -.024
PE9 .110 .023 .116 4.740 .000 .065 .156
PE10 .060 .019 .068 3.227 .001 .023 .096
A multiple regression was generated to predict OOa based on PE items.
R value of .590 indicated an acceptable level of prediction (R > 0.5). The
Durbin-Watson statistic was 1.756 which is between 1.5 and 2.5 and therefore the data
was not autocorrelated. A significant regression equation was found, F (10, 4304)
= 229.413, p = .000, with an R
2of .348; indicating that the proportion of variance
in OOa that can be explained by PE items was 34.8%.
5.127, p = .000), PE7 (B = .067, t = 2.977, p = .000), PE8 (B = -.071, t = -2.957,
p = .003), PE9 (B = .110, t = 4.740, p =.000) and PE10 (B = .060, t = 3.227, p
=.001) were significant predictors of OOa. On the contrary, it was found that PE4
(B = .022, t = 1.011, p =.312) and PE6 (B = -.024, t = -1.210, p =.226) were not
significant predictors of OOa.
Personal Empowerment (PE) items account for 34.8% of Fluency and
Versatility (OOa). Eight (8) of PE items were significant predictors of OOa.
Table 6
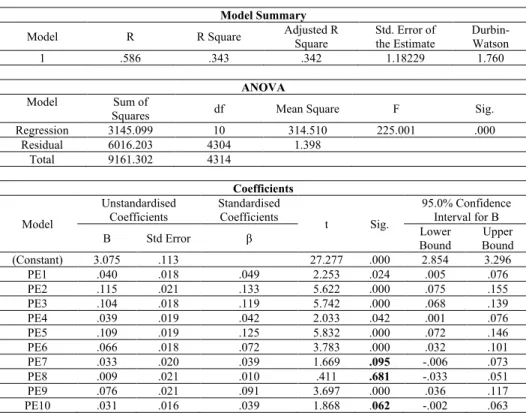
Multiple Linear Regression
–
PE predicting OOb
H0There will be no significant prediction of OOb by PE1, PE2, PE3, PE4, PE5, PE6, PE7, PE8, PE9 and PE10
Model Summary
Model R R Square Adjusted R Square Std. Error of the Estimate Durbin-Watson
1 .586 .343 .342 1.18229 1.760
ANOVA
Model Sum of
Squares df Mean Square F Sig.
Regression 3145.099 10 314.510 225.001 .000
Residual 6016.203 4304 1.398
Total 9161.302 4314
Coefficients
Model
Unstandardised Coefficients
Standardised Coefficients
t Sig.
95.0% Confidence Interval for B
B Std Error β Lower Bound Bound Upper
(Constant) 3.075 .113 27.277 .000 2.854 3.296
PE1 .040 .018 .049 2.253 .024 .005 .076
PE2 .115 .021 .133 5.622 .000 .075 .155
PE3 .104 .018 .119 5.742 .000 .068 .139
PE4 .039 .019 .042 2.033 .042 .001 .076
PE5 .109 .019 .125 5.832 .000 .072 .146
PE6 .066 .018 .072 3.783 .000 .032 .101
PE7 .033 .020 .039 1.669 .095 -.006 .073
PE8 .009 .021 .010 .411 .681 -.033 .051
PE9 .076 .021 .091 3.697 .000 .036 .117
PE10 .031 .016 .039 1.868 .062 -.002 .063
A multiple regression was generated to predict OOb based on PE items.
R value of .586 indicated an acceptable level of prediction (R > 0.5). The
Durbin-Watson statistic was 1.760 which is between 1.5 and 2.5 and therefore the data
was not autocorrelated. A significant regression equation was found, F (10, 4304)
= 225.001, p = .000, with an R
2of .343; indicating that the proportion of variance
in OOb that can be explained by PE items was 34.3%.
=.000) and PE9 (B = .076, t = 3.697, p =.000) were significant predictors of OOb.
On the contrary, it was found that PE7 (B = .033, t = 1.669, p = .095), PE8 (B =
.009, t = .411, p = .681) and PE10 (B = .031, t = 1.868, p =.062) were not
significant predictors of OOb.
Personal Empowerment (PE) items account for 34.3% of Encouraging
Interaction (OOb). Seven (7) of PE items were significant predictors of OOa.
Table 7
Multiple Linear Regression
–
PE predicting OOc
H0There will be no significant prediction of OOc by PE1, PE2, PE3, PE4, PE5, PE6, PE7, PE8, PE9 and PE10
Model Summary
Model R R Square Adjusted R Square Std. Error of the Estimate Durbin-Watson
1 .625 .390 .389 1.22692 1.714
ANOVA
Model Sum of
Squares df Mean Square F Sig.
Regression 4150.512 10 415.051 275.719 .000
Residual 6478.993 4304 1.505
Total 10629.505 4314
Coefficients
Model
Unstandardised
Coefficients Standardised Coefficients
t Sig.
95.0% Confidence Interval for B
B Std Error β Lower Bound Bound Upper
(Constant) 2.242 .117 19.161 .000 2.012 2.471
PE1 .090 .019 .101 4.824 .000 .053 .126
PE2 .108 .021 .115 5.057 .000 .066 .149
PE3 .099 .019 .106 5.289 .000 .062 .136
PE4 .029 .020 .029 1.480 .139 -.010 .068
PE5 .162 .019 .172 8.331 .000 .124 .200
PE6 .065 .018 .066 3.583 .000 .030 .101
PE7 .022 .021 .024 1.066 .286 -.019 .063
PE8 .012 .022 .014 .563 .574 -.031 .056
PE9 .072 .021 .080 3.377 .001 .030 .114
PE10 .052 .017 .061 3.020 .003 .018 .085
A multiple regression was generated to predict OOa based on PE items.
R value of .625 indicated an acceptable level of prediction (R > 0.5). The
Durbin-Watson statistic was 1.714 which is between 1.5 and 2.5 and therefore the data
was not autocorrelated. A significant regression equation was found, F (10, 4304)
= 275.719, p = .000, with an R
2of .390; indicating that the proportion of variance
in OOc that can be explained by PE items was 39%.
OOc. On the contrary, it was found that PE4 (B = .029, t = 1.480, p = .139.), PE7
(B = .022, t = 1.066, p = .286) and PE8 (B = .012, t = .563, p = .574.) were not
significant predictors of OOc.
Personal Empowerment (PE) items account for 34.8% of Collaborative
Engagement (OOc). Sevent (7) of PE items were significant predictors of OOc.
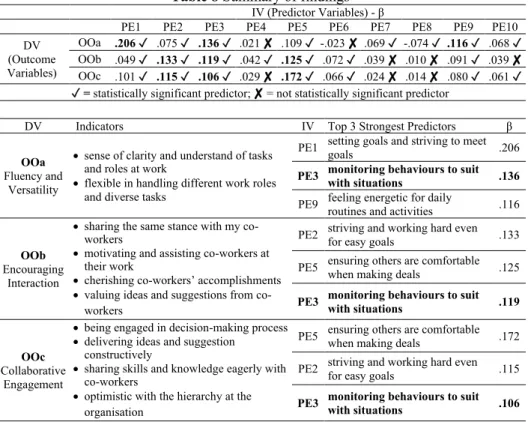
Table 8
Summary of findings
IV (Predictor Variables) - βPE1 PE2 PE3 PE4 PE5 PE6 PE7 PE8 PE9 PE10
DV (Outcome Variables)
OOa .206✓ .075 ✓ .136✓ .021 ✘ .109 ✓ -.023 ✘ .069 ✓ -.074 ✓ .116✓ .068 ✓ OOb .049 ✓ .133 ✓ .119 ✓ .042 ✓ .125 ✓ .072 ✓ .039 ✘ .010 ✘ .091 ✓ .039 ✘ OOc .101 ✓ .115✓ .106 ✓ .029 ✘ .172 ✓ .066 ✓ .024 ✘ .014 ✘ .080 ✓ .061 ✓ ✓ = statistically significant predictor; ✘ = not statistically significant predictor
DV Indicators IV Top 3 Strongest Predictors β
OOa Fluency and
Versatility
•sense of clarity and understand of tasks and roles at work
•flexible in handling different work roles and diverse tasks
PE1 setting goals and striving to meet goals .206
PE3 monitoring behaviours to suit with situations .136
PE9 feeling energetic for daily routines and activities .116
OOb Encouraging
Interaction
•sharing the same stance with my co-workers
•motivating and assisting co-workers at their work
•cherishing co-workers’ accomplishments
•valuing ideas and suggestions from co-workers
PE2 striving and working hard even for easy goals .133
PE5 ensuring others are comfortable when making deals .125
PE3 monitoring behaviours to suit with situations .119
OOc Collaborative
Engagement
•being engaged in decision-making process •delivering ideas and suggestion
constructively
•sharing skills and knowledge eagerly with co-workers
•optimistic with the hierarchy at the organisation
PE5 ensuring others are comfortable when making deals .172
PE2 striving and working hard even for easy goals .115
PE3 monitoring behaviours to suit with situations .106