339
The Influence of Genetics on Economic Efficiency
of Broiler Chickens Growth
Adela Marcu
1, Ioan Vacaru-Opri
ş
2, Gabi Dumitrescu
1, Liliana Petculescu Ciochin
ă
1,
Adrian Marcu
3, Marioara Nicula
1, Ioan Pe
ţ
1, Dorel Dronca
1, Bartolomeu Kelciov
3,
Cosmin Mari
ş
31
Faculty of Animal Sciences and Biotechnologies-300645, Timisoara, Aradului Street, No 119, Romania
2
Faculty of Animal Sciences, 700490-Iasi, M. Sadoveanu Street, No 3, Romania
3
S.C.LUCKY VET SRL, 300222-Timisoara, Lorena Street, No 98, Romania
Abstract
In this paper was studied the genetic effect on economic efficiency of broiler chickens growth, reared in intensive system on period of 42 days. The genetic material was represented of broiler chickens that belonged the hybrids
„Ross-308” and „Cobb-500” with two groups („Ross-308”, LC-control group and „Cobb 500”, L1-experimental
group). In the growth periods (starter, growth and finisher) chickens have received compound feed ad libitum with nutritional characteristics conforming to recommendations of the Aviagen Company. Broiler chickens and compound feed were weighed on each pen at: 1, 7, 14, 21, 28, 35 and 42 days, and was calculated: body weight gain (BWG), average daily gain (ADG) feed conversion ratio (FCR). Mortality was recorded daily. Thus, at the end of each growth period (14, 35 and 42 days), were calculated values for European Broiler Index (EBI) and European
Production Efficiency Factor (EPEF). The highest values for EBI and EPEF were obtained at L1, and at LC situation
was reversed. The economic efficiency of broiler chickens growth was positively influenced by the growth performance (BW, ADG and FCR) and the recorded viability. Although, the genotypes studied were reared under
identical condition, the hybrid „Cobb-500” to registered slightly higher values for indices studied (P≤0.05),
compared to the hybrid „Ross-308”.
Keywords: broiler chicken, genetic, growth performance.
1. Introduction
Poultry is a sector of animal husbandry and constitutes an important component for agriculture of all countries. Measurement of the efficiency of broiler chicken production is an important issue for developing countries such as Romania.
Raising chickens for meat can be a profitable business in the conditions of modern technology and if the biological material used is good quality. The growth efficiency of broilers is influenced by improving growth performance: body weight
* Corresponding author: Adela Marcu,
tel:+40 256 277 159, Fax: +40 256 277 110,
E-mail: [email protected]
(BW), average daily gain (ADG) and feed conversion rate (FCR).
The FCR is a major factor in reducing production cost and improving the broilers growth efficiency. Cost feed represent about 70% of the cost of production broilers, nevertheless the feed utilization efficiency has not kept up with the growth rate of broilers [1]. Pym [2] in genetic studies has shown that FCR could be improved by selection on growth, because feed intake is a heritable trait.
340 broilers and were obtained lower production costs [4].
Some studies show that selection for improving feed efficiency has profound effects on nutritional physiology [5], and other researchers have shown that some physiological characteristics of digestion may influence on feed conversion efficiency [6].
The researches of genetic and nutrition had demonstrated the positive correlation between the proportion of protein and energy retained with feed efficiency [7, 8].
The feed efficiency is a major criterion for defining the performances to broiler chickens. In Europe, for calculation of feed efficiency is used ratio between feed intake and weight gain. In broilers highest proportion from feed ingested are used for growth because for maintenance function have low requirements. Therefore, feed efficiency is very good in broilers which induced decreased FCR value [9].
Leeson et al. [9] proposed an indicator of feed efficiency by calculating the cost of feed/kg live weight, which is more relevant in comparison with energy efficiency.
Due to rising price at raw materials and ingredients from compound feed, currently are required cost optimized for nutrition segment and improving the growing efficiency of broilers. Feeding broiler chickens with low quality food has determined increasing feed intake and growth performances (e.g. BW, ADG, FCR) were negatively affected, while situation was reverse if the high-quality food were used [10].
Vieira and Angel [11] demonstrated that an important factor on growth performances of broilers is amino acid concentration in the diet. Thus, feed with high amino acid density has been shown to have some positives effects on growth performances of broilers, especially if had administered in first growing period [11-13]. But the same authors mention that an increase in the concentration of amino acids in the diet should be correlated with feed cost and the market cost of chicken meat [11-13].
Genetic selection of broilers for a higher growth rate may be the method for productivity increase. But, in other studies was been shown that this selection type may to decrease the resistance to diseases and increased the percentage of mortality [14].
The health of broilers influences feed intake and growth performance (e. g. BW, ADG and FCR). As a result of those presented the aim this work was to study the genotype influence on growth performance of broilers, reared in identical condition. At the same time was pursued how those genotypes have used local raw materials used in composition of combined feed.
2. Materials and methods
This study was made on broiler chickens reared in intensive system a period of 42 days. The biological material was represented by commercial hybrids „Ross-308” and „Cobb-500”. Broilers were distributed in two groups: LC
-control group („Ross-308” genotype) and L1
-experimental group („Cobb-500” genotype), with 10 pens for each genotype.
The growth system was on the deep litter with a density of 12 chick/m2. The growth technological
system was in accordance with new European Union regulation on animal welfare compulsory from 2012 in all EU member states [15]. In the growth period (1 d to 42 d) for microclimate factors from house (air temperature and air relative humidity), the values were conforming to the recommendations found in the „Broiler Management Manual Ross-308, 2009” [16]. The lighting schedule was different depending the chickens age (24 h light from 1 d to 7 d; 23 h light: 1 h dark from 8 d to 35 d-with dark periods on the night time and 24 h light from 36 d to 42 d).
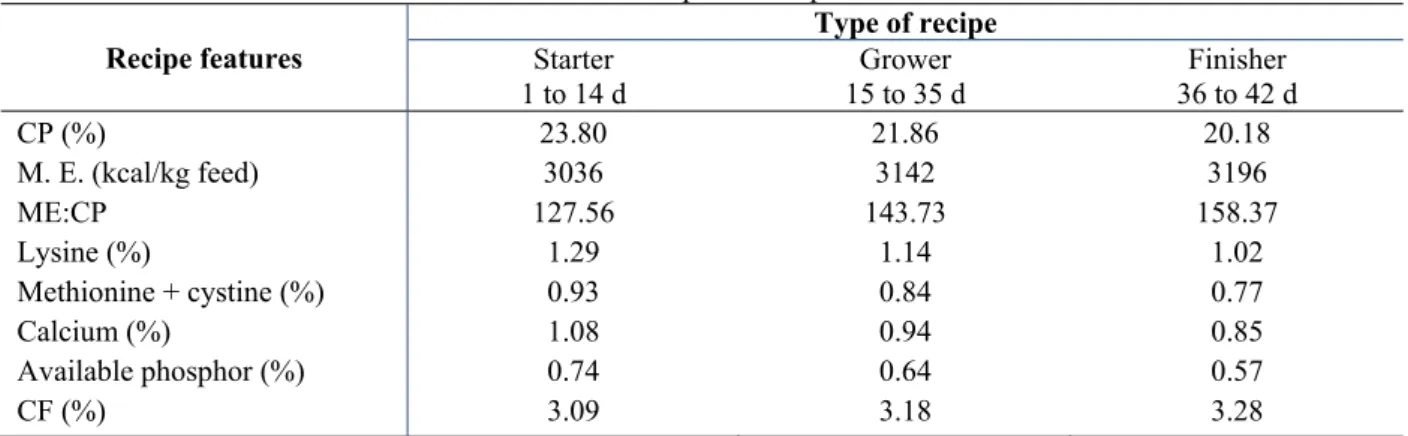
At the two chicken groups were given feed mixed with protein and energy levels in conforming to recommendation of the Aviagen company for the „Ross-308” hybrid [16]. The three growth periods conducted, were: starter, from 1 d up to 14 d; growth, from 15 d up to 35 d and finishing, from 36 d up to 42 d [16]. Depending on the age of chickens during the growth period (1 d to 42 d) at each chickens group were given three recipes of compound feed: starter, grower and finisher (Table 1) [12, 17].
341
Broiler Index (EBI) [18] and European Production Efficiency Factor (EPEF) [16, 18].
Table 1. Features of feed compound recipes for broiler chickens
Recipe features
Type of recipe
Starter
1 to 14 d 15 to 35 d Grower 36 to 42 d Finisher
CP (%)
M. E. (kcal/kg feed) ME:CP
Lysine (%)
Methionine + cystine (%) Calcium (%)
Available phosphor (%) CF (%)
23.80 3036 127.56
1.29 0.93 1.08 0.74 3.09
21.86 3142 143.73
1.14 0.84 0.94 0.64 3.18
20.18 3196 158.37
1.02 0.77 0.85 0.57 3.28
CP (g/kg feed)-crude protein; ME (kcal/kg feed)-metabolizable energy; ME:CP-metabilizable energy: crude protein ratio (kcal/ 1 g protein); CF-Crude fiber (%).
Broiler chickens and compound feed were weighed on each pen at: 1, 7, 14, 21, 28, 35 and 42 d, and was calculated: body weight gain (BWG), average daily gain (ADG), feed intake for each growth period, feed conversion ratio (FCR). Mortality was recorded daily and with obtained data was calculated the percentage of viability. For analysis of performance indicators such as: BWG, ADG, FCR, viability, EPEF and EBI the following formulas were used:
BWG (grams on period) = BW (g) at the end period - BW (g) in first d;
ADG (g/chick/d) = BWG/days number of growth period;
FCR (kg feed/kg gain) = cumulative feed intake (kg)/total weight gain (kg);
Viability (%) = chicks remaining at the end of period (%);
European Production Efficiency Factors (EPEF)
EPEF = %
/ x 100
European Broiler Index (EBI)
EBI = % / /
/
In finally was calculated feed cost (€/kg feed) using purchase price of raw materials from recipe structure. Knowing feed intake on growth periods, BWG, FCR and compound feed cost was calculated the feed cost/kg live weight (€/kg BW), the feed cost/chick (€/chick) and feed cost/m2
house.
Raw data obtained from measurements were processed using methods of biostatistics with
Microsoft Excel spreadsheet application. To test the statistical significance of differences between mean values of the characters studied, analysis of variance using test ANOVA from the program MINITAB 14 was applied [19, 20].
3. Results and discussion
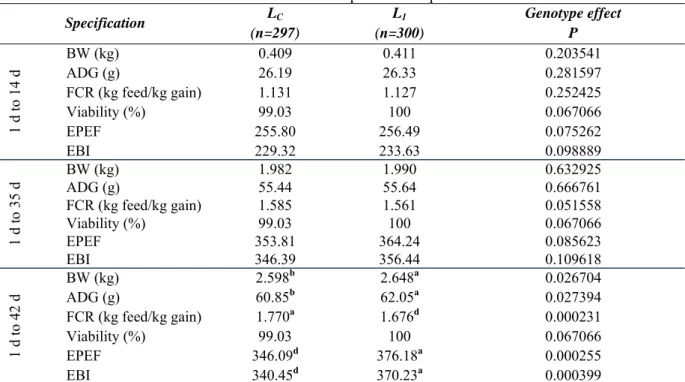
The data referring to growth performance of broiler chickens from this study are shown in Table 2.
Analysis of performance data (e.g. BW, ADG, FCR and mortality) are essential to calculate economic efficiency of broilers growth.
BW in broilers from LC group was of: 0.409 kg at
14 d; 1.982 kg at 35 d and 2.598 kg at 42 d, while at L1 group the values were greater with 0.49%,
0.40%, and 1.92% respectively.
With data for BW was calculated ADG on three periods growth (1 d to 14 d; 1 d to 35 d, and respectively 1 d to 42 d). ADG expressed in g/chick/d is ratio between BWG and day’s number from growth period and was from 26.19 (to LC, on
period 1 d to 14 d) up to 62.05 (to L1, on period 1
d to 42 d). Broilers from L1 group had higher
values compared to LC group at differences of
+0.53%, +0.36%, and respectively +1.97%.
The differences between chicken groups studied (L1 and LC) were statistically significant only for
BW at 42 d (P≤0.05) and for ADG from total growth period (P≤0.05).
342
groups (LC and L1) have presented a progressive dynamics in parallel with age.
Table 2. The values for performance parameters
Specification LC
(n=297)
L1
(n=300)
Genotype effect P
1
d t
o 1
4
d
BW (kg) 0.409 0.411 0.203541
ADG (g) 26.19 26.33 0.281597
FCR (kg feed/kg gain) 1.131 1.127 0.252425
Viability (%) 99.03 100 0.067066
EPEF 255.80 256.49 0.075262
EBI 229.32 233.63 0.098889
1
d t
o 3
5
d BW (kg) ADG (g) 1.982 55.44 55.64 1.990 0.632925 0.666761
FCR (kg feed/kg gain) 1.585 1.561 0.051558
Viability (%) 99.03 100 0.067066
EPEF 353.81 364.24 0.085623
EBI 346.39 356.44 0.109618
1
d t
o 4
2
d
BW (kg) 2.598b 2.648a 0.026704
ADG (g) 60.85b 62.05a 0.027394
FCR (kg feed/kg gain) 1.770a 1.676d 0.000231
Viability (%) 99.03 100 0.067066
EPEF 346.09d 376.18a 0.000255
EBI 340.45d 370.23a 0.000399
Means followed by different letters in the same row are statistically different: ab significant differences (P 0.05);
ad high significant differences (P 0.001) by test ANOVA;
n-number of chicken; BW-body live weight; ADG-average daily gain; FCR-feed conversion ratio;
EPEF-European Production Efficiency Factor; EBI-European Broiler Index
The data obtained in this study were compared to the standard values for hybrids Ross-308 [21] and Cobb-500 [22]. Therefore, in Figure 1 and 2 were shown graphically the comparative values (LC vs.
standard Ross-308 and L1 vs. standard Cobb-500)
on the different period age (14 d; 35 d, and 1-42 d).
Figure 1. BW at broiler chickens from experience compared to the standard values for hybrids
Ross-308 [21] and Cobb-500 [22]
The values recorded in this study were slightly lower compared with the standard Ross-308 [21], respectively Cobb-500 [22]. Thus, the LC group
has accomplished more than 93.5% of hybrid performance Ross-308, while L1 had a lower
difference of -2.36% to BW and -2.39% to ADG compared to the standard hybrid Cobb-500.
Figure 2. ADG at broiler chickens from experience compared to the standard values for hybrids
Ross-308 [21] and Cobb-500 [22]
14 d 35 d 42 d
LC 409 1982 2598
Ross-308 473 2113 2768
L1 411 1990 2648
Cobb-500 456 2050 2712
0 1000 2000 3000
BW (k
g)
age (d)
LC Ross-308 L1 Cobb-500
1-14 d 1-35 d 1-42 d
LC 26,19 55,44 60,85
Ross-308 30,78 59,17 64,9
L1 26,33 55,64 62,05
Cobb-500 29,57 57,37 63,57
0 20 40 60
ADG (g/chick/d)
period (d)
343 Similar data was obtained by Marcu et al [23-25] who studied growth performance to hybrids Arbor Acres, Lohmann Meat and Hubbard F15. Therefore, broilers received identical recipes of compound feed, BW and ADG values for 42 d age were with slightly over 90% of standard performance for hybrids studied [23-25].
FCR to 14 d, 35 d and 42 d has registered lower values at L1 group (1.127, 1.577, and 1.676
respectively) and higher values at LC group
(1.131, 1.584, and 1.77 respectively). There were not statistical differences (P>0.05) between average values of the two groups (LC vs. L1) to 14
d and 35 d, but to 42 d were high significant differences (P≤0.001).
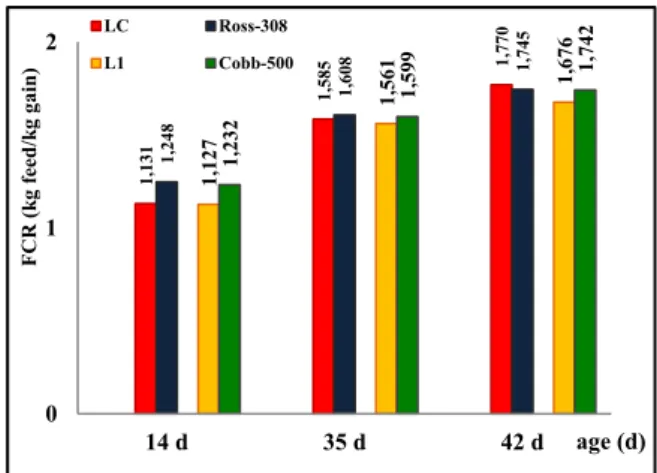
Efficiency of feed measured by FCR (kg feed/kg gain) from LC group and L1 group compared with
the standard values for commercial hybrids Ross-308 [21] and Cobb-500 [22] it was graphically represented in Figure 3. Mention that, in this case, to make a fair comparison, standard values were corrected as the ratio of cumulative feed intake and BWG of each period evaluated.
Figure 3. FCR in broiler chickens from experience compared to the standard values for hybrids
Ross-308 [21] and Cobb-500 [22]
In Figure 3 is observed that the calculated values for FCR were close to the standard values of studied hybrids [21, 22]. Thus, at the two chickens groups (LC and L1) the calculated values for FCR
to 14 d, 35 d and 42 d had registered differences which ranged from +1.43% up to -9.38% (e.g. to LC had ranged from +1.43% to -9.38% and at L1
from -2.38% to -8.52%). Therefore, the differences at the end of starter period (14 d) have recorded maximum values (to LC -9.38% and for
L1 -8.52%), but during growing and finisher
period the FCR gradually increased up to 1.770 to LC and 1.676 to L1, and differences were
decreased (+1.43%, and -3.79% respectively). Data presented in Figure 3 shown a good feed efficiency at the broilers from this study (LC and
L1). Whether, for chickens from L1 group, FCR
recorded was smaller than standard values to hybrid Cobb-500, in case of broilers from LC
group the FCR value had slightly exceeded (+1.43%) standard level for hybrid Ross-308. Therefore, we can say that recorded values for FCR shows a good valorification of local raw materials (cultivated in the Banat's area), that was used for the broilers nutrition (starter, grower and finisher).
With data for growth performance: BW, ADG, FCR and viability were obtained values for the economic efficiency of growth through the calculation of European Broiler Index (EBI) [18] and European Production Efficiency Factor (EPEF) [16, 18], which are presented in Table 2. Analysis the two indices (EPEF and EBI) show that the higher values was recorded in broilers from L1 group (EPEF from 260.49 to 376.18 and
EBI from 233.63 to 370.23), while for chickens in the LC group were lower with up to 8.70% for
EPEF and up to 8.75% for EBI.
Differences between LC and L1 were statistically
significant (P≤0.001) only for the entire growth period of chickens from 1 d to 42 d.
The economic efficiency assessment on EPEF and EBI was positively influenced by the growth performances BW, ADG, FCR and recorded viability. Increasing values of the two indices (EPEF and EBI) at L1 group, shows that the
performances obtained are better than to the LC
group.
EPEF is used in many countries of the world as a tool for measuring growing performances to broiler chicken [16, 18]. Therefore, the factors involved in the EPEF are BWG, FCR and viability and are considered universal measures for evaluating broilers performance.
In Romania, for measuring growing performances to broiler chicken is used the EBI which may be calculated on flocks with different slaughter ages [18]. In this case, the factors involved in calculating the EBI are ADG, FCR and viability. EBI values are always lower than EPEF, because in the ADG calculation was excluded the chicks weight to one day [18].
1,131
1,585
1,770
1,248
1,608
1,745
1,
127
1,
561 1,676
1,
232
1,
599 1,
742
0 1 2
14 d 35 d 42 d
F
C
R
(k
g feed/k
g
gain)
age (d)
LC Ross-308
344 Percentage of mortality of broilers from this study was 0% at the L1 group and 0.97% at the LC
group. In broilers of L1 group in growth period (1
d to 42 d), were not recorded of flock loss, and at the LC group the losses by mortality were low
(0.97%) and held in the first days of growth from accidental causes. For mortality rate to LC group
the registered values were consistent of the Broiler Management Manual [16]. Thus, the calculated values for viability (Table 2) were of 99.03% in the LC group and 100% in the L1 group. But, the
differences between average values of the studied groups were not statistically significant (P>0.05). Therefore, we consider that this was possible by ensuring optimal feeding conditions and microclimate which were conforming by Broiler Management Manual Ross [16]. The flock of
chick day-old was of good quality and had a very good health condition.
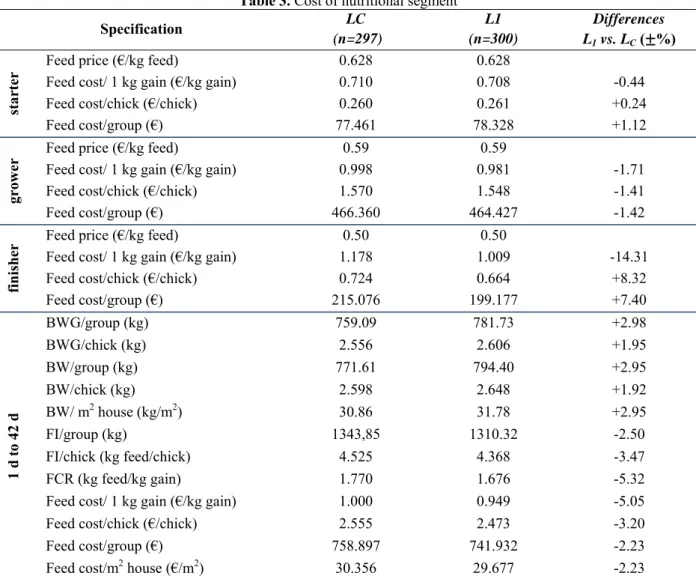
Nutrition expenses are presented in Table 3,these include the total cost of compound feed (starter, grower and finisher), feed cost/kg gain, feed cost/chick and feed cost/house unit area (€/m2).
To calculate the cost a kilogram of compound feed (€/kg feed) were used purchase prices of raw materials from recipe structure. Mention that prices raw materials were market prices from the March month current year.
Also, using data of growth (e.g. BW, BWG, feed intake on chick and period and FCR) and the feed cost (€/kg feed) was calculated feed cost per: kg gain, total gain, chick, kg BW, m2 house, which
are presented in Table 3.
Table 3. Cost of nutritional segment
Specification LC
(n=297)
L1 (n=300)
Differences L1 vs. LC ( %)
star
ter
Feed price (€/kg feed) 0.628 0.628
Feed cost/ 1 kg gain (€/kg gain) 0.710 0.708 -0.44
Feed cost/chick (€/chick) 0.260 0.261 +0.24
Feed cost/group (€) 77.461 78.328 +1.12
gro
w
er
Feed price (€/kg feed) 0.59 0.59
Feed cost/ 1 kg gain (€/kg gain) 0.998 0.981 -1.71
Feed cost/chick (€/chick) 1.570 1.548 -1.41
Feed cost/group (€) 466.360 464.427 -1.42
finisher
Feed price (€/kg feed) 0.50 0.50
Feed cost/ 1 kg gain (€/kg gain) 1.178 1.009 -14.31
Feed cost/chick (€/chick) 0.724 0.664 +8.32
Feed cost/group (€) 215.076 199.177 +7.40
1 d
t
o
42
d
BWG/group (kg) 759.09 781.73 +2.98
BWG/chick (kg) 2.556 2.606 +1.95
BW/group (kg) 771.61 794.40 +2.95
BW/chick (kg) 2.598 2.648 +1.92
BW/ m2 house (kg/m2) 30.86 31.78 +2.95
FI/group (kg) 1343,85 1310.32 -2.50
FI/chick (kg feed/chick) 4.525 4.368 -3.47
FCR (kg feed/kg gain) 1.770 1.676 -5.32
Feed cost/ 1 kg gain (€/kg gain) 1.000 0.949 -5.05
Feed cost/chick (€/chick) 2.555 2.473 -3.20
Feed cost/group (€) 758.897 741.932 -2.23
Feed cost/m2 house (€/m2) 30.356 29.677 -2.23
n-number of chicken; BW-body live weight; BWG-body weight gain; FI-feed intake; FCR-feed conversion ratio;
345 From data analysed was noted that the feed price decreased from 0.628 €/ kg at starter recipe up to 0.50 €/ kg at finisher recipe, while growth performances for the chicken groups (LC and L1)
were different. Thus, the higher growth performances obtained at the L1 group has
determined nutrition expenses lower, as compared with the LC group. Therefore, nutrition expenses
to L1 group were lower with 5.05% per kg gain
and 3.20% per chick, and in finally resulted to decrease nutritional costs per unit area with 2.23% compared LC group.
Also, was noted that superior weight gain and viability had led to obtaining larger quantities in body mass per unit area from L1 group compared
to LC group (+2.95% for L1 vs. LC).
4. Conclusions
For studied growth performances, the statistic differences between mean values of the groups L1
and LC, support the claim that it is based on
genetic effect.
Feed efficiency measured by feed conversion ratio was superior and has shown a very good valorification of the local raw materials used for broiler nutrition in the three growth phases (starter, grower and finisher).
The economic efficiency assessment on EPEF and EBI was positively influenced by the growth performances BW, ADG, FCR and recorded viability.
For chickens from L1 group, superior weight gain,
the viability and good feed conversion, can be translated into the cheapest costs for obtaining broilers.
References
1. Aggrey, S. E., Karnuah, A. B., Sebastian, B.,
Anthony, N. B., Genetic properties of feed efficiency parameters in meat-type chickens, Genetics Selection
Evolution, 2010; 42 (1), 25. doi:
10.1186/1297-9686-42-25.
2. Pym, R.A.E., Nutritional genetics. In Poultry
Breeding and Genetics, Ed. R.D. Crawford, Elsevier Amsterdam, 1990, 847-876.
3. Havenstein, G.B., Ferket, P.R., Qureshi, M.A.,
Growth, liveability, and feed conversion of 1957 versus 2001 broilers when fed representative 1957 and 2001 broiler diets, Poultry Science, 2003, 82, 1500–1508.
4. Pym, R.A.E., Genetic aspects of food intake and
food utilisation efficiency for growth in chickens, Australian Poultry Science Symposium, 2005, 17, 153– 162.
5. Pym, R. A. E., Effects of genotype on nutrient
utilization in broilers, Recent Advances in Animal Nutrition in Australia, 1997, 130-135,
http://livestocklibrary.com.au/handle/1234/19828.
6. Lentle, R., Physical properties of digesta that may
influence feed conversion efficiency. Proceedings of New Zealand Poultry Industry Conference, 2004, 7, 10–19.
7. Aggrey, S.E., Sanglikar, A.P., Karnuah, A.B.,
McMurtry, J.P., Molecular basis of meat-type birds. Proceedings of the 23rd World's Poultry Congress, Brisbane, 2008, 30 June-4 July, CD Rom.
8. Jorgensen, H., Sorensen, P., Eggum, B. O., Protein
and energy metabolism in broiler chickens selected for either body weight gain or feed efficiency, British Poultry Science, 1990, 31 (3), 517-524.
9. Leeson, S., Caston, L.J., Summers, J.D., Broiler
response to diet energy, Poultry Science, 1996, 75, 529-535.
10. Dozier, W. A. III, Behnke, K. C., Gehring, C. K.,
Branton, S. L., Effects of feed form on growth performance and processing yields of broiler chickens during a 42-day production period, The Journal of Applied Poultry Research, 2010, 19, 219–226.
11. Vieira, S. L., Angel, C. R., Optimizing broiler
performance using different amino acid density diets: What are the limits?, The Journal of Applied Poultry Research, 2012, 21, 149–155.
12. Leeson, S., Summers, J. D., Commercial poultry
nutrition, Nottingham Univ. Press., England, 2005, pp.230-295.
13. Dozier, W. A., III, Kidd, M. T., Corzo, A., Dietary
amino acid responses of broiler chickens, The Journal Applied Poultry Research, 2008, 17, 157–167.
14. Fathi, M.M., Ali R.A., Qureshi M.A., Comparison
of immune responses of Inducible Nitric Oxide Synthase (INOS) hyper-and hypo responsive genotypes of chickens, International Journal of Poultry Science, 2003, 2, 280-286.
15. Council Directive 2007/43/EC–28.06.2007, Laying
down minimum rules for the protection of chickens. Kept for meat production, Official Journal of the European Union, L. 182/12.07.2009, 19-28.
16. Broiler Management Manual Ross-308, 2009,
Home page address: www.aviagen.com, pp.1-114
17. Broiler Nutrition Specification Ross-308, 2007,
Home page address: www.aviagen.com, pp.1-8.
18. Van, I. et al., Growth and broilers industrialization,
2003, Ed. Ceres, Bucharest, pp.235-236.
19. Brudiu, I., Biostatistics in practical approach, Ed.
346
20. Nageswara Rao G., Statistics for agricultural
sciences, Second edition, BSP-BS Publications, Adithya Art Printers, Hyderabad, 2007, pp.26-44.
21. Ross-308 Broiler Performance Objectives, 2012,
Home page address: www.aviagen.com.
22. Cobb-500 Broiler Performance Objectives, 2012,
Home page address: www.cobb-vantress.com.
23. Marcu, A., Vacaru-Opriş, I., Marcu, A., Nicula,
M., Dumitrescu, G., Dronca, D., Julean, C., Kelciov, B., The influence of feed protein-energy level on the growth and slaughter performance for „Arbor Acres” hybrid, Scientific Papers Animal Science and Biotehnology, 2011, 44 (2), 433-438.
24. Marcu, A., Vacaru-Opriş, I., Nichita, I., Nicula,
M., Marcu, A., Kelciov, B., Effect of different levels of dietary protein and energy on the growth and slaughter performance at „Lohmann Meat” hybrid, Scientific Papers Veterinary Medicine -Timisoara, XLIV(2), 2011, 220-230.
25. Marcu, A., Vacaru-Opriş I., Marcu A., Nicula M.,