Study regarding the influence of parity, age at first calving
and farm management on the milk yield and composition in
Romanian Black and White cows
Traian Cisma
ş
, Stelian Acatinc
ă
i, Ludovic-Toma Cziszter, Silvia Erina, Simona Baul,
Iulian Tripon, Gabriel R
ă
ducan
Faculty of Animal Sciences and Biotechnologies Timişoara, 300645 - Timişoara, Calea Aradului 119, Romania
Abstract
The aim of the paper was to study the effects of parity, age at first calving and farm management on the milk yield and milk composition in 421 Romanian Black and White cows from the South-eastern Romania. Milk yield, milk fat yield, milk protein yield, and milk lactose yield were studied. Cows were divided into three classes for parity (1, 2, and 3+), five classes for age at first calving (<25, 25-28, 28-31, 31-34, and >34 month), and 2 farms in order to study the effect of these factors on milk production. Average milk production in farm 1 was 5487.9 kg milk, 200.5 kg fat, 189.5 kg protein, and 261.2 kg lactose, while in farm 2 was 6701.4 kg milk, 271.1 kg fat, 234.1 kg protein and 337.8 kg lactose. Milk production was significantly different in the two farms. Parity has a significant effect on the milk production; only differences between first lactation and third lactation, as well as second lactation and third lactation were statistically significant. When the age at first calving was lower or equal to 28 months, the milk production was significantly lower compared with production obtained from cows that calved at 31 months of age or later. It was concluded that the three studied factors had a significant effect on the milk production.
Keywords: age of first calving, cow, farm, milk production, parity, Romanian Black and White
1. Introduction
Milk is a complex mixture of fat, proteins, carbohydrates, minerals, vitamins, etc., suspended in water [1]. Because of its chemical components, milk is an excellent foodstuff, with great importance in human nutrition, with high palatability, high digestibility and balanced in nutrients. Compared to any natural foodstuff, milk contains the nutrients in the most favourable proportions for the human organism [2]. All these qualities recommend the milk as the closest to the perfect foodstuff.
Milk production is, quantitatively and qualitatively, the result of the functional activity of the whole body of the cow [2,3]. Milk is influenced by many factors that act directly or
* Corresponding author: Traian Cismaş,
Email: traian.cismas@yahoo.com
indirectly on the animal organism [2,3,4]. Generally, the factors act concomitantly on the milk yield and chemical composition, but some factors have higher influence on milk yield, while others on milk quality. There some factors that affect the production capacity of the cows, their production potential named genetic factors. Also, some factors have a direct action on expressing this genetic production potential determining the production level of cows. These are the environment and exploitation factors.
The aim of this paper was to study the effects of parity, age at first calving and farm management conditions on the milk yield and milk composition.
2. Materials and methods
Researches were carried out on 260 Romanian Black and White cows of Holstein-Friesian type reared in two dairy farms from Brăila County, Southeastern Romania. Cows calved from January 2009 until December 2010. Thus, a number of 421 lactations were obtained from the 260 cows. Only those lactations were considered that ended until December 31, 2010 and had at least 11 controls. Periodical controls were carried out using the official technique [5] with the period of 28 days and the control day in the middle of the period. Milk yield was measured in kilograms by using ICAR approved milkmeters and a total of 9262 milk samples were analysed for fat, protein, and lactose percentage using the in-line devices built in the milking equipment. Data was collected using special designed software built in the milking equipment. Based on the daily milk yield and chemical composition the quantity of fat, protein, and lactose was calculated for each control. The production per normal lactation was estimated by adding the milk, fat, protein, and lactose yield produced by each cow during the first 305 days in milk.
The resulting database was used to find out the effects of farm, parity and age at first calving on the milk production per normal lactation. The following statistical model was used:
yijkl = µ + fi + pj + ak + eijkl
where yijkl is the milk, fat, protein, or lactose yield
per normal lactation; µ is the general mean; fi is
the farm effect with two levels F1 and F2; pj is the
parity level with three levels first lactation, second lactation and third and over third lactation; ak is
the effect of the age at first calving with five levels <=25 months, 26-28 months, 29-31 months, 32-34 months, and >34 months; eijkl is the residual
effect of the model.
3. Results and discussion
Milk production averages according to the production farm are presented in Table 1. In farm 1 (F1) the average production per normal lactation was 5487.9 kg milk with 200.5 kg fat, 189.5 kg protein, and 261.2 kg lactose. This means an average fat percentage of 3.65%, protein percentage of 3.45% and lactose percentage of 4.76%. The average production in farm 2 (F2) was 6701.4 kg milk, 271.1 kg fat, 234.1 kg protein, and 337.7 kg lactose, meaning a 4.04% fat, 3.49% protein, and 5.0% lactose. The difference of 1213.5 kg milk, 70.5 kg fat, 44.5 kg protein, and 76.5 kg lactose in the favour of F2 compared to F1 was statistically significant (p<0.001).
Variability of the milk production traits was medium to low in F1 (V% ranged between 11.52% and 14.08%) and higher in F2 (V% ranged from 22.17% to 25.43%). The lowest milk yield was produced in F1 (3159.9 kg) while the highest in F2 (14067.9 kg). The highest values for fat, protein and lactose yields were found in F2, while the minimum value for lactose was found in F1.
Table 1. Averages and dispersion indices for milk production per normal lactation according to the farm in Romanian Black and White cows of Holstein-Friesian type
Farm Trait Average±SEM SD V% Min Max
F1 (n=128)
Milk yield (kg) 5487.934±66.6209 753.729 13.73 3159.92 8130.80 Fat yield (kg) 200.556±2.0424 23.107 11.52 131.21 272.27 Protein yield (kg) 189.549±2.0104 22.745 11.99 112.21 256.05 Lactose yield (kg) 261.233±3.2506 36.777 14.08 151.94 387.68
F2 (n=293)
Milk yield (kg) 6701.446±86.8228 1486.168 22.17 3711.40 14067.90 Fat yield (kg) 271.067±3.9090 66.912 24.68 106.38 570.72 Protein yield (kg) 234.064±3.4771 59.517 25.43 98.23 522.51 Lactose yield (kg) 337.789±4.4437 76.063 22.52 157.75 725.62
Tables 2-5 presents the averages and dispersion indices for milk production indices according to
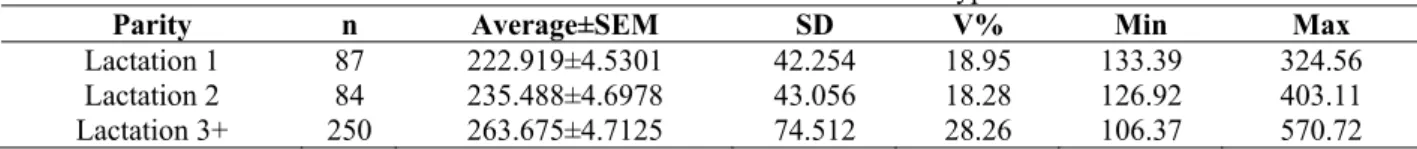
Milk production was the lowest in the first lactation 5717.8 kg milk with 22.9 kg fat, 207.3 kg protein and 283.7 kg lactose, and then increased with age of cows. The highest milk production, on average, was obtained from the cows having three
or more than three lactations, 6653.7 kg milk, 263.6 kg fat, 231.6 kg protein and 330.4 kg lactose. The lowest protein yield was observed in second lactation (202.5 kg, Table 4)
Table 2. Averages and dispersion indices for milk yield (kg) per normal lactation according to the parity in Romanian Black and White cows of Holstein-Friesian type
Parity n Average±SEM SD V% Min Max
Lactation 1 87 5717.802±84.8395 791.331 13.84 3822.00 7596.40 Lactation 2 84 6013.139±99.7536 914.257 15.20 3780.00 8740.20 Lactation 3+ 250 6653.707±102.7969 1625.362 24.43 3159.92 14067.90
Table 3. Averages and dispersion indices for fat yield (kg) per normal lactation according to the parity in Romanian Black and White cows of Holstein-Friesian type
Parity n Average±SEM SD V% Min Max
Lactation 1 87 222.919±4.5301 42.254 18.95 133.39 324.56 Lactation 2 84 235.488±4.6978 43.056 18.28 126.92 403.11 Lactation 3+ 250 263.675±4.7125 74.512 28.26 106.37 570.72
Table 4. Averages and dispersion indices for protein yield (kg) per normal lactation according to the parity in Romanian Black and White cows of Holstein-Friesian type
Parity n Average±SEM SD V% Min Max
Lactation 1 87 207.359±3.4999 32.645 15.74 137.38 299.92 Lactation 2 84 202.497±3.9159 35.890 17.72 118.25 331.14 Lactation 3+ 250 231.172±4.0226 63.604 27.51 98.23 522.51
Table 5. Averages and dispersion indices for lactose yield (kg) per normal lactation according to the parity in Romanian Black and White cows of Holstein-Friesian type
Parity n Average±SEM SD V% Min Max
Lactation 1 87 283.764±5.3297 49.712 17.52 172.99 409.29 Lactation 2 84 298.991±5.1595 47.287 15.82 197.49 497.35 Lactation 3+ 250 330.429±5.4061 85.478 25.87 151.94 725.62
Variability of these milk traits were medium to low for first and second lactation (ranging from 13.84% in first lactation milk yield to 18.95% in first lactation fat yield), but was higher for the third and over third lactation (the range was comprised between 24.43% for milk yield and 28.26% for fat yield).
Table 6. Differences and significance for milk production traits according to the parity
Trait Parity 3 2
Milk yield (kg) 1 -935.9*** -295.22 -640.6*** - ns
Fat yield (kg) 1 -40.8*** -12.62 -28.2*** - ns
Protein yield (kg) 1 -23.8*** 4.92 -28.7*** - ns
Lactose yield (kg) 1 -46.6*** -15.22 -31.4*** - ns
Data presented in Table 6 show that differences between the first and the second lactation was small and statistically non significant (p>0.05). Older cows, having three or more than three lactations produced over 15% more milk compared with cows in first lactation (+935.9 kg milk, +40.8 kg fat, +23.8 kg protein and +46.6 kg lactose, p<0.001). Also, these cows produced about 12% more milk than cows in second lactation (+640.6 kg milk, +28.2 kg fat, +28.7 kg protein and +31.4 kg lactose, p<0.001).
normal lactation was obtained when cows were calving at and age between 29 and 31 months of age that is 6666.7 kg milk, 267.7 kg fat, 234.0 kg protein, and 331.9 kg lactose. At higher ages, the
milk production slightly decreased, but the production was still higher compared to lower ages.
Table 7. Averages and dispersion indices for milk yield (kg) per normal lactation according to the age at first calving in Romanian Black and White cows of Holstein-Friesian type
Age at first calving
(months) n Average±SEM SD V% Min Max
<=25 29 5810.417±176.8421a 952.324 16.39 3822.00 8479.80
26-28 90 5820.479±81.8998a 776.969 13.35 3223.80 8130.80
29-31 89 6666.680±215.9671b 2037.429 30.56 3159.92 14067.90 32-34 119 6467.196±118.9531b 1297.625 20.06 3711.40 9641.10
>34 94 6496.842±134.8737b 1307.649 20.13 3780.00 10178.70 Averages with different letter superscript were statistically significant (p<0.05)
Table 8. Averages and dispersion indices for fat yield (kg) per normal lactation according to the age at first calving in Romanian Black and White cows of Holstein-Friesian type
Age at first calving
(months) n Average±SEM SD V% Min Max
<=25 29 221.578±8.8527a 47.673 21.52 133.39 343.51
26-28 90 220.763±3.66521a 34.771 15.75 131.21 297.12
29-31 89 267.708±9.3228b 87.951 32.85 135.67 570.72
32-34 119 255.071±5.8302b 63.600 24.93 106.38 406.27
>34 94 261.913±6.2746b 60.834 23.23 108.10 398.54
Averages with different letter superscript were statistically significant (p<0.05)
Table 9. Averages and dispersion indices for protein yield (kg) per normal lactation according to the age at first calving in Romanian Black and White cows of Holstein-Friesian type
Age at first
calving (months) n Average±SEM SD V% Min Max
<=25 29 205.316±7.0750a,b 38.100 18.56 137.38 309.87
26-28 90 202.338±3.0451a 28.888 14.28 116.77 269.52
29-31 89 234.006±8.0399c 75.848 32.41 112.21 522.51
32-34 119 223.488±4.9715b,c 54.233 24.27 98.23 409.52
>34 94 226.138±5.3658b,c 52.023 23.01 115.18 360.40
Averages with different letter superscript were statistically significant (p<0.05)
Table 10. Averages and dispersion indices for lactose yield (kg) per normal lactation according to the age at first calving in Romanian Black and White cows of Holstein-Friesian type
Age at first calving
(months) n Average±SEM SD V% Min Max
<=25 29 284.260±10.3547a 55.762 19.62 172.99 417.24
26-28 90 284.338±4.57369a 43.390 15.26 151.94 387.67
29-31 89 331.941±11.1823b 105.494 31.78 153.31 725.62
32-34 119 323.720±6.3401b 69.163 21.36 157.75 497.35
>34 94 324.581±7.0111b 67.975 20.94 179.71 502.99
Averages with different letter superscript were statistically significant (p<0.05)
The test of significance among the classes for age of first calving showed that milk, fat and lactose yields (Tables 7, 8, and 10) were significantly higher (p<0.05) when the age at first calving was 29 months of age or higher, compared to ages of first calving of 28 months of age or lower. Protein yield (Table 9) was significantly higher (p<0.05)
when cows calved at the age of 29 months or later compared to cows that calved at ages ranging between 26 and 28 months.
cows that calved at later ages produced more milk, fat, protein and lactose per normal lactation.
4. Conclusions
Based on results obtained in this study we can state that there were significant differences between the two farms regarding the milk production, showing different management practices of the farms.
Parity of cows had a significant effect on milk production, especially when first and second lactations were compared to third and higher lactations.
Age at first calving had a significant effect of milk production of cows, at lower ages the milk production being lower than at higher ages.
References
1. Acatincăi S., Tehnologia creșterii bovinelor, Agroprint, Timişoara, 2010, pp. 61-89.
2. Cziszter, L.T., Dirijarea producţiei de carne şi lapte la animalele domestice, Mirton, Timişoara. 2008, pp. 66-87.
3. Cziszter L.T., Dirijarea funcţiei glandei mamare, Eurostampa, Timişoara, 2003, pp. 50-77, 123-147. 4. Stanciu, G., Tehnologia creşterii bovinelor, Brumar, Timişoara, 1999, pp. 39-73.