More than efficacy revealed by single-cell analysis
of antiviral therapeutics
Wu Liu1*†, Mehmet U. Caglar2, Zhangming Mao3, Andrew Woodman1, Jamie J. Arnold1,
Claus O. Wilke2, Craig E. Cameron1*‡
Because many aspects of viral infection dynamics and inhibition are governed by stochastic processes, single-cell analysis should provide more information than approaches using population averaging. We have developed a microfluidic device composed of ~6000 wells, with each well containing a microstructure to capture single, infected cells replicating an enterovirus expressing a fluorescent reporter protein. We have used this system to characterize enterovirus inhibitors with distinct mechanisms of action. Single-cell analysis reveals that each class of inhibitor interferes with the viral infection cycle in a manner that can be distinguished by principal component analysis. Single-cell analysis of antiviral candidates not only reveals efficacy but also facilitates clustering of drugs with the same mechanism of action and provides some indication of the ease with which resistance will develop.
INTRODUCTION
Over the past few decades, the world has witnessed outbreaks of myriad RNA viruses, including West Nile virus, severe acute respi-ratory syndrome coronavirus, Chikungunya virus, Ebola virus, Zika virus, and, most recently, the poliovirus (PV)–related viruses: enterovirus D68 (EV-D68) and enterovirus A71 (EV-A71) (1–6). Unfortunately, viral emergence has outpaced the discovery and development of compounds capable of treating these pathogens. Because sporadic outbreaks come, go, and may never come again, development of broad-spectrum therapeutics exhibiting high barriers to resistance would have the greatest value. Unbiased screening of chemical libraries for antiviral agents using cell-based assays has no problem identifying active compounds of high potency. However, identifying the target and predicting the likelihood for evolution of resistance generally take years of effort following com-pound discovery.
As a part of a study evaluating PV infection dynamics on the single- cell level, we observed that a chain-terminating antiviral ribonucleotide selectively eliminates the most-fit members of the viral population (7). This class of antiviral agent has always been touted as having a high barrier to resistance (8). The typical explanation for this high barrier is that amino acid substitutions in the active site of the viral RNA polymerase conferring resistance to the antiviral ribonucleoside also impair the specificity and/or efficiency of incorporation of natural ribonucleotides (9). Elimination of the most-fit members of the viral population by an antiviral agent requires that resistance emerges from the surviving, low-fitness members of the population, which would ultimately require restoration of fitness for the population to survive the myriad mechanisms of host restriction (10). Restoration of fitness
may be the insurmountable barrier precluding the development of resistance to chain-terminating antiviral ribonucleotides.
This study was designed to determine the extent to which single- cell analysis of antiviral agents can contribute to our understanding of antiviral therapeutics relative to traditional approaches. We de-scribe a microfluidics device that can be used to produce complete dose- response curves. We have used this device to compare three mechanistically distinct classes of antiviral agents: a PV polymerase in-hibitor [2′-C-methyl-adenosine (2′-C-Me-A)], a PV protease inhibitor (rupintrivir), and two heat shock protein 90 (HSP90) inhibitors [geldanamycin (GA) and ganetespib (GS)]. We find that single-cell analysis distinguishes these classes of inhibitors. We suggest that addition of single-cell analysis to the existing paradigm for preclinical development of antiviral therapies may have the potential to identify leads with limited potential for development of resistance.
RESULTS
A device for single-cell analysis of the activity of antiviral agents
Our initial foray into single-cell analysis of PV infection dynamics used cell density to control single-cell occupancy of wells of a microfluidic device (7). What this means practically is that most wells are empty. Reducing the number of events monitored by a mere factor of two takes us below the number of events required for statistical analysis of the data. Acquisition of a dose-response curve was therefore im-possible using this first-generation device.
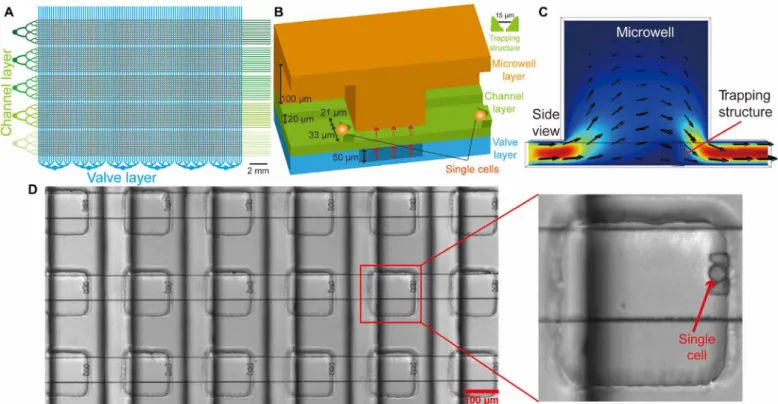
To address this problem, we created a multilayer device as previ-ously described (Fig. 1A) (7) but added a trapping structure to the channel layer of the device (Fig. 1B and fig. S1A). The position of the trapping structure was guided by simulation (Fig. 1C), leading to placement of the trapping structure on the rear wall of each well (Fig. 1D). The device contains five independent zones, each con-taining 1140 wells for a total of 5700 wells. The device mounts easily to the stage of a microscope (fig. S1B); the device in the cross section is shown in fig. S1C. Single-cell occupancy of the device was sensitive to the width of the channels used for loading (fig. S1D) and cell density (fig. S1E) with maximum occupancy near 90% (Fig. 1D and fig. S1). Under conditions in which an inhibitor reduces infection to 10%, ~100 infected cells will be observed using this device. This number of events is more than enough for statistical analysis.
1Department of Biochemistry and Molecular Biology, The Pennsylvania State
University, University Park, PA 16801, USA. 2Center for Computational Biology and
Bioinformatics, Institute for Cellular and Molecular Biology, and Department of Integrative Biology, University of Texas at Austin, Austin, TX 78712, USA. 3Department
of Engineering Science and Mechanics, The Pennsylvania State University, University Park, PA 16802, USA.
*Corresponding author. Email: [email protected] (W.L.); craig.cameron@med. unc.edu (C.E.C.)
†Present address: Department of Biomedical Engineering, Carnegie Mellon University, Pittsburgh, PA 15213, USA.
‡Present address: Department of Microbiology and Immunology, School of Medicine, The University of North Carolina, Chapel Hill, NC 27599, USA.
Reevaluation of a PV polymerase inhibitor
Viral polymerases represent a well-established target of antiviral thera-peutics. For example, cocktails used to treat human immunodeficiency virus infection and hepatitis C virus (HCV) infection include syn-thetic nucleoside analogs targeting reverse transcriptase and RNA- dependent RNA polymerase (RdRp), respectively (11, 12). The nonobligate, chain- terminating antiviral ribonucleoside 2′-C-Me-A is the prototype for the HCV RdRp inhibitor, sofosbuvir, and related compounds (13). In a previous study, we evaluated infections that survived treatment when present at a concentration that reduces the number of infections by 50% [median inhibitory concentration (IC50)]. To our surprise, we observed selective ablation of cells infected with virus variants capable of the fastest rates of replication and the highest yields of replicated RNA (7). This experiment suffered from the in-ability to evaluate concentrations of drug higher than the value of the IC50. Here, we use 2′-C-Me-A to validate the new device.
For all experiments reported herein, we pretreat HeLa S3 cells with drug for 1 hour, infect cells off chip with PV engineered to express enhanced green fluorescent protein (PV-eGFP) at a multiplicity of infection (MOI) of 0.5 plaque-forming units (PFU) per cell, pellet and wash cells to remove free virus, suspend cells to a density of 5 × 10⁵ cells/ml in drug-containing medium, and load the microfluidic device. Each well is monitored for eGFP fluorescence every 30 min for a 24-hour period, which gives rise to a population of time courses exhibiting substantial between-cell variability (fig. S2A). We plot the percentage of infected (green, GFP-positive) cells as a function of
drug concentration and fit to a hyperbola to obtain a value for the IC50 value. In the case of 2′-C-Me-A, concentrations greater than 50 M exhibit toxicity (14); therefore, these data do not fit to a hyperbola (fig. S2B). It is clear from this experiment, however, that the approach is sensitive enough to acquire data for a complete dose-response analysis (fig. S2B).
A major advantage of the single-cell platform is that the effect of a drug on the viable population can be determined. To analyze the single- cell data, we use five phenomenological parameters extracted from each time course (fig. S2C). These parameters are maximum fluorescence observed, which correlates to yield of genomic RNA; slope at the time of half-maximum fluorescence, which correlates to replication speed; infection time, which, to a first approximation, is the time it takes for an infection to go from start to finish akin to the virus generation time; start point, which is the earliest time in which fluorescence can be de-tected; and midpoint, the time of half-maximum fluorescence. This analysis leads to a collection of data points for each parameter value measured in each cell. Instead of displaying the primary data in a scat-ter plot (fig. S2, D and E), we display and analyze the curve derived from the first derivative of the cumulative distribution function from the raw data (fig. S2E). Our statistical analysis uses an unpaired two-tailed t test to determine if a significant difference exists for the means of a given parameter under two experimental conditions. In these experiments, the area under the curve defining each distribution has been normalized to one for ease of comparison. We do not attempt to interpret a difference in the “fine” structure of the distributions. Fig. 1. Addition of cell-trapping microstructures to wells of a microfluidic device enhances single-cell occupancy. (A) Schematic of the device. The following layers exist: microwell (not shown explicitly), channel (green), and valve (cyan). The device is divided into five sections of 1140 microwells (different shades of green for the channel layer) for a total of 5700 microwells. (B) Schematic of two wells of the device with all relevant dimensions indicated. The microwell layer creates a physical barrier between adjacent wells. The barrier between adjacent wells is sealed with water emanating from the valve layer. Water in the valve layer is sealed by application of air under pressure (20 to 30 psi). (C) Simulation of the flow velocity field in a microwell indicated that the outlet would maximize cell trapping by the microstructure. (D) Image showing cells captured by the microstructures in the microwells. The device was infused with cells (5 × 10⁵ cells/ml) at a rate of 0.5 l/min. Under optimal
Using this data analysis pipeline to evaluate outcomes in the ab-sence and preab-sence of 2′-C-Me-A (50 M), we observed a statistically significant difference in the mean values for the maximum (fig. S2F) and slope (fig. S2G) parameters without a statistically significant change in the mean values for the remaining parameters (fig. S2, H to J). Tabulation of the data and statistical analysis for this experiment are provided in table S1. These observations reproduce outcomes presented by us previously using the first-generation device (7). The mean values for maximum and slope parameters were reduced sub-stantially in the presence of 2′-C-Me-A. The observed between-cell variability in response to 2′-C-Me-A treatment can be attributed to multiple factors, including speed and/or fidelity of the viral poly-merase, the capacity for the nucleoside to be converted to the nucle-oside triphosphate (NTP), among other possibilities.
Evaluation of a PV 3C protease inhibitor
The observation that a subset of the viral population was most sen-sitive to 2′-C-Me-A was unexpected but could be easily rationalized by the notion that increased replication efficiency should correlate to increased 2′-C-Me-AMP incorporation efficiency. Do inhib-itors of other viral enzymes exhibit the same selectivity? Proteases of retroviruses and positive-sense RNA viruses responsible for polyprotein processing represent a second category of well-established antiviral therapeutics used in the cocktails to treat HIV and HCV, respectively (15–17). Inhibitors of the picornaviral protease responsible for poly-protein processing (3C) have been pursued for many years (18). For this study, we selected rupintrivir, which targets the 3C protease activity of all three types of PVs as well as that of other EVs (19, 20).
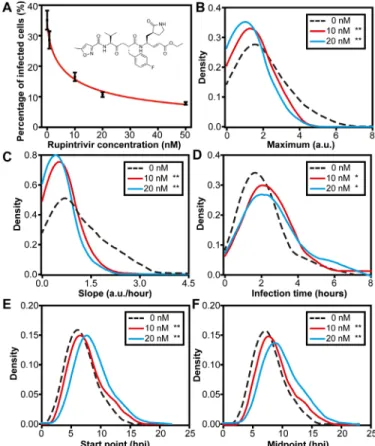
We measured the impact of rupintrivir on the establishment of PV infection in HeLa S3 cells (Fig. 2A). The IC50 value was 8.0 ± 4.0 nM, which agrees with values (5 to 40 nM) measured using conventional plaque assays (19). We analyzed the single-cell data obtained at all concentrations (table S2) but focused only on the concentrations approximating the IC50 and 2 × IC50, 10 and 20 nM, respectively, to emphasize trends in the data. At both concentrations, we observed a statistically significant difference compared with the control for all parameters: maximum (Fig. 2B), slope (Fig. 2C), infection time (Fig. 2D), start point (Fig. 2E), and midpoint (Fig. 2F). This outcome with rupintrivir is distinct from that above with 2′-C-Me-A. We con-clude that not all antiviral agents interfere with the viral population in the same manner or at the same stage(s) of the lifecycle reflected by the parameters determined by monitoring the kinetics of fluorescence produced by GFP reporter virus.
Evaluation of HSP90 inhibitors
Compounds antagonizing the function of cellular chaperones rep-resent an emergent class of anticancer and antiviral therapeutics (21, 22). Chaperones of the HSP90 family are required when the cell is growing fast and/or producing high levels of proteins, as observed in cancer cells or in virus-infected cells. Seminal studies from the Frydman and Andino laboratories demonstrate a clear, essential role for HSP90 in the production of infectious PV virions (23). However, every step of the virus lifecycle has been suggested as a target for HSP90 when viruses outside of the picornavirus family are considered (22, 24). The benefit of targeting antiviral therapeutics to cellular proteins is that the likelihood for evolution of resistance is mini-mized (23).
We have used GA because it is a potent inhibitor of HSP90 (nano-molar range) that is active against PV (23). The presence of GA reduced
the number of infections established by 22 ± 4%, with an IC50 value of 30 ± 8 nM (Fig. 3A). An earlier study did not observe an impact of GA prior to virus assembly; however, it is possible that a reduction of the magnitude shown here would be concealed by experimental error (23). Because infection is monitored by eGFP, which requires virus entry, genome replication, and genome translation, interference with any of these steps would lead to a reduction in the number of eGFP-positive cells. It is clear, however, that translation and folding of eGFP are not altered in the presence of the highest concentration of GA used in this experiment (fig. S3).
Analysis of the single-cell data is presented in table S3. The mean of the distribution of values for the maximum parameter did not change in the presence of GA (Fig. 3B), in contrast to the inhibitors targeting viral proteins. Observation of a statistically significant difference in the distribution of the values for the infection time parameter was concentration dependent (Fig. 3D). A statistically significant difference for the mean of the distributions for the remaining parameters was observed at concentrations corresponding to the IC50 and above (Fig. 3, C, E, and F). A third signature of antiviral action is therefore revealed with GA.
HSP90 inhibitor that differs from GA substantially in chemical struc-ture (compare inset in fig. S4 to that in Fig. 3A) but is thought to have the same mechanism of action (27, 28). The use of GS provides an important test of the capacity of the single-cell analysis to reveal common signature for compounds with common mechanisms.
In contrast to observations with GA, GS reduced the number of infections established by 70 ± 14%, with an IC50 of 3 ± 1 nM due to its higher affinity for HSP90 (29). Analysis of the single-cell data is presented in table S3. The impact of GS on the five phenomenological parameters was the same as observed for GA (fig. S4). In this case, it is clear that mechanistically identical compounds yield identical signatures at the single-cell level.
Evaluation of antiviral drug combinations
The long-term use of an antiviral therapy is determined, in part, by the time required for resistance mutants to emerge. One approach to delaying or even eliminating the emergence of drug-resistant mutants is the use of antiviral combinations (30, 31). What is often evaluated is the ability of two drugs to exhibit greater efficacy (synergy) in preventing infection in combination than observed when either drug is used alone. We evaluated the ability of 2′-C-Me-A to synergize with GA by treating cells with the concentrations of one or both at their IC50 values (Fig. 4A). In the absence of drug, 34 ± 3% of cells
in the device were infected. That number was reduced to 18 ± 2, 30 ± 3, or 15 ± 3% in the presence of 2′-C-Me-A, GA, or the combi-nation thereof, respectively. On the basis of this observation alone, the conclusion would be that this combination of antiviral agents is not even additive. Analysis of the entire single-cell dataset is presented in table S4. Because 2′-C-Me-A exhibits the most substantial antiviral effect relative to the dimethyl sulfoxide (DMSO) control, here we compare the combination to 2′-C-Me-A alone. We observed a sta-tistically significant difference for all parameters (Fig. 4, B to F). Single-cell analysis therefore has the ability to reveal efficacy of drug combinations masked at the population level. We performed the comparable experiment with GS and reached the same conclusion (fig. S5 and table S4).
Evaluation of single-cell data by using PCA
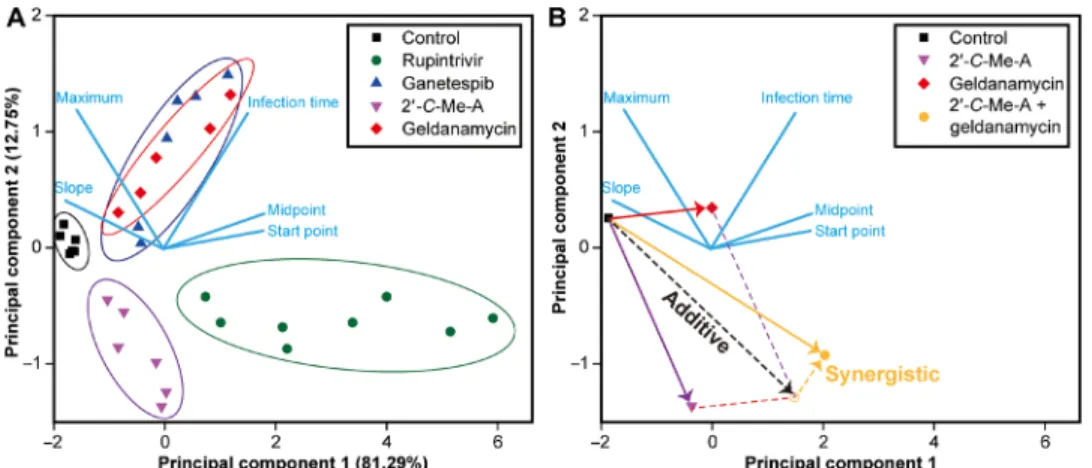
Our evaluation of three classes of anti-PV drugs revealed three unique signatures based on changes to the phenomenological parameters used to describe infection dynamics (fig. S6). We reasoned that principal component analysis (PCA) might provide an even more robust ap-proach to compare datasets using our five parameters. As shown in Fig. 5A, PCA resolves each class of inhibitor from the other, as well as from outcomes in the absence of drug. The mechanistically Fig. 3. Evaluation of GA, an HSP90 inhibitor. (A) Dose-response analysis. Percentage
of single, infected (green, GFP-positive ) cells was determined as a function of GA concentration. (B to F) Distributions for each parameter in the presence of 25 or 100 nM GA were compared with that in the absence of drug using a t test. **P < 0.005. Numerical values for experimental parameters and statistical analysis are provided in table S3. The parameters presented in the panels are as follows: (B) maximum, (C) slope, (D) infection time, (E) start point, and (F) midpoint.
related, but chemically distinct, inhibitors of HSP90 cluster by PCA (see GA and GS in Fig. 5A). We evaluated the antiviral drug combina-tions in the context of the PCA space (Fig. 5B). An additive combi-nation is defined by the vector bisecting the parallelogram defined by the experiment in the absence of either drug (control) and the experiments in the presence of each drug alone (Fig. 5B). The 2′-C -Me-A–GA combination was synergistic, with the position indi-cating that the combination delays the start point and retards the infection time. We conclude that single-cell analysis of antiviral therapeutics can provide not only information on the efficacy of a drug but also information on the mechanism of action and syn-ergy of combinations of antiviral therapeutics. This experimental paradigm should have a transformative impact on the drug devel-opment process.
DISCUSSION
The era of single-cell virology has begun (7, 32–35). Infection out-comes in cells are determined, in part, by stochastic processes (36). For example, the presence and abundance of viral restriction factors and viral replication promoting factors of the host are largely governed by stochastic gene expression (37). As a result, substantial between- cell variation exists in all quantifiable parameters of infection. An underappreciated consequence of the behavior of systems such as these is the non–self-averaging nature of these systems, which means that the population average of any single-cell parameter will almost certainly fail to represent the dynamics within any single cell (38, 39). The practical complication arising from this phenomenon is that changes in the average kinetics observed in a growth curve for a virus caused by a perturbation, e.g., exposure to an antiviral therapeutic, will not inform accurately the step(s) of the viral lifecycle affected most by the perturbation.
With this perspective in mind, it is not surprising that our previous evaluation of an antiviral ribonucleotide using a single-cell approach revealed the unexpected finding that the most-fit members of the viral population were most susceptible to this class of compounds (7). This observation left one major unresolved question: Do all
ef-fective antiviral therapeutics target the same subpopulation of viruses or do unique signatures exist for distinct mechanistic classes of anti-viral therapeutics? Addressing these questions is the central objective of this study.
Our first-generation microfluidic device for on-chip investigation of viral infection dynamics relied on cell density as the mechanism to achieve isolation of single cells in wells of the device, an approach which leaves most wells of the device empty (7). We have redesigned the device to add physical cell-trapping structures to each well. The outcome of which is the ability to achieve single-cell occupancy of ~90% of the ~6000 wells of the device (Fig. 1 and fig. S1). The en-hanced occupancy enabled the complete characterization of antiviral therapeutics by permitting the acquisition of complete dose-response curves (e.g., Fig. 2A).
The three classes of antiviral therapeutics chosen target a viral polymerase (2′-C-Me-A; fig. S2), a viral protease (rupintrivir; Fig. 2), or a host factor, HSP90, [GA (Fig. 3) and GS (fig. S4)]. Our data analysis pipeline emphasizes five phenomenological parameters with correlates to traditional parameters for assessment of the viral life-cycle. The major finding of this study is that each class of antiviral therapeutics exhibited a unique signature with respect to the five phenomenological parameters measured. We used the absolute value of the difference of each parameter in the presence and absence of the antiviral agent to visualize the signature for the antiviral agent and compare one antiviral agent to another (fig. S6A). It was possible to use PCA to stratify the different therapeutic classes (Fig. 5A). Both GA and GS overlapped by PCA despite their substantial differences in structure and efficacy (Fig. 5A). Drug combinations, which failed to affect establishment of infection, exhibited synergy when single-cell parameters were monitored (Figs. 3 and 5B).
equivalent to or lower than the IC50, binding is driven by the con-centration of the protease target, which would be highest in cells replicating fastest and to the highest levels. GA only affected a subset of 2′-C-Me-A and rupintrivir-sensitive members, those with a fast rate of replication (fig. S6D). This observation is quite interesting in that fast rates of replication in our assay mean fast rates of translation to produce GFP. Chaperones like HSP90 would be expected to be most useful under these conditions. A comparable analysis using the start point and infection time provided an even greater distinction between the three classes of antiviral agents studied herein (fig. S6, E to G). Most noteworthy was the observation that rupintrivir retarded the time it took to establish infection and to complete replication (fig. S6F). This observation may reflect the role of the protease in promoting replication by cleaving cellular antagonists of the virus lifecycle.
This study is among the first to analyze a range of antiviral ther-apeutics on viral infection dynamics at the single-cell level. The res-olution afforded by this approach is unprecedented when compared with other cell-based approaches, which only provide a measure of efficacy. Given the substantial effort required to go from compound to mechanism using the traditional experimental paradigm, the ability of single-cell analysis to inform mechanism should make this approach a welcome addition to the drug discovery and development toolbox. It is not uncommon for analogs to be synthesized during the drug devel-opment process that lose specificity or even function by a different mechanism of action; single-cell analysis has the potential to reveal changes such as these at the start of the analysis instead of much, much later in the development process. Last, although we have used antiviral agents to demonstrate the power of single-cell analysis, use of this tech-nology and approach will be applicable to the discovery and develop-ment of any class of therapeutics that can be assessed in cell culture.
MATERIALS AND METHODS Cells, viruses, and reagents
HeLa and HeLa S3 cells were obtained from the American Type Culture Collection and maintained in Dulbecco’s modified Eagle’s medium/F12 (1:1) (Life Technologies) supplemented with 10% fetal bovine serum (Atlanta Biologicals) and penicillin-streptomycin (100 IU/ml; Corning) in a humidified atmosphere of 95% air and 5% CO2 at 37°C.
To generate enhanced green fluorescent protein (EGFP)–tagged PV used in this work, pMo-EGFP-PV-WT plasmid was linearized with Apa I and purified using the QIAEX II Gel Extraction Kit (Qiagen, Netherlands). With the linearized plasmid as the template, viral RNA was transcribed at 37°C for 5.5 hours in a 20-l reaction medium con-taining 350 mM Hepes (pH 7.5), 32 mM magnesium acetate, 40 mM dithiothreitol, 2 mM spermidine, 28 mM NTPs, linearized DNA (0.025 g/l), and T7 RNA polymerase (0.025 g/l). After removing
magnesium pyrophosphate in the mixture by centrifugation for 2 min, RNA concentration was measured by scanning the gel at fluorescence mode with a Typhoon 8600 scanner (Promega, USA). Then, 5 g of viral RNA was used to transfect HeLa cells cultured at 37°C by electro-poration. Virus was harvested by three repeated freeze-thaw cycles, centrifuged at 3000 rpm for 5 min, and suspended in 0.5% NP-40. For purification, the supernatant was mixed with 1 volume of 20% PEG-8000 (polyethylene glycol, molecular weight 7000~9000)/1 M NaCl solution and incubated overnight at 4°C. After centrifugation at 8000g for 10 min at 4°C, the pellet was resuspended in phosphate-
buffered saline (PBS) and filtered with Centricon Plus-70 (EMD Milli-pore, USA). Plaque assay was performed to determine the virus titer. DMSO and rupintrivir were purchased from Sigma Chemical Co. (St. Louis, MO, USA). 2′-C-Me-A was obtained from Carbosynth Limited (Compton, Berkshire, UK). Solutions of GA and GS in DMSO were provided by X. Zhang (Department of Chemistry, Pennsylvania State University) and J. Frydman (Department of Biology, Stanford University), respectively. All the antiviral compounds were prediluted in DMSO for use. For no drug groups, same volumes of DMSO were spiked into the culture medium.
Microfluidic devices
The microfluidic layers were fabricated from polydimethylsiloxane (PDMS; GE RTV615) by standard soft lithography techniques. The molds were fabricated by coating photoresist SU-8 25/50 with de-sired thicknesses on a silicon wafer and photolithographic patterning (fig. S1). Premixed PDMS prepolymer and curing agent (ratio, 5:1) were poured onto the mold for the valve layer and cured. Premixed PDMS prepolymer and curing agent (ratio, 20;1) were spin coated on the mold for the channel layer at 1500 rpm for 1 min and incubated at 65°C for 20 min. Then, the valve layer was released from the mold and placed on the channel layer with alignment. The assembly was baked at 65°C overnight for efficient bonding. The assembly was further bonded with alignment to the microwells layer cured from premixed PDMS prepolymer and curing agent (ratio, 20:1) by baking at 65°C overnight. The obtained device was further bonded to a glass slide to prevent deformation when applying a pressure to the valves.
On-chip experiments
For each group, 2 × 10⁵ HeLa S3 cells were cultured with drug- containing medium for 1 hour. Then, the cells were centrifuged, resuspended in PBS, and mixed with EGFP-PV at the MOI of 0.5 PFU per cell. After shaking at 140 rpm for 30 min, the cells were centri-fuged and resuspended in media with corresponding treatments. With a PHD ULTRA Syringe pump (Harvard Apparatus), the cell suspen-sions were infused to the inlets of a microfluidic device for trapping of single cells for 5 min. A pressure of 30 psi was applied to the valves to isolate the microwells.
The device was placed in the chamber of a stage top WSKM GM2000 incubation system (Tokai, Japan) adapted to a Nikon Eclipse Ti inverted microscope (Nikon, Japan) equipped with a ProScan II motorized flat top stage (Prior Scientific, USA). With this setup, bright-field and fluorescence images of the microwells were auto-matically acquired every 30 min from 2.5 to 24 hours postinfection. In each image, 36 (6 × 6) microwells were included with a CFI60 Plan Apochromat Lambda 10× objective and a Hamamatsu C11440 camera.
Data processing
comparison of different experiments, the intensities were further normalized to uniformize the mean values of the maximums for the no drug groups (2.00 arbitrary units in this work). To visualize the distributions, as in fig. S2 and elsewhere in the manuscript, we cal-culated the cumulative distribution function from the raw data, then calculated the first derivative, and smoothed it using Savitzky-Golay smoothing. The area under each curve was normalized to 1.
Statistical analysis
All of the experimental data were obtained in triplicate and are pre-sented as means ± SD unless otherwise mentioned. Unpaired two-tailed t tests were used to determine if a significant difference exists for the means of a given parameter under two experimental conditions. All statistical analysis was performed using OriginPro 9.1 software.
SUPPLEMENTARY MATERIALS
Supplementary material for this article is available at http://advances.sciencemag.org/cgi/ content/full/5/10/eaax4761/DC1
Fig. S1. A microfluidic device containing cell-trapping microstructures for high-throughput analysis of single-cell infections.
Fig. S2. Evaluation of 2′-C-Me-A, a PV RdRp inhibitor.
Fig. S3. Translation of eGFP mRNA and activation of fluorophore are normal in the presence of GA and GS.
Fig. S4 Evaluation of GS, an HSP90 inhibitor.
Fig. S5 Evaluation of an antiviral drug combination: 2′-C-Me-A and GS. Fig. S6 Evaluation of inhibitor-specific signatures.
Table S1. Means, SD, and P values between groups for the 2′-C-Me-A experiment. Table S2. Means, SD, and P values between groups for the rupintrivir experiment. Table S3. Means, SD, and P values between groups for experiments with HSP90 inhibitors. Table S4. Means, SD, and P values between groups for antiviral synergy experiments.
View/request a protocol for this paper from Bio-protocol.
REFERENCES AND NOTES
1. G. L. Campbell, A. A. Marfin, R. S. Lanciotti, D. J. Gubler, West Nile virus. Lancet Infect. Dis.
2, 519–529 (2002).
2. J. S. Peiris, S. T. Lai, L. L. Poon, Y. Guan, L. Y. Yam, W. Lim, J. Nicholls, W. K. Yee, W. W. Yan, M. T. Cheung, V. C. Cheng, K. H. Chan, D. N. Tsang, R. W. Yung, T. K. Ng, K. Y. Yuen; SARS study group, Coronavirus as a possible cause of severe acute respiratory syndrome.
Lancet 361, 1319–1325 (2003).
3. F. J. Burt, M. S. Rolph, N. E. Rulli, S. Mahalingam, M. T. Heise, Chikungunya: A re-emerging virus. Lancet 379, 662–671 (2012).
4. S. Baize, D. Pannetier, L. Oestereich, T. Rieger, L. Koivogui, N. Magassouba, B. Soropogui, M. S. Sow, S. Keïta, H. De Clerck, A. Tiffany, G. Dominguez, M. Loua, A. Traoré, M. Kolié, E. R. Malano, E. Heleze, A. Bocquin, S. Mély, H. Raoul, V. Caro, D. Cadar, M. Gabriel, M. Pahlmann, D. Tappe, J. Schmidt-Chanasit, B. Impouma, A. K. Diallo, P. Formenty, M. Van Herp, S. Günther, Emergence of Zaire Ebola virus disease in Guinea. N. Engl. J. Med.
371, 1418–1425 (2014).
5. G. S. Campos, A. C. Bandeira, S. I. Sardi, Zika virus outbreak, Bahia, Brazil. Emerg. Infect. Dis.
21, 1885–1886 (2015).
6. D. Antona, M. Kossorotoff, I. Schuffenecker, A. Mirand, M. Leruez-Ville, C. Bassi, M. Aubart, F. Moulin, D. Lévy-Bruhl, C. Henquell, B. Lina, I. Desguerre, Severe paediatric conditions linked with EV-A71 and EV-D68, France, May to October 2016. Eurosurveillance 21, 10.2807/1560-7917.ES.2016.21.46.30402 (2016).
7. F. Guo, S. Li, M. U. Caglar, Z. Mao, W. Liu, A. Woodman, J. J. Arnold, C. O. Wilke, T. J. Huang, C. E. Cameron, Single-cell virology: On-chip investigation of viral infection dynamics.
Cell Rep. 21, 1692–1704 (2017).
8. J. Y. Feng, Addressing the selectivity and toxicity of antiviral nucleosides whole.
Antivir. Chem. Chemother. 26, 1631089284 (2018).
9. S. S. Carroll, J. E. Tomassini, M. Bosserman, K. Getty, M. W. Stahlhut, A. B. Eldrup, B. Bhat, D. Hall, A. L. Simcoe, R. LaFemina, C. A. Rutkowski, B. Wolanski, Z. Yang, G. Migliaccio, R. De Francesco, L. C. Kuo, M. MacCoss, D. B. Olsen, Inhibition of hepatitis C virus RNA replication by 2’-modified nucleoside analogs. J. Biol. Chem. 278, 11979–11984 (2003). 10. R. Andino, E. Domingo, Viral quasispecies. Virology 479-480, 46–51 (2015). 11. T. Cihlar, A. S. Ray, Nucleoside and nucleotide HIV reverse transcriptase inhibitors:
25 years after zidovudine. Antiviral Res. 85, 39–58 (2010).
12. M. J. Sofia, W. S. Chang, P. A. Furman, R. T. Mosley, B. S. Ross, Nucleoside, nucleotide, and non-nucleoside inhibitors of hepatitis C virus NS5B dependent RNA-polymerase. J. Med. Chem. 55, 2481–2531 (2012).
13. A. A. Eltahla, F. Luciani, P. A. White, A. R. Lloyd, R. A. Bull, Inhibitors of the hepatitis C virus polymerase, mode of action and resistance. Viruses 7, 5206–5224 (2015).
14. L. J. Stuyver, T. R. McBrayer, P. M. Tharnish, J. Clark, L. Hollecker, S. Lostia, T. Nachman, J. Grier, M. A. Bennett, M. Y. Xie, R. F. Schinazi, J. D. Morrey, J. L. Julander, P. A. Furman, M. J. Otto, Inhibition of hepatitis C replicon RNA synthesis by -D-2’-deoxy-2’-fluoro-2’-C-methylcytidine: A specific inhibitor of hepatitis C virus replication. Antivir. Chem.
Chemother. 17, 79–87 (2006).
15. A. Wlodawer, J. Vondrasek, Inhibitors of HIV-1 protease: A major success of structure-assisted drug design. Annu. Rev. Biophys. Biomol. Struct. 27, 249–284 (1998). 16. J. Pokorna, L. Machala, P. Rezacova, J. Konvalinka, Current and novel inhibitors of HIV
protease. Viruses 1, 1209–1239 (2009).
17. P. de Leuw, C. Stephan, Protease inhibitor therapy for hepatitis C virus-infection. Expert
Opin. Pharmacother. 19, 577–587 (2018).
18. H.-M. Wang, P.-H. Liang, Picornaviral 3C protease inhibitors and the dual 3C protease/ coronaviral 3C-like protease inhibitors. Expert Opin. Ther. Pat. 20, 59–71 (2010). 19. A. M. De Palma, G. Pürstinger, E. Wimmer, A. K. Patick, K. Andries, B. Rombaut,
E. De Clercq, J. Neyts, Potential use of antiviral agents in polio eradication. Emerg. Infect. Dis.
14, 545–551 (2008).
20. S. L. Binford, F. Maldonado, M. A. Brothers, P. T. Weady, L. S. Zalman, J. W. Meador, D. A. Matthews, A. K. Patick, Conservation of amino acids in human rhinovirus 3C protease correlates with broad-spectrum antiviral activity of rupintrivir, a novel human rhinovirus 3C protease inhibitor. Antimicrob. Agents Chemother. 49, 619–626 (2005). 21. S. Chatterjee, T. F. Burns, Targeting heat shock proteins in cancer: A promising
therapeutic approach. Int. J. Mol. Sci. 18, E1978 (2017).
22. R. Geller, S. Taguwa, J. Frydman, Broad action of Hsp90 as a host chaperone required for viral replication. Biochim. Biophys. Acta 1823, 698–706 (2012).
23. R. Geller, M. Vignuzzi, R. Andino, J. Frydman, Evolutionary constraints on chaperone-mediated folding provide an antiviral approach refractory to development of drug resistance. Genes Dev. 21, 195–205 (2007).
24. Y. Wang, F. Jin, R. Wang, F. Li, Y. Wu, K. Kitazato, HSP90: A promising broad-spectrum antiviral drug target. Arch. Virol. 162, 3269–3282 (2017).
25. M. Hwang, L. Moretti, B. Lu, HSP90 inhibitors: Multi-targeted antitumor effects and novel combinatorial therapeutic approaches in cancer therapy. Curr. Med. Chem. 16, 3081–3092 (2009).
26. K. Sidera, E. Patsavoudi, HSP90 inhibitors: Current development and potential in cancer therapy. Recent Pat. Anticancer Drug Discov. 9, 1–20 (2014).
27. S. M. Roe, C. Prodromou, R. O'Brien, J. E. Ladbury, P. W. Piper, L. H. Pearl, Structural basis for inhibition of the Hsp90 molecular chaperone by the antitumor antibiotics radicicol and geldanamycin. J. Med. Chem. 42, 260–266 (1999).
28. W. Ying, Z. Du, L. Sun, K. P. Foley, D. A. Proia, R. K. Blackman, D. Zhou, T. Inoue, N. Tatsuta, J. Sang, S. Ye, J. Acquaviva, L. S. Ogawa, Y. Wada, J. Barsoum, K. Koya, Ganetespib, a unique triazolone-containing Hsp90 inhibitor, exhibits potent antitumor activity and a superior safety profile for cancer therapy. Mol. Cancer Ther. 11, 475–484 (2012).
29. T. L. Prince, T. Kijima, M. Tatokoro, S. Lee, S. Tsutsumi, K. Yim, C. Rivas, S. Alarcon, H. Schwartz, K. Khamit-Kush, B. T. Scroggins, K. Beebe, J. B. Trepel, L. Neckers, Client proteins and small molecule inhibitors display distinct binding preferences
for constitutive and stress-induced HSP90 isoforms and their conformationally restricted mutants. PLOS ONE 10, e0141786 (2015).
30. J. Dunning, J. K. Baillie, B. Cao, F. G. Hayden, Antiviral combinations for severe influenza.
Lancet Infect. Dis. 14, 1259–1270 (2014).
31. W. P. Hofmann, V. Soriano, S. Zeuzem, Antiviral combination therapy for treatment of chronic hepatitis B, hepatitis C, and human immunodeficiency virus infection. In Antiviral
Strategies (Springer, 2009), vol.189, pp. 321–346.
32. A. C. Timm, J. W. Warrick, J. Yin, Quantitative profiling of innate immune activation by viral infection in single cells. Integr. Biol. 9, 782–791 (2017).
33. R. Ramji, V. C. Wong, A. K. Chavali, L. M. Gearhart, K. Miller-Jensen, A passive-flow microfluidic device for imaging latent HIV activation dynamics in single T cells.
Integr. Biol. 7, 998–1010 (2015).
34. M. Combe, R. Garijo, R. Geller, J. M. Cuevas, R. Sanjuán, Single-cell analysis of RNA virus infection identifies multiple genetically diverse viral genomes within single infectious units. Cell Host Microbe 18, 424–432 (2015).
35. A. B. Russell, C. Trapnell, J. D. Bloom, Extreme heterogeneity of influenza virus infection in single cells. ELife 7, e32303 (2018).
36. F. S. Heldt, S. Y. Kupke, S. Dorl, U. Reichl, T. Frensing, Single-cell analysis and stochastic modelling unveil large cell-to-cell variability in influenza A virus infection. Nat. Commun.
6, 8938 (2015).
38. B. Derrida, From random walks to spin glasses. Physica D 107, 186–198 (1997). 39. S. Wiseman, E. Domany, Finite-size scaling and lack of self-averaging in critical disordered
systems. Phys. Rev. Lett. 81, 22–25 (1998).
40. M. U. Caglar, A. I. Teufel, C. O. Wilke, Sicegar: R package for sigmoidal and double-sigmoidal curve fitting. PeerJ 6, e4251 (2018).
Acknowledgments: W.L. thanks S. Li, P. Li, P.-H. Huang, and L. Ren for the helpful discussions.
C.E.C. thanks S. Manrubia for sharing thoughts on non–self-averaging systems, and J. Frydman and R. Andino for encouraging us to evaluate inhibitors of HSP90. Funding: This work was supported by grant AI120560 from the NIAID, NIH to C.O.W. and C.E.C. A.W. is the recipient of a postdoctoral fellowship from the American Heart Association (no. 18POST33960071). Author contributions: W.L. and C.E.C. designed the experiments. W.L. conducted the experiments. A.W and J.J.A. contributed unique reagents. W.L., M.U.C., and Z.M. performed the image and data analysis. W.L., M.U.C., A.W., J.J.A., C.O.W., and
C.E.C analyzed the data. W.L. and C.E.C wrote the manuscript. Competing interests: The authors declare that they have no competing interest. Data and materials availability: All data needed to evaluate the conclusions in the paper are present in the paper and/or the Supplementary Materials. Additional data related to this paper may be requested from the authors.
Submitted 26 March 2019 Accepted 16 September 2019 Published 30 October 2019 10.1126/sciadv.aax4761