To the Graduate Council:
I am submitting herewith a dissertation written by Caroline Munn Best entitled
“Community College Students’ Perceptions of Their Rural High School Mathematics Experience.” I have examined the final electronic copy of this dissertation for form and content and recommend that it be accepted in partial fulfillment of the requirements for the degree of Doctor of Philosophy, with a major in Education.
_Vena M. Long____________ Major Professor
We have read this dissertation and recommend its acceptance:
_P. Mark Taylor____________________ _Kristen T. Rearden_________________ _Charles R. Collins_________________
Accepted for the Council:
___Anne Mayhew________
Vice Chancellor and Dean of
Graduate Studies
COMMUNITY COLLEGE STUDENTS’ PERCEPTIONS OF THEIR RURAL HIGH SCHOOL MATHEMATICS EXPERIENCE
A Dissertation Presented for the Doctor of Philosophy
Degree
The University of Tennessee, Knoxville
DEDICATION
This dissertation is dedicated to my parents, Sarah and Al Munn, who taught me to finish every project I start
and
to the ACCLAIM 2002 Cohort
ACKNOWLEDGEMENTS
I wish to thank all of those who helped me with the research and the writing of this dissertation:
My Doctoral Committee Members: Dr. Vena Long, my doctoral committee chair, who encouraged and inspired me to keep working; Dr. P. Mark Taylor for
advising me through the data gathering and analysis; Dr. Kristen Rearden for her helpful suggestions; and Dr. Chuck Collins, for being the “math” person, the content of my teaching.
Student Participants in the Study: I cannot acknowledge you by name, but I will say thank you for your honest and forthright answers to sometimes difficult questions. Your insight and candor is appreciated.
My Colleagues at Pellissippi State Technical Community College: Dr. Catherine Williams, Ms. Betty Bumgarner, Dr. Linda Randolph, and Dr. Martha Merrill. Thank you for your time, encouragement, ideas and, most of all, editing skills.
ABSTRACT
This qualitative study explores mathematics education from the perspective of community college students who are recent graduates of a rural high school. The research questions relate to the students’ perception of their understanding of rural, their rural high school experience, the factors that contributed to their preparedness or lack of
TABLE OF CONTENTS
CHAPTER PAGE
I. INTRODUCTION ... 1
Statement of Problem... 5
Purpose of the Study ... 6
Research Questions... 6
Basic Assumptions... 7
Research Methods, Procedures, and Analysis ... 7
Definition of Terms ... 8
Limitations ... 11
Delimitations... 11
Organization of the Study ... 11
II. REVIEW OF THE LITERATURE... 12
Growing Up Rural ... 12
Rural Students ... 13
Rural Schools ... 13
Rural Communities ... 15
Rural Education in Tennessee... 17
Mathematics Achievement in Rural Schools ... 17
Community Colleges ... 20
History and Mission ... 20
Remedial/Developmental Education... 22
Characteristics of Developmental Students ... 24
The Developmental Studies Program in Tennessee... 25
Developmental Students at PSTCC ... 27
Developmental Mathematics Curriculum ... 28
High School Preparation for College-level Mathematics ... 29
Research ... 29
Initiatives... 34
Summary ... 35
III.THEORETICAL FRAMEWORK AND METHODOLOGY ... 37
Theoretical Framework... 37
Methodology ... 38
Descriptions of the Schools and Counties ... 41
Schools Located in Transitional Counties ... 42
Schools Located in At-risk Counties ... 43
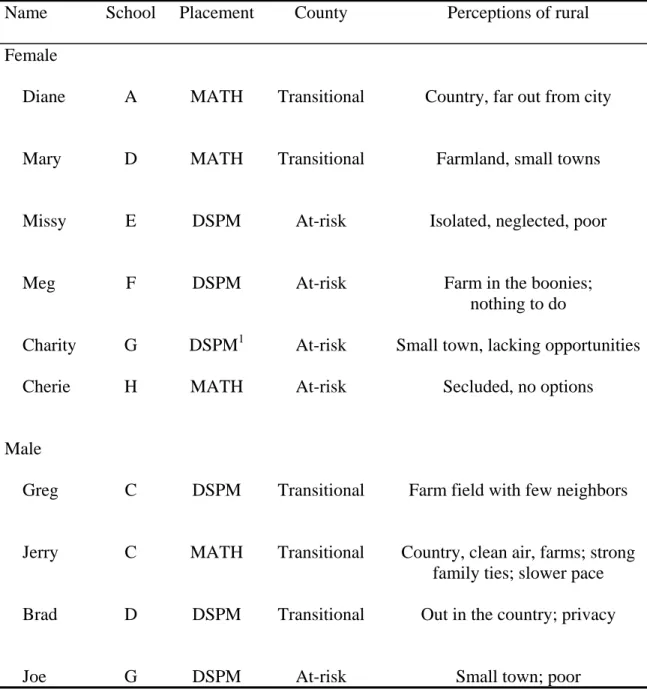
Descriptions of the Students Interviewed ... 52
Graduates from Schools Located in Transitional Counties ... 54
Graduates from Schools Located in At-risk Counties ... 56
Analysis of Interviews ... 58
IV. FINDINGS... 62
Themes... 62
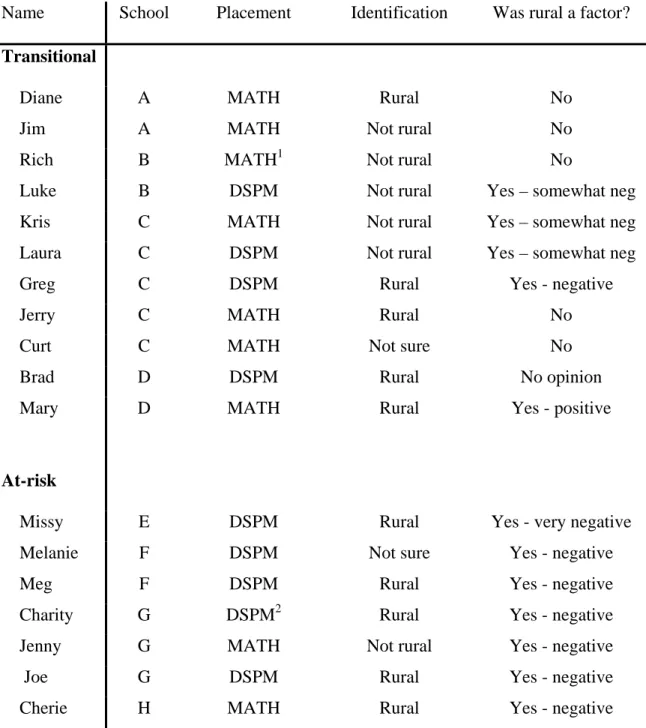
Rural Identification ... 62
Factors that Influence the Students’ Perception of Rural ... 66
Students who Self-Identified Rural... 66
Students who Self-Identified Non-Rural or Not sure ... 69
Growing Up Rural... 70
Students from At-risk Counties ... 71
Students from Transitional Counties ... 79
High School Mathematics... 85
Students from At-risk Counties ... 86
Students from Transitional Counties ... 91
Preparation for College-level Mathematics ... 97
Students from At-risk Counties ... 97
Students from Transitional Counties ... 100
Rural Influence... 103
Students from At-risk Counties ... 105
Students from Transitional Counties ... 108
V. DISCUSSION, REFLECTIONS, AND RECOMMENDATIONS ... 110
Discussion... 110
Question 1: What are the students’ perceptions of growing up rural?... 110
Question 2: What are the students’ perceptions of their rural high school mathematics experience? ... 111
Students from At-risk Counties ... 111
Students from Transitional Counties ... 112
Question 3: What are the students’ perceptions of the factors that contributed to their preparedness or lack of preparedness to take college-level mathematics? ... 113
Students’ Attitude and Motivation... 113
Teachers’ Instruction and Expectations ... 114
Curriculum Alignment with Assessment and Remediation... 115
Question 4: What are the students’ perceptions of the effect that growing up rural had on their high school mathematics experience and their preparedness for
college-level mathematics?... 116
Students from At-risk Counties ... 116
Students from Transitional Counties ... 117
Reflections ... 117
Mathematics Education... 117
Rural Education ... 121
Teacher Education and Professional Development ... 123
Recommendations... 124
Recommendations to High School Mathematics Teachers... 124
Equity... 124
Pedagogical Management ... 124
Professional Development ... 124
Collaboration... 125
Technology ... 125
Recommendations to High School Administration ... 126
Professional Development ... 126
Administration ... 126
Assessment... 126
Collaboration... 127
Technology ... 127
Recommendations to State Policy Makers ... 128
Recommendations to Community College Faculty and Administration ... 128
Equity... 128
Professionalism ... 128
Collaboration... 129
Technology ... 129
Recommendations for Future Research ... 130
REFERENCES ... 131
APPENDICES
... 143APPENDIX A: Survey ... 144
APPENDIX B: Interview Questions... 145
APPENDIX C: Informed Consent Form ... 146
APPENDIX D: Spradley’s Semantic Relationships ... 148
APPENDIX E: Semantic Relationship Worksheet... 149
APPENDIX F: Outline of Findings ... 150
LIST OF TABLES
TABLE PAGE
Table 1 Cut-off Scores for Placement in DSPM... 9
Table 2 Cut-off Scores for the Gateway Algebra I Test ... 10
Table 3 Selected Descriptions of Location of High School Based on 2000 Census ... 46
Table 4 Selected Characteristics of High Schools based on Report Card 2005 ... 47
Table 5 Descriptions of Students Graduating from a High School in a Transitional County... 55
Table 6 Descriptions of Students Graduating from a High School in an At-risk County 57 Table 7 Students who Self-identified Rural... 67
Table 8 Students who Self-identified Non rural or Not sure ... 68
Chapter I
INTRODUCTION
In an article written in 2005 for the Nashville newspaper, The Tennessean, Leon Alligood describes a sentimental picture of rural:
…rural is elbow room, the faint smell of manure and silage, small town cafes where sun-bronzed farmers gather in the morning for coffee and scrambled eggs, water tanks spray-painted with “Go Wildcats” or “John loves Suzy,” traffic jams caused when a corn combine ambles down a state highway moving from one field to another and, on a cloudless night, a universe of stars twinkling from horizon to horizon.
a farm-dependent economy, where agriculture is the primary economic engine…While agriculture nets about $2 million dollars in sales in Tennessee, it’s dwarfed by the income of manufacturing and service industries.” In the old economy, workers could earn a decent living with an eighth grade education; now overseas competition has reduced the number of manufacturing jobs (U.S. Department of Agriculture, 2003), and employers want an educated and skilled workforce. Rural areas are more likely to have a single industry control the economy, thus making the worker more vulnerable to lay-offs. Rural Appalachian areas are now attracting tourists and wealthy retirees and have a higher proportion of low-wage, low-benefit jobs than urban areas. Therefore, young people are leaving to find work in nonrural areas, usually cities, which offer better jobs with higher salaries (Kannapel & DeYoung, 1999). This migration between rural and metropolitan areas is a major factor in population growth and decline (Herzog & Pittman, 1995). The need for rural economic development is obvious, especially in isolated and depressed areas. Most observers agree that schools have a role to play in this process.
The focus of this study is students who graduated from a rural high school and attend a community college in the Appalachian region, the area of land stretching along the Appalachian Mountain range. All of West Virginia is in Appalachia as well as parts of twelve other states from New York to Mississippi. This region has become
unemployment as well as dependency on state and federal supplemental income are high (Chenoweth & Galliher, 2004). Poverty is the strongest and most continuing threat to high school achievement (Rural School and Community Trust, 2004).
DeYoung (2002) reminds us that historically the role of schooling, including rural, was not for academic achievement, but for character training and for very basic instructional skills. In Appalachia, schools were part of the community, and students were taught skills that would perpetuate the community. More recently, schools have become the place where young people learn academic skills that will equip them to leave the community. Educated young people are often overqualified to work in the local community and must leave to find work commensurate with their qualifications or education. Many rural students are not eager to leave their families and communities and subsequently decide to take lower paying jobs just to stay close to home.
Rural schools and districts are typically small. Khattri, Riley, and Kane (1997) state that this is an advantage since small schools are in many ways more effective than large schools. Small schools tend to foster a positive school climate, an orderly
In 1896, national politicians and educators declared rural schools ineffective, inefficient, and inferior to their urban counterparts. The solution was to centralize and bureaucratize the management of schools through consolidation, and to upgrade academic standards through professionalization of teaching (Kannapel & DeYoung, 1999). These urban style reforms were forced on rural schools with the urban model held as the goal for educational excellence (DeYoung, 2002). With declining rural
enrollments, large, centrally located consolidated schools were built despite the
opposition of the local rural community. Other incentives for consolidating schools were improved transportation, increased curricular offerings, and appeasement of state
financial woes.
schooling than ever before, rural youth are less likely to take college-preparatory classes and to attend college than their urban counterparts (Stern, 1994). This trend is likely determined by the few economic opportunities that are available in the local community.
Hatfield (2002) claims that a culture of failure in school mathematics exists and permeates rural communities. This means that failure to understand or achieve in
mathematics is socially acceptable. Hatfield challenges mathematics educators to search for, and discover, the unique, contextual factors that apply to teaching mathematics to rural children. This challenge is echoed in the mission statement of the Appalachian Collaborative Center for Learning, Assessment, and Instruction in Mathematics
(ACCLAIM), one of the 15 Centers for Learning and Teaching funded by the National Science Foundation (Appalachian Collaborative Center for Learning, Assessment, and Instruction in Mathematics [ACCLAIM], 2002). ACCLAIM seeks to “examine rural schools as they serve or subvert the development of mathematical knowledge and expertise….” (ACCLAIM, 2002, p.2).
Statement of Problem
Mathematicians and math educators have failed to focus on the rural culture with the same enthusiasm and depth as they have taken on urban issues. Bush (2005) cites Kannapel and DeYoung (1999) saying that “rural areas are ignored by national
movements” (p. 2) with state and national standards conflicting with community needs in many rural areas. For many educators, Appalachia denotes a place of deprivation,
system in the same manner. As smaller schools were consolidated into larger, more efficient ones, many people perceive rural schooling as deficient (Bard, Gardener & Wieland, 2005). Educators know little about the communities where these students live, or how satisfied the students are with their schools and communities. The goals of this study are to identify and appreciate the students’ talents, gifts, and rural values, and to learn about the mathematics education they received in a rural high school.
Purpose of the Study
This study will explore rural high school mathematics education from the perspective of East Tennessee, community college students. The students are rural high school graduates attending Pellissippi State Technical Community College (PSTCC) and are either placed into a college-level or a developmental mathematics course, according to their placement score on the ACT or ASSET mathematics test. Participants in the study are traditional-age, between the ages of 18 and 25.
Research Questions
The purpose of this study is to investigate the following questions: 1. What are the students’ perceptions of growing up rural?
2. What are the students’ perceptions of their rural high school mathematics experience?
4. What are the students’ perceptions of the effect that growing up rural had on their high school mathematics experience and their preparedness for college-level mathematics?
Basic Assumptions
I will assume the following statements are true.
1. The student is honest in describing his or her high school experiences. 2. The method of determining a student’s ruralness using the definition of the
Census Bureau and the Tennessee Department of Education is accurate. 3. The researcher’s analysis is comprehensive, and the findings are correctly
described.
Research Methods, Procedures, and Analysis
I used the principles of grounded theory to guide me through data gathering and analysis. Data was collected from interviews. I interviewed students in an appropriate area on one of the three campuses, Parkway, Division Street, or Magnolia Avenue, or the Blount County center. A professional transcriptionist recorded each interview. I read each interview looking for themes and categories and identified the major domains, based on a rereading of the data, and assigned each a code. As data collection continued, this step was repeated. After the last interview was completed and analyzed, I made a rough outline of the salient domains and then reread the data looking for the included terms. I marked excerpts in the data that supported or did not support the relationship and searched for themes across the domains by constantly looking for similarities and
differences among the domains. I created a master outline stating the relationships within and among domains and then reread the data selecting quotes to support my findings and included them in the outline. From the outline, I wrote the findings.
Definition of Terms
Rural: Schools designated by National Center for Educational Statistics (NCES) as Rural Inside or Outside Metropolitan Statistical Areas (MSAs) are classified as rural for the purposes of this study. Urban area (UA) and urban cluster (UC) consists of area with a population density of at least 1,000 people per square mile and surrounding areas that have an overall density of at least 500 people per square mile. Rural consists of all territory, population and housing units located outside of UAs and UCs.
Rural/outside Core Based Statistical Area (CBSA): Any incorporated place, Census designated place, or non-place territory not within a CBSA or Consolidated Statistical Area (CSA) of a Large or Mid-size City and defined as rural by the Census Bureau.
Rural/inside CBSA: Any incorporated place, Census designated place, or non-place territory within a CBSA or CSA of a Large or Mid-size City and
Developmental Mathematics: non-credit mathematics courses at the community college level for students who need remediation in mathematics based on standardized placement test scores. Developmental mathematics courses are part of the Developmental Studies Program (DSP) in Tennessee and are referred to as DSPM courses. Developmental mathematics courses consist of basic mathematics (DSPM 0700), elementary algebra (DSPM 0800), and intermediate algebra (DSPM 0850). Students under the age of 21 in Tennessee take the ACT during high school or at the testing center at the community college. Scores on the ACT Mathematics Assessment range from 0 to thirty-six. Table 1 indicated how placement is determined. The student may retake the ACT to achieve higher placement. The table on the ACT website relates the scores on the ACT
mathematics’ test to skills taught in high school mathematics classes. (http://www.act.org/standard/planact/math/index.html
Students 21 years of age or above take the ASSET test, a placement test developed by ACT. Each of the ASSET mathematics tests is multiple choice. The basic skills test consists of 25 questions with 25 minutes allowed to take the test. A calculator is not allowed. Students can also choose to take the Elementary Algebra test or the Intermediate Algebra test. Each of these tests consists of 25 problems with 25 minutes allowed to take the test. A calculator is allowed on the algebra tests. Typically, a student will take two tests, either the numerical skills and the elementary algebra tests, or the elementary and intermediate algebra tests, depending on the student’s mathematical background. The ASSET test is given in the testing center at PSTCC. (http://www.act.org/asset/pdf/guide.pdf)
College-level Mathematics: mathematics courses starting with the entry level courses of: MATH 1010 Foundation of Mathematics, MATH 1130 College Algebra, MATH 1410 The Structure of the Number System, MATH 1530
Elementary Probability and Statistics, MATH 1730 Precalculus. Even though the topics are taught in many high school mathematics courses, these courses are traditionally considered college-level with college credit. All of these are transferable courses to the University of Tennessee Knoxville (UTK) and institutions within the Tennessee Board of Regents (TBR) system.
Table 1 Cut-off Scores for Placement in DSPM
Score Range Placement
Algebra 1 Gateway Test: Students entering ninth grade during the 2001-2002 school year must be Proficient or Advanced on the Algebra 1 Gateway test to receive a diploma. The following table shows the scores needed to meet the Proficient and Advanced Levels on the Gateway examination. These scores were determined by the State Department of Education after field-testing. The test contains sixty-two multiple-choice questions. The scores are the total number of questions marked correctly. A graphing calculator and a reference page with formulas and equations are allowed. Students may retake the Gateway test if needed. For Summer 2005, the passing scores, presented as number of items answered correctly, are in Table 2.
Traditional Students: students under the age of 25 who enter college immediately following graduation from high school.
At-Risk Counties: counties at risk of becoming economically distressed. These counties have three-year average unemployment rates at least 1.25 times the national average, per capita market income no greater than two-thirds of the national average, and poverty rates at least 1.25 times the national average; or they meet the criteria for two of the three distressed-level indicators. This economic level was adopted in fiscal year 2006 for the purpose of monitoring economic change and planning for investments in potentially distressed counties.
Transitional Counties: counties that have rates worse than the national average for one or more of the three economic indicators (three-year average unemployment, per capita market income, and poverty) but do not meet the criteria for the distressed or at-risk levels. At-risk and Transitional are two of five County Economic Status Designations in the Appalachian region for fiscal year 2006 determined by the Appalachian Regional Commission (ARC). A description of each economic level is provided at the ARC website.
http://www.arc.gov/index.do?nodeId=2934
Table 2 Cut-off Scores for the Gateway Algebra I Test
Limitations
This study depended upon the honesty and openness of the students interviewed. Students interviewed were enrolled at the community college fall semester 2005 and who consented to an interview. This meant that the student was most likely still attending class and had time in his or her schedule of classes for an interview. These two factors impacted the students interviewed.
Delimitations
Students were classified as rural according to the high school from which they graduated. Many students did not feel that they grew up in a rural community or that their ruralness affected their mathematics education.
The data is a representation only of the population being studied. The results may not transfer to other community colleges.
Organization of the Study
The study is divided into five chapters. Chapter One is an introduction to the study - stating the problem, purpose, and need for the study. In addition, Chapter One includes the limitations, the delimitations, and assumptions of the study, defines relevant terms, and states the research questions. Chapter Two is the review of the literature on rural communities, schools, and mathematics education. Community colleges,
Chapter II
REVIEW OF THE LITERATURE
Growing Up Rural
In 1994 Stern wrote that “all Americans have a stake in the health and well-being of Rural America”(p.1). She states that the United States has depended upon the
resources and family values of rural America to build its material wealth, stable
communities, and local businesses. But, rural communities are experiencing change, and this change continues to undermine the good and unique qualities of rural America. Economic disruption, out-migration of the better educated, and growing poverty are three major forces driving this change. The National Center on Addiction and Substance Abuse (CASA) researched the growing problem of alcohol and drug abuse, gang activity,
adolescent pregnancy, and homelessness and found rural students just as involved as urban students in these activities, and in some cases, even more so (Rouk, 2001). A workshop hosted by East Tennessee State University College of Public and Allied Health in 2005 brought together 30 community and educational stakeholders from six different states. The group discussed the problem of substance abuse in Appalachia, concluding that “the problem impacts entire communities and the region, is widespread and underreported…” (p.2).
Rural Students
Rural students tend to be Caucasian and attend schools with a low minority enrollment, although the distribution of minority students varies greatly from region to region. Rural students are less likely to be living with single parents and have a college-educated parent than urban or suburban students (Herzog & Pittman, 1995). Blackwell and McLaughlin (1999) used data from surveys of 1,180 rural and 4,384 urban young people and found that rural youth have only slightly lower educational goals than do urban youth, partly because they are less likely to have educated parents with
professional occupations. Hektner’s study (1995) of eighth, tenth, and twelfth graders in the Midwest found that rural youth, especially males, feel “more angry and empty about their futures”(p. 12), validating the conflict that rural youth experience over whether to stay or leave their family, friends, and community to find better jobs or educational opportunities. In rural Appalachia, high school students have lower educational
aspirations than their urban or suburban counterparts and struggle with the need to leave the area to find work or further their education (Howley, Harmon, & Leopold, 1996). Rural Schools
tight knit social structure of rural communities promotes parental involvement, which in turn is an important factor in student success.
On the other hand, small schools typically cannot provide the advanced or college preparatory course work, and special programs, such as the gifted and talented, are limited. The quality of teachers is a major problem in rural areas (Schwartzbeck & Prince, 2003), and technology has not been implemented in rural schools to the same extent as in non-rural schools (Griffin, 2005). Rural schools often lack the monetary resources to fund improvements, and the “rural school educators cite lack of time and the fact that they already ‘wear many hats’ as major barriers to change” (North Central Regional Education Laboratory [NCREL], 2003, p.2).
Bush (2005) states that rural schools share many of the characteristics of poor schools reported by Haberman (1991). Among these are a curriculum that is irrelevant to the lives of the students and the passive role of the student in the learning process. In contrast, Stern (1994) argues that rural schools tend to be better places for learning compared to their urban or suburban counterparts in terms of teacher andstudent
absenteeism, learning environment, student misbehavior, and alcohol and drug use. Since 1994, others maintain that rural schools and communities have adopted a more urban lifestyle, buying into “standardization, specialization, competition, capitalism, and consumerism” that characterize larger population areas (Harmon, 1999, p.22). Rouk (2001) blames the
including satellite television and the Internet have
contributed greatly to relieving some of the isolation that rural youth face. On the flip side, these technologies have initiated rural youth to urban culture, including gang culture and dress. (p. 2)
Rouk contends that despite the changing nature of the community, “schools remain the one institution in rural communities around which most residents are likely to rally on behalf of their youth” (p. 3).
Rural Communities
Rural communities are often isolated geographically and culturally, have limited economic development, and have restricted educational and cultural activities (McCombs & Bansberg, 1997). There are many disadvantages to living in southern, rural
communities, such as a weak and declining business base, inability to generate adequate tax base, isolation from growing jobs, aging public facilities, difficulties attracting and retaining qualified teachers, and the poverty level (Southern Governors’ Association, 2004). Compared to urban areas, Kannapel and DeYoung (1999) state that rural areas have a higher proportion of low-wage, low-benefit jobs. Rural per capita income in Tennessee is well below the national median for per capita income. Rural per capita income not only measures poverty, but the level of economic distress and well-being among rural people (Johnson & Strange, 2005). For many years in the south, agriculture was the dominant employer, but this has changed to production or laborer jobs in
urban areas for work, shopping, and health care. The rural community looses the loyalty of its inhabitants and its capacity to be a change agent (Hobbs, 1994; Rouk, 2001).
Despite these negative attributes, rural communities still have social
characteristics that make them safer and friendlier places to live, and the citizens typically have traditional values of discipline and hard work. Howley et al. (1996) found that the people of the southern Appalachians have a strong identification with place and close ties with others in their community. This identification with place, known in educational circles as place-based education, can “create a link between what students are learning and how that relates to the world around them. It attempts to build students’ pride in the community where they live. ” (NCREL, 2003, p. 2) Long et al. (2003) state that place-based pedagogy and curriculum tries “to reverse the out-migration of rural youth and the devaluing of rural communities” (p. 4). The drawbacks to place-based mathematics education discussed by Bush (2005) are significant; lessons that are developed by teachers for specific locales “provide a limited view of mathematics…[Students] do not always engage in mathematics as an axiomatic system, as a way of thinking…or
Rural Education in Tennessee
Why Rural Matters 2005, a report by the Rural School and Community Trust, states that in Tennessee nearly half (47.3%) of rural students are eligible for subsidized meals. Subsidized meal rate is the most common measure of student poverty used in educational research. Eleven states have more than fifty percent of all rural students eligible for free or reduced price meals; Tennessee ranks twelfth. In Tennessee, adult educational attainment is the third lowest in the United States; rural spending for instruction is among the nation’s lowest; and graduation rates and NAEP scores are below national medians (Johnson & Strange, 2005).
Mathematics Achievement in Rural Schools
McIntire (2000) went a step further by investigating state-level differences in rural versus non-rural mathematics achievement. Lee and McIntire conducted a systematic study of National Assessment ofEducation Progress (NAEP)national and state mathematics assessments of eighth graders in 35 states. Overall, students in the nation’s rural schools showed highly comparable levels of achievement relative to their non-rural counterparts in 1992 NAEP eighth grade math. By 1996, rural students started to outperform non-rural students. Lee and McIntire also found substantial variations among states in rural student achievement and schooling conditions.
From these assessments, Howley (2003) concludes that a gap in national rural versus non-rural achievement does not exist. Neither does a national rural versus suburban, nor a national rural versus urban mathematics gap exist. At the state level, a rural versus non-rural achievement gap exists in 40% of the states – half favoring rural students.
In 2000, the Southern Regional Education Board’s (SREB) high school
had a mean score of 296, one point below the Basic level. Students who completed less than the recommended curriculum had mean scores of 278. Students who took
mathematics during their senior year had a higher mean score than students who did not. This study found that these schools put little emphasis on high expectation and quality student work and failed to provide their students with the kind of support that is needed to enter and succeed in higher-level mathematics courses (Bottoms & Carpenter, 2003).
females enrolled in higher percentages in Algebra II, Geometry, Advanced Algebra, and Precalculus; males outscored females across locale, location, and SES on the ACT mathematics test.
Community Colleges
History and Mission
At the beginning of the twentieth century, there was great diversity in the quality and availability of secondary education. Junior colleges came about as part of the
restructuring of secondary education. Junior high schools and junior colleges developed concurrently from 1910 to 1920. Junior colleges provided the first two years of a four-year program at a university and were organized under the “auspices and authority of the local school districts” (Boswell, 2000, p. 1). During the 1960’s, states transferred the governance of junior colleges to postsecondary governing boards. By 1970, junior colleges were renamed community colleges reflecting the emphasis of the college on the educational needs of the community. Providing for the diversity of a larger student body became the challenge of the college (Gleazer, 1994). Community colleges are not to be equated with two-year colleges. Adelman (2005) differentiates between the two with the following definitions:
not-for-profit associate degree-granting institutions, and (c) any for-not-for-profit institution at which the degree awarded is the associate. (p. 12)
Community colleges have an open-door admissions policy stating that any high school graduate can enroll. Before this policy, the traditional college student was a white, adolescent male from a typical family paying his tuition. As a result of this policy, students were admitted unprepared to do college-level work. These students were
women who postponed going to college for family and work, people with a midlife career change, students of color, and physically challenged students. In 1993, only 43% of America’s higher education students were considered traditional (Martens, Cordova, & Harris, 1995). Now, community college students are more diverse than those in any other public education institution. Female students account for 58% of the students. Half of the students work part-time, a third work full-time, and 30% of all students enrolled full-time also work full-time. The average age is 29, and almost one third of the students receive some financial aid (Rosenfeld, 2001).
Adelman (2005) states that in order to best describe and understand community-college students, age must first be considered. Traditional-aged students have different backgrounds, family and job commitments, and consequent academic behavior and progress compared to older students. Traditional-age students break down into six populations: (1) a “persistent group” with the goal of transferring and earning a bachelor’s degree, (2) an “equally persistent group” with the goal of earning an
who are based at other colleges, often a four-year school, (6) a small group of students who started out at the four-year school, changed their mind about a four-year degree, and ended up at the community college.
The comprehensive mission of today’s community college is to provide
educational services to local communities. These include transfer programs, literacy and language skill development, remedial and developmental education, career counseling and vocational training, and community cultural classes and events (Gleazer, 1994). Education beyond high school is a must according to Stanford University economist Paul Romer (Friedman, 2005). He goes on to say that the government must creatively
encourage students to pursue post secondary education, just as the high school
movement, the GI Bill, and the modern university encouraged students in the twentieth century. The result of post secondary education will qualify more people for the technical jobs of the 21st century, but it also “shrinks the pool of people able to do lower-skilled work, from road maintenance to home repair… By shrinking the pool of lower-skilled workers, we help stabilize their wages…because there are fewer people available to do those jobs” (p. 289).
Remedial/Developmental Education
Brier (1984) states that colleges and universities have always offered precollege-level courses designed to teach the academic skills necessary for success in college. Traditionally, these remedial classes were only concerned with the improvement of academic skills. But students needed much more than just refresher courses; there were many other factors involved in academic success such as self-confidence, study
behaviors, and social competence. The combining of remedial instruction with personal and academic development puts a different perspective on what have been called remedial courses. Since 1970, developmental education has recognized contributions from the fields of cognitive and developmental psychology. Today’s developmental education includes all forms of learning assistance and personal development. The NCES data for 1995 estimates that 40% of each year’s incoming students at the average
community college are to some extent inadequately prepared (Boylan, 2001). The causes are many and are often the result of socioeconomic, cultural, and individual differences (Spann, 2000).
open-door institutions has encouraged students to take demanding college admissions lightly”(p.3). At the college-level, remedial courses take away from the education of prepared students by “dumbing down” courses. Many four-year colleges and universities make a case that developmental/remedial courses don’t belong on their campuses and should be relegated to the community college. Damashek (1999) uses the work of Zumeta (1998) and Boylan (1995) to argue that this would create an “academic caste system” (p. 2) between two- and four-year schools and may limit opportunities for students andenrollment for four-year schools. Ignash (1997) cites the fall 1995 NCES study that found state policies tended to designate community colleges as the “preferred provider of remediation” (p. 8). She claims that educators believe that this is best since the emphasis at community colleges is on teaching and learning, and the cost of
instruction is lower.
Characteristics of Developmental Students
A significant number of remedial students were first-generation students - the first in their family to attend college (Roueche & Roueche, 1999). Terenzini, Springer,
Yaeger, Pascarella, and Nora (1996) studied 2,685 students who entered their first year of college in 23 diverse institutions in fall 1992. There were 825 first-generation students and 1,869 traditional students. First-generation students were more likely to come from low-income families, to have weaker cognitive skills, to have lower aspirations and be less involved with peers and teachers in high school. The overall description of a generation student was that of a student at-risk. Despite these characteristics, first-generation students were found to have better academic performance and persistence. York-Anderson and Bowman (1991) found that first-generation college students might find college more stressful and need more guidance since they had fewer experiences with college-related activities and role models.
The Developmental Studies Program in Tennessee
According to the PSTCC (2005) narrative written for the application for National Association for Developmental Education (NADE) certification,
college….In 1984, Tennessee’s State Board of Regents published a White Paper entitled Remediation and Developmental Studies: Developing a Plan to Educate Underprepared Post-Secondary Students in SBR
Institutions. The plan presented in the White Paper defined remedial instruction using the state’s published “Objectives for the Tennessee Proficiency Test,” given in high school. To define developmental-level coursework, the White Paper endorsed the competencies and curriculum of the College Board’s Educational EQuality Project.…Two months after publishing the White Paper, the Board of Regents published the operational plan to implement the program of remedial and developmental instruction….The implementation plan required preliminary screening of applicants using ACT scores (or SAT equivalent) and high school transcripts, mandatory testing for students with deficiencies in academic areas, and mandatory placement based on diagnostic placement tests when required….In fall 1985, the first remedial/developmental courses were
offered at Pellissippi State (p. 6-7).
coursework was defined as basic computational arithmetic, and developmental mathematics coursework was defined as algebraic computations. An analysis of Tennessee Higher Education Commission (THEC) data revealed that the majority of remedial and developmental courses were taken by first-year freshmen. Remedial courses were less common among recent high school graduates than among those who had graduated a year or more before entering college. The proportion of first-time freshman taking any remedial and developmental classes declined from 55.7% fall 1992 to 49.4% fall 2000 (THEC, 2002a). The SREB (2006) report stated that 39% of first-time/full-time freshmen in Tennessee public colleges and universities in the fall 2005 enrolled in a remedial/developmental course. Separating the data reveals that 67% were attending community colleges and 25% were attending four-year institutions.
Developmental Students at PSTCC
At PSTCC, 17% of the 7,562-degree credit students enrolled fall 2004 were first-time freshmen. After assessment, 69% of the first-first-time freshmen were placed into
developmental studies program (DSP) coursework. Of these 872 first-time freshmen who placed in DSP coursework, 69% were 18 to 20 years old (Office of Institutional
Effectiveness, Research, and Planning, Focus Report, Table E).
The percentage of first-time freshman required to take a DSP course fall 2005 was slightly lower, 67.72%. By age, 72.34% of these students were between 18 and 20. The number of first-time freshmen required to take a DSPM course was 832 or 59.94%, with 69 % of the 832 students in the age range of 18 to 20 (S. J. Thomasson, personal
In Tennessee, a score of at least 19 on the ACT Mathematics test allows a student to enroll in entry-level college mathematics courses. Nationally, 48% of high school seniors score below 19 on the ACT Mathematics test (Abraham & Creech, 2000).
According to the State of Tennessee Statewide Report Card 2005, students in grades nine through twelve who took the ACT mathematics test scored 19.7 compared to 19.5 in 2004. These scores are based on a three-year average. The average ACT Composite score for 2004 was 20.3 and 20.5 for 2005
(http://www.k-12.state.tn.us/rptcrd05/state2.asp). For the 1,118 first-time freshmen at PSTCC in fall 2005 who declared a program of study out of a total of 1,388 freshmen, 40.88% had a ACT Composite score less than 19. Data for the ACT Mathematics test is not available for PSTCC students on the college website.
(http://www.pstcc.edu/departments/institutional_research/enrollreports.php). The curriculum students take when they do not meet the standards for placement in college-level mathematics courses is described in the following section.
Developmental Mathematics Curriculum
students, which affect the developmental mathematics curriculum. He argues that placement in developmental mathematics should not be considered a punishment but an opportunity to learn the mathematics necessary to be successful in college-level courses. The reasons why recent high school graduates are not prepared for college-level
mathematics are discussed in the following section.
High School Preparation for College-level Mathematics
Research
Most colleges offer a larger share of remedial mathematics courses than any other subject. One reason why students are unprepared for college-level mathematics is that many states do not require enough college-preparatory courses in mathematics for high school graduation. Tennessee is among many southern states that only require three math credits of Algebra I and higher. The neighboring states of Alabama and South Carolina require four mathematics credits (Algebra I and higher) for graduation from high school.
confirms that the level of high school preparation and grades earned are significant predictors of placement in remedial math.
The students’ failure to take a mathematics course their senior year of high school is cited by Abraham and Creech (2000) as another reason why students are not ready for college-level math. Even if high schools offer advanced math courses, students must take the courses and remain in the courses. Ma (1999) examined the effects of parental involvement on students’ dropping out of advanced mathematics courses. The researcher found that there are two critical transition points when students drop out. One is from grade 8 to 9, and the other is from grade 11 to 12. The most serious drop is from grade 11 to 12 when approximately 36% of the students dropped out of advanced mathematics. He suggests that students entering their freshman year may encounter one or two types of segregation; students from lower socioeconomic backgrounds may be attending schools that offer fewer advanced math courses, or students are coming from schools that already tracked students into a certain academic program. Ma concludes by saying that an
important strategy for reducing mathematics dropouts is to improve student’s attitude in the later grades in high school. He believes that offering more relevant math curriculum is a way of achieving this.
Haycock and Huang (2001) and Boswell (2000) state that the tests that most states administer to high school graduates are not aligned with the tests used for college
cover any mathematics in Algebra II or above, whereas college placement tests have many Algebra II, Trigonometry, and Precalculus questions. This discrepancy can be disastrous for the student and confusing to the public as to what “knowing mathematics” really means.
Gandal and Vranek (2001) argue that state standards are not rigorous enough. In response to such allegations, Tennessee has implemented an “end of course” testing system called the Algebra I Gateway test. Students entering ninth grade during the 2001-2002 school year were required to be Proficient or Advanced on the Algebra 1 Gateway test to receive a diploma. An interesting dilemma occurred in 2005 with respect to the testing of eighth grade mathematics students in Tennessee. State tests given to eighth grade math students indicated that 87% of the students performed at or above the proficiency level. The results of the NAEP tests were quite different; only 21% of the eighth grade students were proficient in mathematics (Dillon, 2005).
grade inflation were cited as factors that often lead students to believe that they are prepared for college.
Research shows that good teaching improves student’s achievement. Good teaching requires that teachers must know their subject matter and how to teach it (Haycock & Huang, 2001). The National Council of the Teachers of Mathematics (NCTM) has worked to improve the content and pedagogy of mathematics in grades K-12 by publishing Standards for School Mathematics in 1989, developing curriculum to support the standards, and revising the standards after reflection and feedback from teachers, mathematicians, and researchers. The Teaching Principle in the current Principles and Standards for School Mathematics (PSSM) states, “Effective teaching requires knowing and understanding mathematics, students as learners, and pedagogical strategies…. Such understanding might be characterized as ‘profound understanding of fundamental mathematics’”(NCTM, 2000, p. 17). Ball (n.d.) states that typical methods for improving the quality of mathematics instruction include increasing the subject matter knowledge of teachers. Despite a decade of work on improving teacher quality, large numbers of secondary teachers do not have the equivalent of a college minor in their teaching field. The 2004 Tennessee State Report Card on Higher Education states that only “59% of secondary school students are taught by qualified teachers, which is only average compared with top performing states” (National Center for Public Policy and High Education, 2004, p. 5).
surveyed. Over half the teachers felt that “helping students pursue a program of high school studies that will enable them to achieve their plans” and “helping students complete a program that prepares them for both employment and further learning” were “very important” schooling goals. In contrast, “developing students’ abilities to solve problems and think critically” was “very important” to 45.6% of the teachers, and “helping all high school students master the essential content taught in
college-preparatory language arts, mathematics and science courses” was very important to only 38.6% of the teachers (National Commission on the High School Senior Year, 2001a, pp. 12-13).
Stevenson and Stigler (1992) compared the academic achievement of American students to their counterparts in Asian countries. They found that American students were weak in mathematical operations and how to use these operations to solve meaningful problems. They did not account this weakness to deficiencies in intellect. Asian students were more persistent and displayed more effort than American students in mathematical problem solving. Parents in the United States were much more likely than Japanese parents to believe that innate ability as opposed to effort was the reason for success in mathematics (Schoenfeld, 1992).
If Asian students achieve mathematically because of persistence and effort, what are other factors that influence achievement? Ma (2001) studied high school seniors in the Dominican Republic, and found that a feeling of enjoyment, not the feeling of
difficult mathematics content easy to learn does not improve achievement. Presenting mathematics content in an interesting, attractive, and enjoyable way improved
mathematical achievement.
Students’ beliefs also influence learning. Schommer, Calvert, Gariglietti, and Bajaj (1997) cite a study by Schoenfeld (1983) that found that “high school students who do poorly in math tend to believe that mathematical problems should be solved in 10 minutes or they will never be solved and that only geniuses are capable of discovering mathematics” (p. 37). Schommer et al. found that students who believe learning takes time and effort earn a higher grade point average.
Initiatives
Recent initiatives, referred to as P-16 or K-16, which are currently being discussed in educational circles would address many of the problems discussed in this section (Boswell, 2000; Cohen, Finn & Haycock, 2004; Haycock & Huang, 2001; National Commission of the High School Senior Year, 2001b). The P-16 system of education would encourage K-12 and postsecondary education to become one seamless avenue for all students. It would work together with the current NCLB program to remove the barriers that leave high school seniors behind. The historical tracking system that denies many high school seniors eligibility to higher education and viable jobs would be replaced with a system that prepares all students for college and the workplace
(Haycock, at el., 1999). The high school exit exams would link with placement
Pre-Kindergarten through High Education in Tennessee (Tennessee State Board of Education & THEC, 2006) states that the “ACT results from 2005 indicate that only 16% of
Tennessee students attained scores predicting a 75% chance of obtaining a C or higher on credit-bearing college courses in mathematics and science” (p. 3).
This approach is in its infancy; therefore, high school students are graduating without attaining the levels of proficiency necessary for college-level work. Also, many non-traditional aged students are returning to college as jobs and careers change, and new skills are needed.
Summary
Rural schools are closely tied to rural communities, and therefore suffer from the current economic changes effecting jobs in the Appalachian region. Poverty,
out-migration of the educated youth, and loss of a tax-base impact the well-being and mental attitude of the school and the community. Many rural, high school graduates attend the local community college as a way to receive an affordable education, stay close to home, and acquire skills that will better their chance of earning a decent living in the area. These university-track graduates should be prepared by their local high school to succeed academically in college-level mathematics at the community college. Many fail to
Chapter III
THEORETICAL FRAMEWORK AND METHODOLOGY
Theoretical Framework
One of the aims of ACCLAIM is to understand the rural context as it pertains to the learning and teaching of mathematics (ACCLAIM, 2002). Howley, at el. (1996) claim that educators know little about the satisfaction level of talented rural youth with their own communities. Bush (2005) suggests that studies should consider what Appalachian community members believe and feel about mathematics as a school subject. Howley and Gunn (2003) state that qualitative researchers “have a better understanding of the
importance of locale than many quantitative researchers.” Most qualitative researchers are interested to discover and articulate the meanings attached to circumstance, places, and experience”(p. 94). Khattri, aat el. (1997) recommend qualitative analysis as opposed to studies based on national quantitative data. Burnell (2003) interviewed students for her study of work-bound, college-able, rural high school seniors and found that they were amazed that someone appreciated hearing about their lives and the decisions they faced. Roberts and Kay, Inc. (n.d.) used focus groups of randomly chosen middle and high school students to investigate “how …schools are doing and how they can be improved.” (p. 1) Finally, Byrnes (2005), in his remarks to the governors’ meeting of a national high school summit, recounts his finding from discussing and reading the accounts of recent high school graduates and implores the governors to “consider recent graduates’ insights and perspectives”(p. 39).
Postpositivist researchers work to describe close approximations of reality while maintaining an objective position in relation to the experience that they are studying. Researchers see themselves as “data collection instruments, and they use disciplined research techniques… to ensure that empirical data, and not their impressions, drive their findings. Postpositivists are interested in capturing participant perspectives but in
rigorously disciplined ways” (Hatch, 2002, p.14-15).
A qualitative approach serves this study because it answers the questions of “how” and “what.” Qualitative research provides a well-grounded, rich description of the real-world situation being studied. The design strategy of qualitative research allows openness to adapting the questions as understandings change. The participants are picked because they are rich with information, not because of a prescriptive sampling technique. The researcher can get close to the people and the situation being studied. A quantitative study primarily looks for comparisons of groups or relationships between variables; a qualitative study allows for exploration of the participants in their natural setting (Creswell, 1998). Maxwell (1996) explains that “the strengths of qualitative research derive primarily from its inductive approach, its focus on specific situations or people, and its emphasis on words rather than numbers.” (p. 17) In this study, participants tell their own stories. The purpose of inquiry in qualitative research, therefore, is to articulate a facet of the world “from the point of view of those who live in it.”(Clark, n.d.)
Methodology
traditional-age, high school graduates. Each student was placed in a college-level mathematics course (MATH) or a developmental mathematics course (DSPM) as a freshman. The students attended classes at one of the three campuses or one center of PSTCC. The students self-identified as rural, suburban, or urban.
I adopted Maxwell’s (1996) terminology, purposeful sampling, to describe the “strategy in which particular settings, persons, or events are selected deliberately in order to provide important information that can’t be gotten as well from other choices.”(p. 70) To make sure that my conclusions represented the range of rural students, I decided on the following eight categories:
1. Male; DSPM; self-identify rural 2. Male; DSPM; self-identify non-rural 3. Male; MATH; self-identify rural 4. Male; MATH; self-identify non-rural 5. Female; DSPM; self-identify rural 6. Female; DSPM; self-identify non-rural 7. Female; MATH; self-identify rural 8. Female; MATH; self-identify non-rural
I began the process of locating students with these qualities with a survey (see Appendix A) given to all sections of developmental mathematics and college-level
mathematics courses fall semester 2005. This was not my original method for identifying students who graduated from rural high schools, but since PSTCC was not able to
appropriate. The survey was conducted during the last third of the semester. Students who were attending class at this time were more likely to complete the course. On the other hand, many students had already withdrawn or stopped coming to class. On the survey, the student indicated the name and location of the high school where he or she took high school mathematics, the student’s age, gender, and the name of the math class in which the student was enrolled fall semester 2005. I also asked the student to identify him or herself as rural, suburban, or urban and whether the student was willing to be interviewed. If so, I asked for the student’s name, telephone number and email address.
Copies of the survey were distributed to every instructor teaching a college-level or developmental math course including PSTCC web sections, but not the Regents Online Degree (RODP) sections. I sent an email to all instructors explaining my research and the process that I was using to find rural students. Surveys were returned to me in person or by campus mail. I determined that 1,540 surveys were returned from a possible 3,513 students (43.8%) registered at the beginning of the semester.
The first step in sorting was to remove the surveys of students who did not
1. Male; DSPM; self-identify rural 16 2. Male; DSPM; self-identify non-rural 18 3. Male; MATH; self-identify rural 12 4. Male; MATH; self-identify non-rural 16 5. Female; DSPM; self-identify rural 24 6. Female; DSPM; self-identify non-rural 22 7. Female; MATH; self-identify rural 10 8. Female; MATH; self-identify non-rural 19
I decided to focus on students who graduated from rural high schools located in the top-feeder counties to PSTCC. Of the 1,063 first-time freshmen from top feeder schools fall 2005, 165 students (15.5%) graduated from three of the rural high schools chosen for this study.
(http://www.pstcc.edu/departments/institutional_research/ff_hs05f.php) I also intentionally included two K-12 schools, one located in a transitional county and the other in an at-risk county. The last three schools were picked because a large enough group of students had returned surveys to make it feasible to interview students who fit into several of the eight categories.
Descriptions of the Schools and Counties
seven schools were classified as rural, inside CBSA. Only High School H, located in an at-risk county, was classified as rural, outside CBSA.
Schools Located in Transitional Counties
High Schools A and B are located in the same county, the most populated county in my study. The population of the county grew by 13.8% from 1990 to 2000. Two major interstates intersect in the valley between the Great Smoky Mountains to the southeast and the Cumberland Mountains to the northwest. Agriculture, industry, tourism, and education provide employment. There are twelve high schools in the consolidated city and county public school system; only two are classified rural. High school A, in the northwest part of the county, is located in a community described by the principal as being economically and ethnically diverse. The school’s website describes the school’s atmosphere as “unique. Students from diverse backgrounds attend classes in a hospitable environment where they can be comfortable with each other and their surroundings.” School B, in the east part of the county, is described by the principal on the school website as a “comprehensive high school with an instructional program designed to meet the needs of the students….”
retirees. High School C is located 7 miles from the county seat, the largest town in the county, and affords a scenic view of the foothills of the Smoky Mountains.
School D has grades K-12 and is located in a small, rural community of 954 residents. This community, established during the 1800s as the result of railroad
construction, is known as “primarily an agricultural community with strong civic pride.” The community, in the southeastern part of the county, is about 23 miles from the county seat. It is situated within 10 miles of three Tennessee Valley Authority (TVA) lakes and, therefore, a popular retirement community. A website describes this community as being the place for families who “prefer simpler, less hectic lifestyles.” The population of the county increased by 25.1% from 1990 to 2000.
Schools Located in At-risk Counties
School E has grades K-12 and is located in a small, rural community on the north side of the mountain range that divides the county. It is the most isolated of the
communities under consideration.
High School F is located in a larger community on the south side of the mountain range in the same county as school E. This larger community is the county seat and was founded in 1798. The town has a population of about 2,500. The county is described on the Chamber of Commerce website as “the undiscovered gem of East Tennessee,
Industrial growth has been marginal. Presently, almost half of the people in the county travel to surrounding towns for employment. The population of the county grew by 20.8% from 1990 to 2000.
High School G is located in a county described as a haven for nature lovers. A nearby TVA lake provides water sports and camping. The school is located in the largest town, which has a population of 1,782. With the building of the dam and the formation of the lake, the population and economic conditions have changed significantly. Large numbers of people left the farms. More recent times have brought limited industrial growth. Presently 85% of the work force commutes to jobs outside the county. The population of the county grew by 30.0% from 1990 to 2000, which is the largest increase of any of the counties under consideration.
The information in Table 3 indicates that people living in the areas serving schools A through D tend to be better educated, have a higher income, and live in more expensive homes than those living in the communities served by schools E through H. Population age and ethnicity are very similar across all areas.
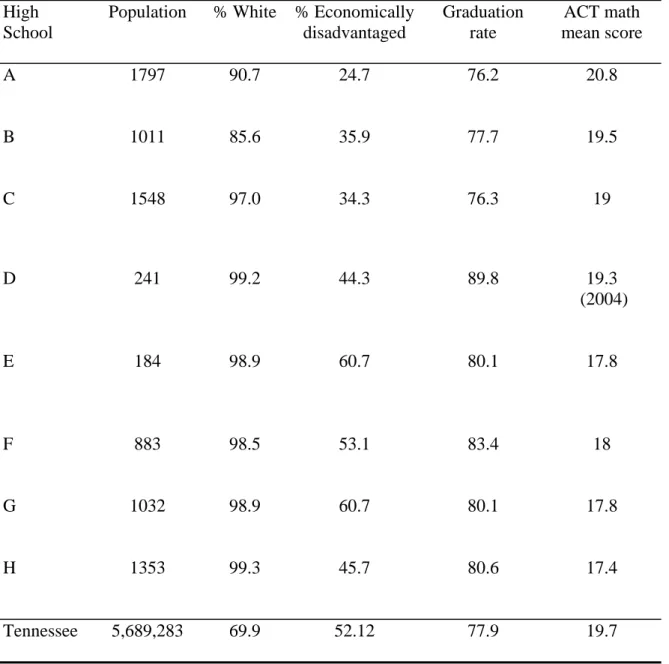
Information in Table 4 indicates that Schools A and B have a more diverse student body than the rest of the schools. Students in Schools E, F, and G are not as economically well off compared to students in all the other areas. Schools D through G have a higher graduation rate than Schools A through C. Schools A through D have a higher ACT Mathematics mean score.
I used the SIS at PSTCC to help build a more complete profile of each student. This system holds the student’s high school transcript, which includes the math courses taken in high school, grades, high school GPA, and standardized test scores. After
building all profiles, students were selected for interviewing whose profiles predicted rich data. I selected one student from a high school located in at-risk county who had
completed a sequence of algebra through precalculus courses at her high school with a high GPA. She was a freshman at PSTCC and had already withdrawn from her college algebra course.
Table 3 Selected Descriptions of Location of High School based on 2000 Census High
School location by zip code
Population Median age
% White % of 25+/ Bachelor’s Degree
% below poverty
level
Median household
income($)
A 18,203 35.8 95.2 30.8 6.2 45,314
B 8,487 36.8 97.1 7.4 11.2 35,378
C 21,966 37.6 95.5 15.4 10.2 35,482
D 4,241 38.5 97.1 11.6 9.7 39,487
E 2,563 36.2 98.6 4.9 20.0 26,300
F 7,123 39.2 98.1 9.9 17.0 27,163
G 9,517 35.4 98.5 5.5 20.3 27,200
H 8,970 36.3 98.2 9.3 16.3 31,219
Table 4 Selected Characteristics of High Schools Based on Report Card 2005 High
School
Population % White % Economically disadvantaged
Graduation rate
ACT math mean score
A 1797 90.7 24.7 76.2 20.8
B 1011 85.6 35.9 77.7 19.5
C 1548 97.0 34.3 76.3 19
D 241 99.2 44.3 89.8 19.3
(2004)
E 184
98.9 60.7 80.1 17.8
F 883 98.5 53.1 83.4 18
G 1032 98.9 60.7 80.1 17.8
H 1353 99.3 45.7 80.6 17.4
Descriptions of Mathematics Departments and Course Offerings
Two high schools have websites with information about the mathematics departments and teachers. Information from the other six schools was requested via a telephone conversation and sent by either the head of the mathematics department, the guidance counselor, or school secretary. One mathematics department chair did not return the requested information, and the information obtained after the end of the school year was provided by the assistant principal and the one mathematics teacher teaching summer school.
High School A employed twelve mathematics teachers fall semester 2005, three males and nine females. Teachers generally taught three courses each. One teacher taught three classes and the ACT Prep class; another teacher only taught Honors Geometry and AP Calculus. The school website did not list other responsibilities these teachers may have had such as coaching or sponsoring a club. The mathematics courses offered were: Foundations I, Foundations IA, Foundations II/Algebra IT, Math for Technology II, Algebra I, Algebra I (Accelerated), Algebra II, Algebra II (Accelerated), Algebra II (Honors), Geometry, Geometry (Accelerated), Geometry (Honors), Calculus (College Prep). Precalculus was not on the list. A detailed description of each course was found on the school’s website.
High School B employed nine mathematics teachers in the fall 2005, seven males and two females. One female, the head of the mathematics department, had taught
responsibilities, including the school “gopher,” basketball, soccer, tennis, and track coaches. Several teachers had undergraduate degrees in areas other than mathematics such as geology, industrial engineering, mechanical engineering, and education. Teachers generally taught two different courses a semester. Two teachers had taught at the high school more than 19 years; the remaining seven had each taught less than 10 years at this high school. The teachers who had only taught at the high school one and three years came to the school with teaching experience. Mathematics courses offered at the high school fall semester 2005 included Foundations I, II, Algebra I, II, Geometry, Advanced Algebra/Trigonometry, Precalculus, Calculus AB, and AP Statistics. Honors classes were also offered.
High School D, located in a K-12 school, employed three mathematics teachers during fall semester 2005, one female and two males who were described as returning retirees. The female teacher, who had responsibilities of chairing the mathematics department and coaching the girls’ basketball team, taught Advanced Algebra I,
Geometry, and Algebra II. She had a Bachelor of Science degree from Middle Tennessee State University (MTSU) and had taught at the school for ten years. One male taught Foundations I and II and was also the middle school girls’ basketball coach. The second male taught calculus in the fall semester and advanced mathematics/trigonometry in the spring semester. He had the additional duties of athletic director. Both males held undergraduate, graduate, and educational specialist degrees from UTK, and each had taught at the school for 30 years. Mathematics courses offered at the school during fall semester were the following: Foundations I and II, Advanced Algebra I, Algebra II, Geometry, and Calculus.
undergraduate degree in physical education and had taught at the high school for four years. She taught Gateway Algebra through Advanced Mathematics and Trigonometry. The three mathematics courses offered in the fall 2005 were Gateway Algebra,
Foundations II, and Geometry.
High School F employed seven mathematics teachers during the fall semester 2005. One teacher, a female, was terminated after one year, and the school is currently looking for a replacement teacher. The information given to me by the assistant principal via a telephone conversation was not as complete as the others, as the school year was over, the guidance counselor was not available, and the one mathematics teacher teaching summer school did not have time or feel comfortable giving me the requested
information. I did find out that three of the seven teachers were coaches; two had taught at the high school for only five years; the remaining four had been at the school longer. The summer school teacher had taught 18 years and had experience teaching all the mathematics courses. He had a Masters in Business Education from UTK. The
following courses are offered during the fall semester 2006: Competency in Mathematics, Foundations I, Algebra I, Algebra II, Geometry, and Precalculus.