Learning Goals Final List 2108-2019 MFM 1P Learning Goal 0: I can simplify numerical expressions. (NA)
Learning Goal 1: I can solve problems involving area and perimeter of simple and composite figures (MG)
Learning Goal 2: I can square and square root constants/variables and can use them to simplify expressions & solve equations (NA)
Learning Goal 3: I can solve problems with Pythagorean Theorem (MG)
Learning Goal 4: I can interpolate and extrapolate values in scatter plots with lines of best fit. (LR) Learning Goal 5: I can determine values in a linear pattern/relation (LR)
Learning Goal 6: I can solve ratio problems using equivalent ratios or cross multiplication. (NA) Learning Goal 7: I can determine and describe the properties and relationships of the interior angles of polygons. (MG)
Learning Goal 8: I can determine and describe the properties and relationships of the exterior angles in polygons (MG) Learning Goal 9: I can solve proportional problems by finding unit rates. (NA)
Learning Goal 10: I can classify a relationship as linear (direct or partial), or non linear. (LR)
Learning Goal 11: I can conduct experiments to establish relationships and test hypotheses. (LR) Learning Goal 12: I can solve problems involving the volume of prisms and cylinders. (MG) Learning Goal 13: I can solve problems involving the volumes of pyramids and cones. (MG) Learning Goal 14: I can simplify algebraic expressions by collecting like terms. (NA)
Learning Goal 15: I can multiply a polynomial by a monomial. (NA)
Learning Goal 16: I can create and interpret scatter plots by hand and using technology (LR) Learning Goal 17: I can represent a linear relation in various (4) ways. (LR)
Learning Goal 18: I can determine the rate of change of relationships. (LR)
Learning Goal 19: I can determine equations from graphs, tables or descriptions. (LR) Learning Goal 20: I can solve problems involving linear relations (LR)
Learning Goal 21: I can interpret the intersection point of two linear relationships (LR)
Learning Goal 22: I can connect graphs and written graphing stories of two-variable relationships. (LR)
Learning Goal 23: I can analyze Distance-Time Graphs, including speed and direction (LR) Learning Goal 24: I can solve problems involving volumes of spheres (MG)
Learning Goal 25: I can solve 1 and 2-step equations using a variety of tools and strategies. (NA) Learning Goal 26: I can solve multi-step (brackets) linear equations using a variety of tools and strategies (NA)
Learning Goal 27: I can convert between fractions, decimals, percents (NA) Learning Goal 28: I can solve problems involving percents of numbers (NA)
Learning Goal 29: I can solve problems involving the optimal dimensions of rectangles (MG)
Learning Goal 30: I can recognize the properties of co-interior (C-pattern), alternate (Z-pattern), and corresponding (F-pattern) angles when given parallel lines cut by a transversal. (MG)
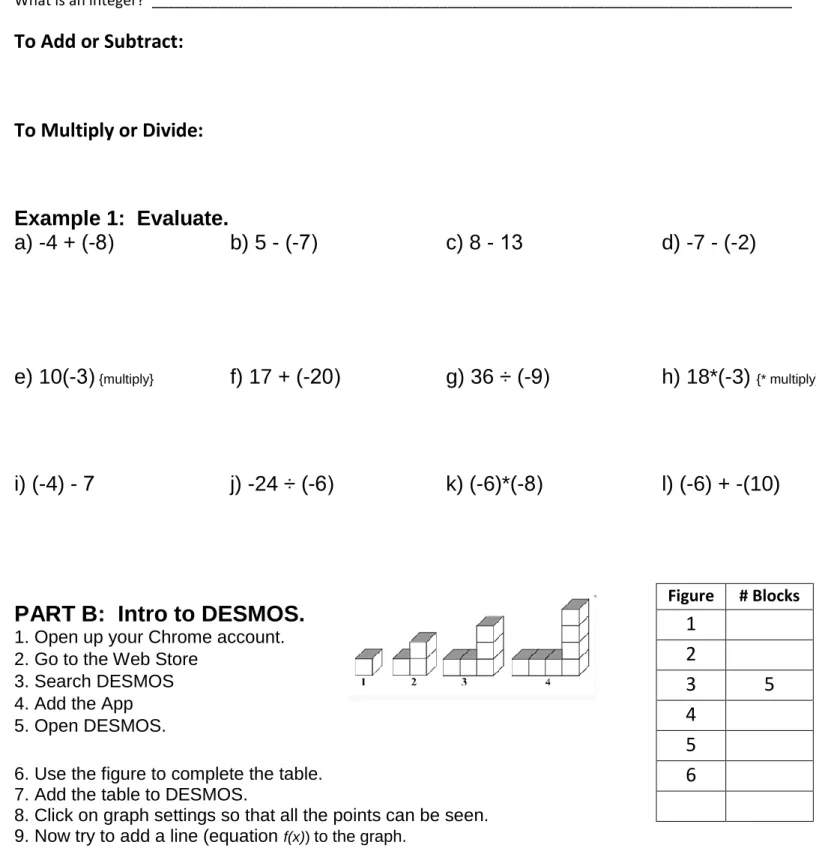
Lesson 1.0: Integers and an Introduction to DESMOS Learning Goal #0: I can simplify numerical expressions
What is an integer? ______________________________________________________________________________
To Add or Subtract:
To Multiply or Divide:
Example 1: Evaluate.
a) -4 + (-8) b) 5 - (-7) c) 8 - 13 d) -7 - (-2)
e) 10(-3) {multiply} f) 17 + (-20) g) 36 ÷ (-9) h) 18*(-3) {* multiply}
i) (-4) - 7 j) -24 ÷ (-6) k) (-6)*(-8) l) (-6) + -(10)
PART B: Intro to DESMOS.
1. Open up your Chrome account. 2. Go to the Web Store
3. Search DESMOS 4. Add the App 5. Open DESMOS.
6. Use the figure to complete the table. 7. Add the table to DESMOS.
8. Click on graph settings so that all the points can be seen. 9. Now try to add a line (equation f(x)) to the graph.
Figure # Blocks
1 2
3 5
Lesson 1.1: Measurement, Area and Perimeter of Rectangles
Learning Goal 1: I can solve problems involving area and perimeter of simple and composite figures
Area: ______________________________________________________
Perimeter: ___________________________________________________
Video: Create 3 math questions you would like to answer about this video.
What information would I want to know to solve it? What information do I know? (Including formulas)
Work:
Follow up Question: ____________________________________________________
Lesson 1.2: Pythagorean Theorem
Learning Goal #2: I can square and square root constants / variables and can apply both to simplify expressions and solve equations. Learning Goal #3: I can solve problems with Pythagorean Theorem
Right Triangle: ______________________________________________________
Hypotenuse: ___________________________________________________
In each of the right triangles, label the right angle and hypotenuse.
Video 2: State the algebraic formula for the Pythagorean Theorem. Pythagorean Theorem: ______________________________
Video 3: Solve for the missing side.
A) B)
Problem: What mathematical question, could I ask?
What information would I want to know to solve it? What information do I know? (Including formulas)
Solution:
Practice: Determine the lengths of the missing sides.
a) b) c)
Lesson 1.3: Pythagorean Theorem (Finding Legs) Learning Goal #3: I can solve problems with Pythagorean Theorem
Which is NOT a right triangle? Explain.
A) B)
Example 1: From the video, determine the value of x.
Remember: __________ to determine the Hypotenuse.
__________ to determine one of the Legs.
Ex 2: A hydro pole casts a shadow that is 10 m long. A technician measures the wire that runs from the top of the pole to the end of the shadow and finds it to be 26 m. How tall is the pole?
Lesson 1.3: Pythagorean Theorem (Finding Legs)
1.3: Practice
1. Calculate the length of the missing side in each triangle. (a)
(b)
(c)
2. A 5-m ladder is leaning against a house. Draw a diagram and add in any given measurements. The foot of the ladder is 3 m from the base of the wall.
How high up the wall does the ladder reach? 9 cm
b
15 cm
12 m
5 m
y
13 cm
c
Lesson 1.4: Composite Area
Learning Goal 1:I can solve problems involving area and perimeter of simple and composite figures
List the simple shapes found in each figure below.
a) b) c) see board
Ex 1: Determine the area and perimeter of each figure. What do you notice?
a) b)
Lesson 1.4: Composite Area
You will create a composite shape on the grid below. For Level 3; your shape must include:
• At least 3 shapes, including some fraction of a circle (full, half, etc…)
• Use a ruler for all straight lines and draw circular edges as nicely as possible.
• There must be at least one addition and at least one subtraction.
• Let each block represent 1 cm (or 1 m). Please specify.
• You must calculate each partial area with units. Show formulas and all work.
• Then combine (add/subtract) the areas to determine the totalarea. Remember units!
Level 4 performance will be above Level 3. (More than 3 shapes, colour, Pythagorean, etc…)
Lesson 1.5: Barbie Bungee Name: _______________
Do not worry about your problems with mathematics, I assure you mine are far greater. –Albert Einstein
Learning Goal 4: I can interpolate and extrapolate values in scatter plots with lines of best fit.(LR)
Pre-Activity
1. Given is a scatter plot showing the Annual Waste produced in various Oregon Cities according to their population.
a) Use a ruler to draw a line of best that shows the trend of the data.
b) According to your line of best fit, how much waste would be produced in Jackson, pop. (200 000)? c) This is called interpolation.
Why “inter”-polation?
2. Below is a scatter plot of the Heights of Buildings, compared to the Number of Stories.
a) Use a ruler to add a line of best fit that shows the relationship in the data.
b) Use the line of best fit to estimate the height of the One World Trade Center (104 stories). c) This is called extrapolation. Why “extra”
Lesson 1.5: Barbie Bungee Name: _______________
Do not worry about your problems with mathematics, I assure you mine are far greater. –Albert Einstein
Learning Goal 4: I can interpolate and extrapolate values in scatter plots with lines of best fit.(LR)
Interpolation: ___________________________________________________________ Extrapolation: ___________________________________________________________
Purpose
You are going to create a bungee line for Barbie that will give her the most thrilling, yet SAFE, fall from a height of 3 meters.
Procedures
1. Connect two rubber bands with a slipknot.
2. Then wrap one end repeatedly around Barbie's ankles. Be sure the rubber band is on tight enough not to fall off when she is being dropped.
3. Measure Barbie's height without rubber bands. Record this amount next to the zero rubber bands in the data chart on back side of this paper.
4. Next, drop her with one rubber band attached to her ankles. Hold the band tight at the top of the yardstick, and simply let Barbie drop from the head-down position. She won't swing; she will just lightly bounce.
5. Now it’s time to start adding more bands. Once again use a slipknot to connect a second band to the bungee line. (Remember the band wrapped around her ankles does not count in the length of the line.)
Lesson 1.5: Barbie Bungee Name: _______________
Do not worry about your problems with mathematics, I assure you mine are far greater. –Albert Einstein
7. Complete the data chart.
Number of
rubber bands head reaches (cm) Lowest point
0
(i.e. from ankles)
1 (i.e. original band)
2 (i.e. 1 more band)
3
4
5
8. On graph paper, graph the points from the data chart. Draw in the line of best fit. 9. Now consider the SAFETY issue vs. the THRILL issue:
If you put too many rubber bands on, her head will reach the floor, she will crack open her skull, and die. You will then be sued for negligence and will lose your business and owe her family millions of dollars that you don't have.
On the other hand, if you don’t put enough rubber bands, therefore you shorten the bungee line TOO MUCH, the ride may not be thrilling enough, and Barbie will pay her big bucks to your competitor. You will lose clients and your business will suffer.
10.So based on your line of best fit, your prediction for the number of rubber bands for the bungee line for Barbie jump from a height of 8.5 meters (850 cm) is ________________.
11. Now, you are ready to test out the jump using the number of rubber bands you wrote for #10. (You may not change this number once it’s written down or when you have seen other groups test their jumps!)
Lesson 1.5: Barbie Bungee Name: _______________
Do not worry about your problems with mathematics, I assure you mine are far greater. –Albert Einstein
Extra Practice (EQAO)
a) According to the model, what was the population in 2008?
b) According to the model, when was the population exactly 35 million?
Lesson 1.6: Pre-Assessment Activity Name: _______________
Do not worry about your problems with mathematics, I assure you mine are far greater. –Albert Einstein
1. a) Determine the shaded area
b) Determine the perimeter
2. Determine the value of x.
3. Adam has made a picture frame. Draw a diagram and add in any given measurements. The frame is 60 cm long and 25 cm wide.
To check that the frame has square corners, Adam measures the diagonal. How long should the diagonal be?
Lesson 1.7: Linear Programming Name: _______________
Learning Goal #5: I can determine values in a linear pattern/relation. Part A: Blocks in an “L” Shape.
a) Build the first 6 (#0 to #5) blocks in this set. b) Fill in the table. Draw the graph.
c) What is the “Start Amount”
of blocks? ______________
d) Create a formula for the Total (T) number of blocks in terms of the level (n).
T =
e) Check your formula on DESMOS
f) How many blocks would be at the 43rd level?
g) What level has 75 blocks?
“L” Shape
Level
# Blocks
0
1
1
2
5
Lesson 1.7: Linear Programming Name: _______________
Part B: Blocks in a Corner Shape.
a) Build the first 6 (#0 to 5) blocks in this set. b) Fill the table. Draw the graph.
c) What is the “Start Amount” of
blocks? ______________
d)Create a formula for the Total (T) number of blocks in terms of the level (n).
T =
e) Check your formula on DESMOS.
f) How many blocks would be at the 43rd level?
g) What level has 100 blocks?
Corner Shape
Level
# Blocks
0
1
1
2
7
Lesson 1.7: Linear Patterning Practice
Working with patterns. Working with patterns.
Step vs. Number of squares
1. Draw the next step:
2. Complete this table:
Step n # of _______________
1
2
3
4
5
10
27
100
3. Draw the graph
Step vs. Lego Pieces
1. Draw the next step:
2. Complete this table:
Step n # of _______________
1
2
3
4
5
10
27
100
Lesson 1.7: Linear Patterning Practice
Step vs. Number of squares
1. Draw the next step:
2. Complete this table:
Step n # of _______________
1
2
3
4
5
10
27
100
3. Draw the graph
Step vs. number of squares
1. Draw the next step:
2. Complete this table:
Step n # of _______________
1
2
3
4
5
10
27
100
Lesson 1.8 Starter
Learning Goal 5: I can determine values in a linear pattern/relation (LR)
Assessment Preview A: Which Tables represent linear relationships? Explain.
Level # Figures
0
2
1
9
2
16
3
23
10
72
Learning Goal 5: I can determine values in a linear pattern/relation (LR) Assessment Preview B: Complete each table in an appropriate manner.
Level # Figures
0
4
1
7
2
5
Linear
Level # Figures
0
20
1
12
2
8
3
6
4
5
Level # Figures
0
4
1
7
2
5
Lesson 1.8: Equivalent Ratios
Learning Goal 6: I can solve ratio problems using equivalent ratios or cross multiplication. (NA)
Ratio – _________________________________________________________________
Ratios can be written three different ways: 4 to 1, 4:1 and
1 4
.
Examples: 1. The ratio of boys to girls in this class is _______ or __________or __________
2. For every 1 bike there are 2 wheels and 4 reflectors. 1 to 2 to 4 or _______ or_______
3. Reduce 12:16 to lowest terms.
Simplify the Ratios:
12 : 14 = __________ 20 : 24 = _____________ 10 : 25 : 15 = _______________
48 : 18 = _________ 14 : 35 = ______________ 4 : 22 : 26 = ________________
8 : 56 = __________ 3 : 16 = _______________ 7 : 20 : 10 = ________________
Write each Ratio in three Forms, Then Reduce it To Lowest Terms
Statement of the Comparison a to b to c a:b(:c)
b
a Lowest
Terms The ratio of the number of windows to the number of
lights in the room.
The ratio of the number of students in the class to the number of available desks.
The ratio of the number of garbage containers to recycling bins in the room.
The ratio of the number of weekdays to the number of weekend days in a week.
The ratio of the number of Filing Cabinets in the classroom to total the # of drawers.
The ratio of the number of empty desks to occupied desks.
The ratio of the number of students wearing short sleeves to the # wearing long sleeves.
The ratio of the # of blackboards to the # of windows to # of cell phones in the room.
Lesson 1.8: Equivalent Ratios Simplifying ratios.
Simplify
1) 4 : 2
2) 6 : 3
3) 6 : 9
4) 7 : 14
5) 16 : 8
6) 10 : 8
7) 6 : 15
8) 12 : 2
9) 30 : 6
10) 35 : 21
11) 27 : 36
12) 14 : 35
13) 18 : 45
14) 30 : 35
15) 32 : 12
16) 10 : 60 : 30
17) 32 : 36 : 44
18) 32 : 56 : 16
19) 64 : 72 : 40
Lesson 1.9: Equivalent Ratios—The Mullet Ratio
Learning Goal 6: I can solve ratio problems using equivalent ratios or cross multiplication. (NA)
What is a mullet? (Opinion allowed!)– ________________________________ _____________________________________________________________
What is the Mullet Ratio?____________________________________________________
Example 1: Give the Mullet ratio for each. Include both party and business measurements. a) Lionel Richie, Sweater boy b) Class Photograph, Classy photographer c) Dad, Mom, Baby
Example 2: Use a ruler, the pictures, yourself and three friends to complete the table..
Andre Brian
Cross multiply and divide.
Solve the following using the cross multiply method.
a)
1216=
20𝑥b)
72𝑥=
1525c)
577=
135𝑥Name Party Business Mullet Ratio Andre
Brian
Lesson 1.9: Equivalent Ratios—The Mullet Ratio
2.
Tammy has a mullet ratio of 42:9. Her boyfriend, Timmy has exactly the same
Mullet Ratio. Timmy has a
business length
of 1.5 cm, what is his “Party Length”.
Lesson 1.10: Equivalent Ratios—Proportion Practice Learning Goal 6: I can solve ratio problems using equivalent ratios or cross multiplication. (NA)
1. Multiply between ratios to determine each value of n.
a) 2:5 = 8:n b) 2:n = 6:9 c) n:15 = 12:20 d) 8:n = 4:15
2.Multiply within the ratios to determine each value of z.
a) 4:8 = 3:z b) 5:z = 6:18 c) z:14 = 10:20 d) 3:21 = z:56
3. A portable music player with 4 GB of memory stores about 1000 songs. A music player with 60 GB of memory stores about 15000 songs. Is the number of songs proportional to the amount of memory? Explain your reasoning.
Lesson 1.10: Equivalent Ratios—Proportion Practice
5. Determine the value of each variable. Hint: Switch to Fraction Form.
a) 4:10 = 18:c b) 125:25 = n:6 c) 6:y = 9:12 d) 60:z:35 = 24:6:b
6. Ali earned $80 working 10 h. How long would it take him to earn $200? Explain how you found your answer.
7. A punch recipe requires 2 parts ginger ale, 1 part cranberry juice and 5 parts orange juice. How much of each should be used to make 32 liters of the punch? How much to make 28 liters?
8.A gear ratio is the ratio of the numbers of teeth in two connected gears. The gear ratio for two gears is 3:2.
a) The larger gear has 126 teeth. How many teeth does the smaller gear have?
Lesson 1.10B: Solving Proportional Problems Practice Examples
Part A: Solving Unknown Ratios. Solve for the unknown value.
a) 156 =8𝑥 b) 2112=35𝑥 c) 5672=126𝑥
Part B: Solving a problem involving proportions.
1. Emily knows that when she eats two apples she gains 1100kJ of energy. When she jogs she burns 2500 kJ of energy. How many apples would she need to eat to replenish her energy after the jog?
2. The ratio of boys to girls at a school dance is 3:7. If there are 220 people at the dance, how many of each are there?
3. The Ratio of distance a person should sit from a TV screen and the size of the screen is 5:3. a) How far away should a person sit from a TV that has a size of 42-inches?
Lesson 1.12: Interior Angles in Polygons
Learning Goal 7: I can determine and describe the properties and relationships of the interior angles of polygons. (MG)
PART A: Angle Review
An angle is the ________________________ of two rays with a common endpoint.
Label the following angle three ways. ____ ____ ____
How many degrees in a circle?_______________ How many degrees in a triangle? _____________
How many degrees are in each angle of an equilateral triangle?_________________ How many degrees are in a straight line? ________________
Sketch an example of each angle type.
Acute Right Obtuse Straight Reflex
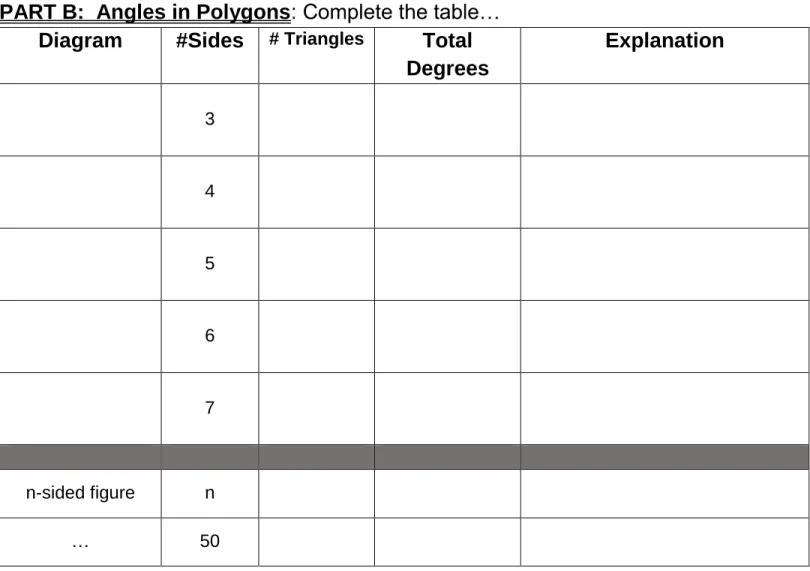
PART B: Angles in Polygons: Complete the table… Diagram #Sides # Triangles Total
Degrees
Explanation
3
4
5
6
7
n-sided figure n
Lesson 1.12: Interior Angles in Polygons
PART C: Practice.
1. Determine the total amount of degrees in a polygon with 15 sides.
2. Determine the value of x.
3. The sum of the interior angles in a polygon is 2520o. How many sides does it
have?
4. What is the measure of each angle in a regular dodecagon (12 sides)?
5. A Canadian “Loonie” is in the shape of an eleven sided polygon,
Lesson 1.13: Exterior Angles in Polygons
Learning Goal 8: I can determine and describe the properties and relationships of the exterior angles in polygons (MG)
Convex Polygon: _____________________________________________________
Concave Polygon: ____________________________________________________
RECALL: An ‘n’ sided polygon can form ________ triangles from
one vertex and the sum of the interior angles is ________________ degrees.
Example 1: Determine the angle measure in a regular heptagon.
The exterior angles of a polygon (any size) add to ____
6. Example 2: Determine the value of y.
Convex Regular
Convex Irregular
Lesson 1.13: Exterior Angles in Polygons
Verify the rule for interior angles of a polygon.
Draw _______ points in a cyclic manner. Use a ruler to draw a convex polygon.
What should the total number of degrees be (according to the formula)?
Measure all __________ interior angles.
Add up the results. How does the total compare?
Verify the rule for exterior angles of a polygon.
Use a ruler to extend each side of your polygon, (in the same direction).
The total number of degrees of the exterior angles is always 360.
Measure all __________ exterior angles.
Lesson 1.14: The Filing Cabinet
Learning Goal 1: I can solve problems involving area and perimeter of simple and composite figures (MG)
List some questions that the video might suggest.
What information would you require?
Estimate the dimensions of the file cabinet from the video. Replace your estimates with the actual dimensions.
Question:_______________________________________________ Work: Complete work with a partner on the back.
Follow Up Questions:
1. How long would it take to cover if it took 40 seconds for every 5 stickies?
2. If the HEIGHT of the cabinet was doubled, how many post-its would be needed?
Lesson 1.15; How much will it cost to paint the hall floor?
Learning Goal 1: I can solve problems involving area and perimeter of simple and composite figures (MG)
Warm Up: Determine the area and perimeter of the shaded region. Area =
Perimeter =
Problem 1
As part of your community service hours, you have agreed to help the war veterans revitalize their Legion Hall. The first job will be to trim around the perimeter of the ceiling. The diagram of the hall is below. The crown moulding trim they have chosen costs $6.50/m.
a) Determine the perimeter of the ceiling. b) How much would the trim cost?
c) In Ontario we also pay 13% HST. How much is that? d) What is the total cost?
Crown Moulding $6.50/m
12 cm
21 cm 12 cm
12 cm
10 m 12 m
16 m
Lesson 1.15; How much will it cost to paint the hall floor?
Problem 2:
The veterans would also like their floor painted. Because of the high volume of people, it will require two coats of paint. One gallon of paint covers 40 m2. You will need to use
the internet to determine the price for a gallon of floor paint. Make sure the website is local. Include the address. Remember to include the 13% HST tax.
How much (total) will it cost to buy the paint?
10 m 12 m
16 m
Lesson 1.15; How much will it cost to paint the hall floor?
Composite Area Practice
1.
Lesson 1.15; How much will it cost to paint the hall floor?
3.
Lesson 1.16; Pre-Assessment Practice
Learning Goal 1: I can solve problems involving area and perimeter of simple and composite figures (MG)
Learning Goal 3: I can solve problems with Pythagorean Theorem (MG) Determine the area and perimeter of the figure on the right.
Area = ___________m 2 Perimeter = _____________ m
Learning Goal 2: I can square and square root constants/variables and can use them to simplify expressions & solve equations (NA)
What value of x will make the following equation true?
√16 + 𝑥
2
= 13
Learning Goal 4: I can interpolate and extrapolate values in scatter plots with lines of best fit. (LR) The scatter plot shows the Price of Diamonds plotted according to their Size (in carats).
a) Does this relationship appear to be linear or non-linear? Explain.
b) Draw a line of best fit. (Regardless of your answer to a))
c) What is the likely price of a 2.25 carat diamond?
d) Is this an interpolation or extrapolation? Explain.
35 cm
35 cm
47 cm
x cm 10 cm
Lesson 1.16; Pre-Assessment Practice
Learning Goal 5: I can determine values in a linear pattern/relation (LR)
a) Examine the pattern. Draw the next figure and complete the clear rows of the table. Figure # # of Squares
In the middle row
Total # of Squares
in the Figure
1 1 1
2 3
3 13
4 25
5
43
100
d) Use the formula (and patterning) to fill in the two shaded rows of the table.
Learning Goal 6: I can solve ratio problems using equivalent ratios or cross multiplication. (NA) Wal-mart sells a case of 24 cans of Diet Coke for $6.88. Giant Tiger sells a 18 pack of Diet Coke for $5.49. Which is the best buy?
Learning Goal 7: I can determine and describe the properties and relationships of the interior angles of polygons. (MG)
Learning Goal 8: I can determine and describe the properties and relationships of the exterior angles in polygons (MG) Determine the value of the missing values.
a) b) c)
b) Which column represents linear growth? Explain.
c) Give a formula for the linear column in the table.
75o
xo
Lesson 1.17; What is Your Rate?
Learning Goal 9: I can solve proportional problems by finding unit rates. (NA)
What value is better?
Now try this. (Recall 1 kg = 1000 g)
Example 1. Circle the better value based on the unit prices. Show both unit rates.
a) $25.00 for concert tickets for 2 people or $36.00 for tickets for 3 people.
b) $4.25 for 4 L of milk or $2.55 for 2 L of milk.
c) 35 g of mixed nuts for $0.99 or 50 g of mixed nuts for $1.49.
Lesson 1.17; What is Your Rate?
What’s your Rate? Try any 5 of the following. Or ALL if you have time.
1.How many texts can you send per minute?
Time: 3 minutes # texts:___________ Rate:____________
2.How many baskets can you make per minute?
Time: 30 s (0.5 min) #baskets: _________ Rate:____________
3.What is your heart rate?
Time: 15 secs (0.25min) # beats: ___________ Rate:____________
4.What is your alphabet reciting rate?
Time: 2 min # complete alphabets ________ Rate: ____________
5. How many Jumping jacks can you do?
Time: 45 s (0.75 min) #full jumping jacks________ Rate: ____________
6. How many times can you hit “=” on a calculator?
Enter +1 on a calc., then on GO, hit “=” until STOP
Time: 12 s (0.2 min) Total on screen ____________ Rate: ___________
7. What is your stair climbing rate?
Time: 40 s, (0.667min) Total stairs__________ Rate: __________
Example 2. Find the unit rate for each situation. Remember units. [10]
a) driving 180 km in 3 hours ________________ b) 54 hot dogs for 18 people ________________ c) 160 words typed in 4 minutes ________________ d) $27.40 for 4 hours of work ________________ e) $12.66 for 8 packages of juice boxes ________________ f) $284 for a 4 day car rental ________________ g) 560 heartbeats in 6.5 minutes ________________ h) jogging 3.5 km in 30 minutes ________________ i) a convenience store has 15 customers in 20 minutes ________________
Lesson 1.18: Is Lego Gender Biased?
Part A: Learning Goal #9 I can solve proportional problems by finding unit rates.
List 3 or 4 factors that would determine the price of a Lego kit.
Should gender be one of the factors? Predict which costs more?
STAR WARS SAME DISNEY
Procedure: 1. Use the slides to complete the first 6 rows of each table.
2. Then visit the “LegoShop” website, and select 3 other kits, from each line of kits and add them to each table.
Does there appear to be a gender bias in their pricing? Explain.
How much should the Lego Disney “Disney Castle” cost? Justify.
How much should the Lego StarWars “Millennium Falcon” cost? Justify.
Pieces Cost Cost/Piece
Set
Average cost/piece: ________
Pieces Cost Cost/Piece
Set
Lesson 1.18: Is Lego Gender Biased?
Part B: Learning Goal 11: I can conduct experiments to establish relationships and test hypotheses. (LR)
a) Predict the trend in the relationships between The Number of Pieces and the Price:
(positive/negative, strong/weak, Linear/nonlinear)
b) Predict how the two scatter plots will compare. (STARWARS to DISNEY,…higher/lower, steeper/less steep, stronger, weaker,…)
Analysis: Graph the data below. Use • for the Star Wars points, use X for the Disney
1.Comment
on your first
prediction.
2.Comment
on your second Prediction.
Part C: Recreate this scatter plot in Google Sheets if time permits.
(Sketch a possible scatter plot below)
Use • for the Star Wars points, use X for the Disney
# Pieces Cost
Lesson 1.19: First Differences, Determining Linear vs. Non-Linear?
Learning Goal 10: I can determine a relationship as linear (direct or partial), or non linear. (LR)
Example 1: Blocks in a “+” Shape.
a)Build the first 6 figures in this set. b)Fill the table. Draw the graph.
c) Subtract each value from, the term below. These are called the first differences.
d)Describe the graph (Linear or Non-Linear). _____________________
e)Describe the first differences.
Example 2: Perimeter of Growing Squares a) Build the first 6 figures in this set.
b) Fill the table. Draw the graph.
c) Subtract each value from, the term below.
d) Describe the graph Linear or Non-Linear. _______ e) Describe the first differences.
“+”
Shape
Level # Blocks First Differences 1 2 3 4 5 6
Growing Squares
Level Perimeter
FirstLesson 1.19: First Differences, Determining Linear vs. Non-Linear?
Example 3: Area of Growing Squares a) Use the squares from Ex 2. b) Fill the table. Draw the graph. c) Calculate the first differences.
d) Describe the graph Linear or Non-Linear. _______ c) Describe the first differences.
Example 4: Complete each table and determine if the relationship is linear or non-linear.
a) b) c)
Example 5: Which pattern is linear, Example 6: Make the relationship…
# of shaded squares or # of blank squares? a) Linear b) Non-linear
Growing Squares
Level
Area
First Differences 1 2 3 4 5 6 Level Number Total AreaShape # of Line Segments 1
2
3 16
4 5 6
Shape # of Line Segments 1
2
3 18
4 5 6
Shape # of Cylinders
1 5
2 3 4 5 6
x y
1 11 2 17 3 5
x y
Lesson 1.20: Review for BLOCK 1
LG 9: I can solve proportional problems by finding unit rates. (NA)
LG 2: I can square and square root numbers/variables and can use them to simplify expressions & solve equations (NA)
Lesson 1.20: Review for BLOCK 1
Lesson 1.20: Review for BLOCK 1
LG 0: I can simplify numerical expressions. (NA)
LG 8:I can determine and describe the properties and relationships of the exterior angles in polygons (MG)
LG5: I can determine values in a linear pattern/relation (LR)
Lesson 1.20: Review for BLOCK 1
LG 7:I can determine and describe the properties and relationships of the interior angles of polygons. (MG)
LG 3:I can solve problems with Pythagorean Theorem (MG)
Lesson 2.1: Creating and Describing Scatter Plots
Learning Goal 16: I can create and interpret scatter plots by hand and using technology (LR)
Scatter Plot: How are
a Person’s Height
and Their Jumping Ability Related?
(Hand)1. Collect the data. Measure your height and vertical jump. Complete the table with 9 other classmates
2. Add a scaleto each axis. Start by “breaking the axis”. Then count constantly using an
easy scale. Money values are good choices 1, 2, 5, 10, 20… 3. Plot each point on the axes. Is there a pattern or trend?
Height (cm)
Jump Height
(cm)
V
er
ti
cal
J
u
mp Di
st
an
ce
(
cm
)
Lesson 2.1: Creating and Describing Scatter Plots
Scatter Plots - Types of Correlation
Correlation helps to describe the relationship between 2 quantities in a graph. Positive or Negative Correlation
A scatter plot shows a ______________ correlation when the pattern rises up to the right.
This means that the two quantities increase together.
A scatter plot shows a ______________ correlation when the pattern falls down to the right.
This means that as one quantity increases the other decreases.
Strong or Weak Correlation
If the points nearly form a line, then the correlation is ___________.
To visualize this, enclose the plotted points in an oval. If the oval is narrow, then the correlation is ____________________.
If the points are dispersed more widely, but still form a rough line, then the correlation is _____________________.
If the points are dispersed even more widely, but still form a rough pattern of a line, then the correlation is ___________________.
If the oval is wide, then the correlation is ____________________..
No Correlation
A scatter plot shows ________ correlation when no pattern appears.
If the points are roughly enclosed by a circle, then there is _______ correlation.
Drawing a line of best fit:
1. The line must follow the ______________.
2. The line should ________ through as many points as possible.
Lesson 2.1: Creating and Describing Scatter Plots
Lesson 2.1: Creating and Describing Scatter Plots
Practice
For each of the graphs below:
1) Draw a line of best fit if appropriate.
2) Label each graph as showing a relationship or no relationship.
3) When you indicate there is a relationship, fully describe the correlation in each scatter plot.
Direction (positive/ negative), Strength (strong/weak), Shape (linear/non-linear).
Example 2: Fully describe the
relationship between a golfer putting distance and success probability.
Example 3: Sketch a scatter plot that shows…
Lesson 2.2: Conducting Experiments to Test Hypotheses
Learning Goal 11: I can conduct experiments to establish relationships and test hypotheses. (LR)
Scatter Plot: a graph of paired data in which _____________________________
___________________________________________________________________.
Dependent Variable: _________ Independent Variable: ____________
Correlation: the degree to which two variables ________________________
Technology can calculate the _______________________. This is a measure of the _________________ of the relationship. We can think of it as a ______________ fit.
Describe each scatter plot and assign each on an appropriate r-value from the list.
r = -1, r = -0.8, r = -0.5, r = 0, r = +0.5, r = +0.8, r = +1
A line of best fit is a straight line drawn through _____________________________ with approximately the ___________________________________above the line as there are below the line. Do NOT ______________________ the first and last point.
Sketch a possible scatter plot for the relationship between Weight and Height of a grade nine student.
Lesson 2.2: Conducting Experiments to Test Hypotheses
How are
a Person’s Height
and Their Jumping Ability Related?
(Google Sheets)Purpose: To determine if there is a relationship between a person’s Height (cm) and how High they can Jump.
Prediction: Taller people will have ________________ (Use greater/lower to predict direction.) jump heights.
This will show a _________________ (strength) ________________ (shape) relationship.
Procedure:
• Using the class data collected, enter the data into Google Sheets. Create a
scatter plot. Add a line of best fit. How does it compare to the graph by hand?
• Click on the graph and select “Advanced Edit”, “Customization” add a
“Trendline”, “Linear” and select show R2. R2 = _________, so r = _________
Conclusion: Describe the relationship, use the appropriate language.
Extensions: Here is a sample sketch of a data set for some class. Let’s make some
predictions.
a) This data set was collected from a grade nine math class. Add to the graph, using ‘x’s the data that might be collected for the members of an Olympic volleyball team?
b) Now imagine the data was collected from a grade 3 class instead of a grade nine class?
Lesson 2.3: Determining the Volume of Prisms and Cylinders
Learning Goal 12: I can solve problems involving the volume of prisms and cylinders. (MG) Who Gets More
Questions you would like to answer?
•
•
•
Information you would need.
•
1. 2.
Ex 1: Determine the volume of the cylinder from the set.
Ex 2: For each of the 3D figures, calculate Volume. Use the two step method. a) ABase = __________ b)
ABase = __________
Volume = ______________ Volume = _______________
Examples: Determine the volume.
a) b) c)
b) ABase = __________
b) ABase = __________
Volume = ______________ Volume = _______________
16 cm
25 cm 2 cm
6 cm
Lesson 2.4: Volume of Pyramids and Cones
Learning Goal 13: I can solve problems involving the volumes of pyramids and cones. (MG)
Questions you could ask?
What seems to be the relationship?
Example 1: What is the volume of the cone from the kit?
Example 2: Determine the volume of each figure if both bases have an area of 30 cm2 and both have heights of 12 cm.
Example 3: Determine the Volume.
a) b) square base c)
Lesson 2.4: Volume of Pyramids and Cones
Lesson 2.6: Introduction to Algebra, Like Terms and Alge-Tiles
Learning Goal 14: I can simplify algebraic expressions by collecting like terms. (NA)
Dora To the Rescue!
1. How can we find the dimensions of the counter top?
2. What is some information you need?
3. Determine the perimeter of the counter top. (Givd your answer in terms of Dora!)
a) How many Doras for the length? Estimate______ Actual_____
b) How many Doras for the width? Estimate ______ Actual _____
4. How tall do you think Dora is? ___________ How tall is she actually? __________
5. Calculate the perimeter of the countertop in centimeters.
Algebra: Math, where ________________________are used to represent values. An Algebraic Term: A single expression involving a ________________________ and a _________ _______________.
Numerical Coefficient: Any ___________in front of a variable in a term. (It`s _____ otherwise Ex: State each coefficient. 4a, 10xy, b, -6x3
Like Terms: Terms with the ____________________ or variables raised to the same power. Ex:
Label as LIKE or UNLIKE
Lesson 2.6: Introduction to Algebra, Like Terms and Alge-Tiles
Lesson 2.6: Introduction to Algebra, Like Terms and Alge-Tiles
Lesson 2.7: Using Alge-Tiles to Add and Subtract Like Terms
Learning Goal 14: I can simplify algebraic expressions by collecting like terms. (NA)
Alge-Tiles
Classify each. Example 1: Give the expression
Example 2: Combine groups A and B into one group.
Zero Principle: _________________________________________________________________
Ex: a) -2x2 + 2x2 = _______ b) 5y + (-5y) = _____
Exercise: Represent 4x, in the simplest way, then in one other way.
PART C: Simplifying (Illustrate with Alge-tiles)
Example 1: 3x + 1 – 2x – 3 Example 2: -x – 1 – 2x + 3
Simplify:
a) 4x – 1 + 3x + 2 b) 3x – 3 + 2x – 1
c) 2x2 + 1 + 2x – x2 – x d) 2x2 – x – 2 + 3x – 2x
THINKING: Create the polynomial 2x – 1 using two different representations.
+1
Collecting Like Terms
1. identify _______________
2. ____________ them together
3. _________________ the numerical co-efficient
Lesson 2.7: Using Alge-Tiles to Add and Subtract Like Terms
Lesson 2.7: Using Alge-Tiles to Add and Subtract Like Terms
Lesson 2.7B: Using Alge-Tiles to Add and Subtract Like Terms
Learning Goal 14: I can simplify algebraic expressions by collecting like terms. (NA)
Ex 1: Alge-Tiles: Give a simplified algebraic expression for each group of Alge-Tiles.
Subtraction
: Subtracting polynomials means to add the
____________________________.Example 2: Draw the opposite of each polynomial below.
a) 4x b) 3x2 – 2 c) 3x2 – 5x + 2
Example 3: Subtract the polynomials by drawing the opposite (of the 2nd), then cancelling and
collecting similar to addition. Remember to write your final answer. a) (5x + 3) – (4x + 2) b) (3x – 2) – (4x – 3)
Lesson 2.7B: Using Alge-Tiles to Add and Subtract Like Terms
Learning Goal 14: I can simplify algebraic expressions by collecting like terms. (NA)
Homework: Use alge-tile drawings to simplify the following. Add new shapes for like terms that do not have existing shapes. (ex: use a circle for the x3 terms, a triangle for x4)
Lesson 2.8: Using Alge-Tiles to Add and Subtract Like Terms
Learning Goal 14: I can simplify algebraic expressions by collecting like terms. (NA)
Learning Goal 15: I can multiply a polynomial by a monomial. (NA)
Recall: Dimensions of the Counter. Length______ Width______
Calculate the area of the counter top. Answer in terms of Doras.
If each Dora is 9.5 cm, what is the area in cm2?
The Distributive Law:
When you have a term outside the bracket,
________________ this term by every term inside the bracket.
Sample Problems: Expand
1. 2(x – 5) 2. 5(x + 1)
3. 4(3x – 1) 4. -3(2x + 4)
Use it to __________ one __________ by more than one _____________.
The original question will have _____________.
The simplified expression will not have ________.
You must remember the ____________ rules to multiply the ___________.
Ex 1: Use alge-tiles to represent 3 sets of 2x – 1.This simplifies to _________________
Ex 2: Use alge-tiles to represent 2 sets of x2 – 2x + 3.
Lesson 2.8: Using Alge-Tiles to Add and Subtract Like Terms
Lesson 2.8: Using Alge-Tiles to Add and Subtract Like Terms
Lesson 2.9 Algebra Review Name:__________ Learning Goal 14: I can simplify algebraic expressions by collecting like terms. (NA)
Learning Goal 15: I can multiply a polynomial by a monomial. (NA)
1. Give a term that is “Like” 4x2y ___________
2. Give an example of a binomial with one variable and no like terms ___________ 3. How many terms does a monomial have? ___________ 4. Match the terms. Place the letter on the appropriate line (one is left out).
_______ 4x ________-3x2 _______5x2y _______8xy2
a) -3xyx b) 5xy c) 8x d) -3y2x e) 4x2
5. Represent 4x2– 6x + 3 by sketching Alge-tiles.
6. Translate the following expression in simplified form: _______________
7. Simplify.
a) 4a – 5b + 6a – 3b [2] b) 2x2– 4x + 5 – 3x2 + x – 7 [2]
c) (2x2– 4x + 3) + (-3x2– 2x – 5) [2] d) (3x2– 5x + 4) – (-x2– 5x + 1) [2]
e) 4(3x – 4) [1] f) -4x2(5x – 4y + 2) [2]
8. Determine the missing side length and perimeter. 9. Determine the area.
[4]
3a + 4
6 2a 5 ? 1 5x
Lesson 2.10: Supplemental
Learning Goal 4: I can interpolate and extrapolate values in scatter plots with lines of best fit. (LR) Learning Goal 11: I can conduct experiments to establish relationships and test hypotheses. (LR)
Purpose: To examine the relationship between the Number of Strips of spaghetti and the number of pennies that can be supported.
Materials: Dry spaghetti, plastic cup, 1 paper clip, pennies
Prediction: The variables (# Spaghetti strands & # pennies) will show
correlation.
Method:
1. Span the appropriate number of strands between two desks (12 cm).
2. Suspend the cup from the spaghetti.
3. Slowly add pennies until the spaghetti snaps.
4. Record the data. Create a scatter plot. (Add an appropriate vertical scale.)
Analysis:
1. Describe the trend shown by the data. Add a line/curve of best fit if appropriate.
2. How many pennies can be suspended by 4 strands of spaghetti? This is ________.
3. How many pennies can be suspended by 10 strands of spaghetti? This is ________.
4. How many pennies could an entire package (500 strands) of spaghetti hold?
5. How would the results be different if twoonies were used? Explain.
6. How would the results be different if strips of paper were used? Explain.
#Strands #Pennies 1
2
3
5
Lesson 2.10: Supplemental
Lesson 2.11: Using Rates to Solve Ratio Problems
Learning Goal 6: I can solve ratio problems using equivalent ratios or cross multiplication. Balloon Explosion:
1. List a few questions you would like to answer…
2. What information do we need? There is a lot…
3. a) What is the maximum diameter of the balloon? Estimate____ Actual____ b) Convert that measure to centimeters. ___________
c) What is the maximum volume of the balloon? Show work.
4. What is the rate of water flow?
5. Use equivalent ratios to determine how long it will take for the balloon to burst.
Fast Clapper:
1. List one question you would like to answer. It should be obvious!
2. What information are we going to need?
Lesson 2.12: Rule of 4
Learning Goal 17: I can represent a linear relation in various (4) ways. (NA) Crazy Taxi:
1. List a few questions you would like to answer…
2. What information do we need?
How much will it cost for a 30 km cab ride?
Too High _________ Too Low _________ Best Guess: ________
Use the information from the second video to fill in the table.
Is the relationship linear? Explain.
What is the Rate of Change?
Determine an equation to relate the Cost to the Distance.
C = ________________
Distance Price ($)
0 km
1 km
2 km
3 km
4 km
5 km
10 km
15 km
20 km
What do you think the trend will look like? (rising/falling to the right, positive/negative, strong/moderate/weak, linear/non-linear)
Lesson 2.12: Rule of 4
Graph the Relationship.
Use your graph to predict the cost for a 30 km cab ride.
Is this prediction Interpolation or extrapolation?
Verify your answer with your equation.
Lesson 2.13: Rates of Change.
Learning Goal 18: I can determine the rate of change of relationships. (LR) Phone Charge:
What question do you think you could answer from the following two pictures?
What information do we need?
How long will it take to charge a phone to 90%?
Too High _________ Too Low _________ Best Guess: ________
Use the information from the photos to fill in the table.
Is the relationship linear? Explain.
What is the Rate of Change?
Determine an equation to relate the Charge to the Time.
Charge = ________________
Time Time Elapsed
(min)
Charge
(%)
7:50 am 0 5 8:00 am
8:10 am 8:20 am 8:40 am
What do you think the trend will look like? (rising/falling to the right, positive/negative, strong/moderate/weak, linear/non-linear)
negative,
Lesson 2.13: Rates of Change.
Graph the Relationship.
Use your graph to predict the time to charge to 90%.
Is this prediction Interpolation or extrapolation? Explain.
Verify your answer with your equation.
Why did we predict to 90%, not 100%. What happens to the relationships after 90%?
Lesson 2.13: Rates of Change.
Definitions:
A linear relationship that has no fixed cost (output starts at 0) is called __________________ A linear relationship that has a start amount (not zero) is called ________________________ 1. Description. A t-shirt company charges $50 to set up a new logo and then prints the logo
on sweatshirts for $30 each.
a) Give the Equation for this situation C = ___________________
b) Is this an example of Direct or Partial Variation?
c) Complete the table. d) Complete the Graph.
e) What is the rate of change?
Lesson 2.13: Rates of Change.
2. Graph.
a)Complete the table from the graph.
b) Why might a banquet cost $150 for zero people?
c) Determine the cost per
person. (This is the rate of change)
d)Fill in the blanks below to provide a description for this situation.
“The banquet costs _____ per person plus _____ to rent the hall.”
e)Give an equation for this situation graph. Cost = ____________________
3. Table.
a) Use the table to create the graph.
b) What is the rate of change for this relationship?
c) Give a description of the price of a pizza.
d) Give an equation for the price. Price = ___________________
People Banquet Cost($) 0 10 20 30 40 50 # People Total Cost ($)
Extra Practice:
# Toppings Price
0 $12
1 $13.50
2 $15
3 $16.50
4 $18
5 $19.50
Lesson 2.15: Cup Stacking
Learning Goal 17: I can represent a linear relation in various (4) ways. (LR) Learning Goal 18: I can determine the rate of change of linear relationships. (LR)
Learning Goal 10: I can classify relations as linear (direct or partial) or non-linear (LR)
Direct Variation: A linear relationship that is
Proportional.
There is _______ fixed value. These graphs start at __________. Ex: Mary is paid $12/ hour. P = ________
Partial Variation: A linear relation that is not
Proportional.
There IS a ___________These graphs DO NOT start at ____________ Ex: Taxi Fare $5 + $0.50 per km. C = _________
How tall is Mr Pignat in cups? Guess: ______ Actual: _______
Data: Stacking Technique: End to End. Direct Variation
What is the rate of change from your table?
Use the pattern to fill in the expected height of 0 cups.
Give an equation for the height of the cups. H = _________________
Best Estimate. Mr. Pignat is _______________ cups tall
# Cups Height (cm)
Lesson 2.15: Cup Stacking
Data: Stacking Technique One inside the next. Partial Variation
What is the rate of change from your table?
Use the pattern to fill in the height of the ZERO cup.
What does the height of the ZERO cup represent?
Give an equation for the height of the cups. H = ________________________
Best Estimate. Mr. Pignat is _______________ cups tall # Cups Height (cm)
Lesson 2.15: Cup Stacking
Data: Stacking Technique: Foam Cups (Partial).
What is the rate of change from your table?
Use the pattern to fill in the height of the ZERO cup.
Give an equation for the height of the cups.
H = ________________________
Best Estimate. Mr. Pignat is _______________ cups tall # Cups Height (cm)
Lesson 2.16: Connecting Descriptions, Tables, Graphs and Equations
Learning Goal 17: I can represent a linear relation in various (4) ways. (LR)
Learning Goal 18: I can determine the rate of change of linear relationships. (LR)
Learning Goal 19: I can determine equations from graphs, tables or descriptions. (LR)
Linear Equations have the form: Dependent = Initial Value + Rate х (Independent Variable)
Dependent: ______________________ Independent: _____________________________ Initial Value: ______________________ Rate: ____________________________________ Direct Variation:___________________ Partial Variation: ___________________________
Examples: Complete each chart and determine an equation for the relationship.
Practice A: For each CONTEXT, complete the chart and determine the equation. Chicken Deluxe
Deluxe costs $26, plus $1.50 for every extra piece of chicken added
to the bucket.
Dependent Price Initial Value
Rate $1.50/piece Independent # extra pieces Equation
Direct/Partial Partial
Banquet Hall
The country club charges a $270 for their facilities plus $29 per
guest.
Dependent
Initial Value $270 Rate
Independent # people Equation
Direct/Partial
Race Car
A race car travels from the Start Line at a constant speed of 220km/h. The relationship is the total distance travelled over time.
Dependent Initial Value Rate Independent Equation Direct/Partial Chinese Restaurant
A Chinese food restaurant has a special price for groups. The meal costs $11 for each person, plus $10
for delivery. Dependent Price Initial Value
Rate $11/person Independent # people eating Equation
Direct/Partial Partial
Ice Cream Pricing
Number of Scoops
Cost of Ice Cream with Sugar Cone ($)
0 1.25
1 2.00
2 2.75
3 3.50
4 4.25
Dependent Price Initial Value
Lesson 2.16: Connecting Descriptions, Tables, Graphs and Equations
Practice B: For each TABLE, complete the chart and determine the equation.
Practice C: For each GRAPH, complete the chart and determine the equation. Large Pizza
Number of Toppings
Cost of a Large Pizza ($)
0 9.40
1 11.50
2 13.60
3 15.70
4 17.80
Dependent Cost Initial Value $9.40
Rate $2.10/topping Independent # toppings Equation
Direct/Partial
Athletic Banquet
Number of People
Cost of Holding an Athletic
Banquet
0 75
20 275
40 475
60 675
80 875
Dependent Cost Initial Value
Rate $10/person Independent Equation Direct/Partial Charter Bus Distance (km)
Cost of Bus Charter ($)
0 170
100 210
200 250
300 290
400 330
Dependent Initial Value Rate Independent Equation Direct/Partial Heating Costs Dependent
Initial Value $1000 Rate $250/room Independent # Bedrooms Equation
Direct/Partial
Insects Appeared
Dependent Initial Value
Rate 10 insects/h Independent Time
Equation Direct/Partial
Balloon Floating Down
Lesson 2.17: Interpreting the Intersection of Two Linear Relations
Learning Goal 10: I can classify a relationship as linear (direct or partial), or non linear. (LR)
Learning Goal 17: I can represent a linear relation in various ways. (LR)
Learning Goal 21: I can interpret the intersection point of two linear relationships (LR)
Example 1: Faster-Fitness Gym has three payment options available. The “Full” membership costs $350, but each visit is free. The “Half” membership costs $100 but each visit costs $10. The “Pay-as-you Go” membership is free but each visit costs $20.
a) Complete each table.
a) Give the start amount for each case. (Initial Value, Fixed cost)
Start Amount: ________ Start Amount: ________ Start Amount: __________
b) Give the rate of change for each case.
ROC __________ ROC ___________ ROC _____________
c) Give an equation for each case. Remember to include the left side (TC = )
_______________ _________________ _________________
d) Add each data set to the graph. Use different symbols (, •, ) or different colours for each data set. Pencil crayons are available at the front of the room. Label each line.
Full Membership # Visits Total Cost
0 $350 1
2 3 4 5
10 $350 20
Half Membership # Visits Total Cost
0 1 2 3 4 5
10 $200 20
Pay-As-You-Go # Visits Total Cost
0 1 2 3 4
5 $100
Lesson 2.17: Interpreting the Intersection of Two Linear Relations
e) Which membership is an example of Direct Variation? Explain.
f) Which membership choices are examples of Partial Variation? Explain.
g) What is the significance of the point (10 visits, $200)? Explain.
h) Which option should I use if I plan to visit the gym 15 times?
i) Who should by the Full Membership? Use a number in your answer.
Block 2, Lesson 18: Review (Learning Goals#11-20) Name:_________
a) Use 1st differences to determine which A) or B) relation is linear. b) State the Rate of Change for the linear relationship. *Be careful. c) Complete table c) to make it a linear relation. *Be careful.
A) B) C)
x y 0 -7 2 -1 4 5 6 11 8 17
x y 0 -3 2 3 4 7 6 9 8 10
x y 0 3 1 8 2 13 3
7
Learning Goal 10: I can determine a relationship as linear or non-linear by
finding the first differences. (LR) Learning Goal 19: I can determine an Equation from various representations of linear relationships.. (LR)
Block 2, Lesson 18: Review (Learning Goals#11-20) Name:_________
Block 2, Lesson 18: Review (Learning Goals#11-20) Name:_________ Learning Goal 21: Ican interpret the intersection of
two linear relations graphically. (LR)
Learning Goal 13: Ican solve problems involving
the volumes of pyramids and cones. (MG) Learning Goal 20: Ican solve problems involving linear relationships. (LR)