L.J. Bijeman S1376926
Leiden University – Faculty of Social and Behavioral Science Master Thesis Health Psychology
Supervisors: Jelle van Leusden, MSc Prof. Dr. A. Evers Dr. H. Van Middendorp 13 juli 2016
Abstract
This study is part of a larger study of Leiden University. The current study investigated the effect of long-term fatigue (LTF) on the relationship between sleep quality (SQ) and cortisol reactivity (CR). Literature shows that SQ, CR and fatigue are associated with each other and influence health. It is important to know how these relations work so it can be used to develop more efficient intervention and prevention programs that can target both direct and indirect stress levels and SQ to prevent adverse health consequences. The study consist of two parts, the first part is made up of an online test battery of questionnaires and the second part consist of two stress tests. Psychological stress task TSST and a physical stress task CPT are conducted one week apart. A total of 48 participants completed the study. The results of the questionnaires PSQI and CIS8R out of the online test battery and the cortisol measurements of the stress test were used in a mediation analysis. The analysis
showed no relationship of SQ on CR and LTF on CR. A significant relation between poor SQ and LTF was found. In contradiction of expectations, no relationship was found of SQ and LTF on CR.
1. Introduction
The quality of sleep plays an important role in the health of humans (Akerstedt et al., 2002; Sapolsky, 1994). Sleep quality (SQ) is a broad term that can be defined more specifically as consisting of subjective and quantitative aspects. The subjective aspect is reflected by the depth and restfulness of sleep, while the quantitative aspect is reflected by sleep latency, number of arousals and sleep duration (Buysse, Reynolds, Monk, Berman, & Kupfer, 1989). Complications in the subjective and quantitative aspects could lead to different kinds of problems. For example, shorter sleep duration, also known as sleep deprivation, has a significant effect on human functioning and emotional affect (Pilcher & Huffcutt, 1996). This is troubling since the number of people that experience regular sleep loss, due to a modern lifestyle and psychosocial stress, is increasing (Meerlo, Sgoifo, & Suchecki, 2008). Moreover, health problems could arise indirectly. For example, complications in sleep duration are related to low social support on work, which in turn is related to cardiovascular disease or muscle pain (Akerstedt et al., 2002). In sum, SQ consists of different aspects and they are associated to health problems in different ways. Moreover, other factors such as stress can influence the health of a person as well (Sapolsky, 1994).
Stress can be experienced in different ways. It can be defined as physical or mental tension caused by physically, mentally or emotionally stressful situations. These are called stressors. Facing a stressor, for example work pressure, the body reacts by releasing hormones, such as cortisol (Sapolsky, 1994). Cortisol is regarded as one of the main stress hormones, which increases in case of stressful events (Schmidt et al., 2016). The increase of cortisol levels over time in response to a stressor is called cortisol reactivity (CR) (Adam, Hawkley, Kudielka, & Cacioppo, 2006). The system that regulates these stress responses as well as adaptation to the environmental challenges is called the Hypothalamus-Pituitary-Adrenal (HPA) axis (Hartwig, Aust, & Heuser, 2013). Whereas the stress response has a widespread effect, its effect differs on the basis of duration. Short-term duration of stress is called acute stress and affects the body, thoughts, feelings and behaviour of people. Long-term duration of stress is called chronic stress, which can cause and intensify a range of physical and mental affiliations. Chronic stress can also contribute to health problems, such as diabetes, high blood pressure and heart disease (Sapolsky, 1994). In sum, in stressful situations a person releases cortisol as a part of the stress response, which has widespread effects on a person’s health (Sapolsky, 1994). However, stress and SQ do not only influence a person’s health, but are also closely related to each other (Akerstedt et al., 2002; Kecklund & Ackerstedt, 2004; Marquie, Foret, & Queinnec, 1999).
research of Minkel and colleagues (2014) used a hospital-based sleep laboratory and showed that CR of people with short-term sleep deprivation is significantly higher after a social stressor, namely Trier Social Stress Test (TSST), compared to people that were not sleep deprived (Minkel et al., 2014). Furthermore, a study by Goodin, Smith, Quinn, King and McGuire (2012) used the Pittsburgh Sleep Quality Index (PSQI) global score of 5 and lower to determine good sleep quality (GSQ) and a global score higher than 5 to indicate poor sleep quality (PSQ). They indicated that people with a PSQ have significantly greater CR in reaction to a physically stressful task, namely Cold Pressor Task (CPT), than people with a GSQ (Goodin, Smith, Quinn, King, & McGuire, 2012). Thus, two different methods have shown that poor quality sleepers have greater CR to different stressors in comparison to GSQ sleepers.
These findings are in contrast with findings of Capaldi, Handwerger, Richardson and Stroud (2005) and Wright, Valdimarsdottir, Erblich and Bovbjerg (2007). Capaldi and colleagues (2005) used self-reported sleep disturbances to demonstrate that PSQ is associated with blunted CR to a mentally stressful task. GSQ is associated with a significant increase in CR (Capaldi Ii, Handwerger, Richardson, & Stroud, 2005). Research of Wright and colleagues (2007) demonstrated the same findings by measuring SQ subjectively with a self-report diary in the home environment. They also measured SQ objectively with actigraphy. The actigraph is used to measure the sleep-wake cycles for seven days by sensing motion during sleep. With the actigraphy they did not find a relationship between SQ and CR. Moreover, they also investigated whether differences in CR of PSQ and GSQ could be better explained by individual differences. Individual differences that were named are acute fatigue and the experiencing of stress in the week before testing. However, the influence of the measured individual differences showed to be non-significant on CR. Wright and colleagues (2007) noted the possibility that high levels of long-term fatigue (LTF) may cause effect on CR (Wright, Valdimarsdottir, Erblich, & Bovbjerg, 2007). Altogether, the relationship between SQ and CR remains uncertain due to contrasting findings by different methods. There might be an influence of individual differences, such as LTF.
of fatigue (Adam et al., 2006). Furthermore, cortisol levels of non-fatigued and severe LTF individuals do not differ (ter Wolbeek, van Doornen, Coffeng, Kavelaars, & Heijnen, 2007). This could be an indication that the timing of low cortisol levels could be responsible for the experience of acute and LTF. However, this does not say anything about the relationship with CR. Research of Bower, Ganz and Aziz (2005) investigated whether CR differs in non-fatigued cancer survivors and LTF cancer survivors. Non-fatigued survivors showed a robust increase in cortisol levels, while cortisol levels of LTF cancer survivors increased slightly (Bower, Ganz, & Aziz, 2005). Whether the same effect occurs with healthy individuals with LTF remains unclear. Still, this could be an indication that LTF has an influence on CR as discussed by Wright and colleagues (2007). Altogether, the influence of fatigue on the relationship between SQ and CR remains uncertain.
2. Methods
2.1 Participants
Participants were included in the current study if they were physically and mentally healthy, Dutch speaking and between the age of 18 and 30 years. They were recruited through SONA, an online recruitment program, or the Facebook pages of Leiden University psychology students. A total of 48 participants completed the entire experimental procedure. Another three participants did not complete the entire experimental procedure. Participants were excluded if they had prolonged pain complaints or serious hand injuries. The participants were requested not to use any painkillers or medication 24 hours before the research, not to exercise, consume alcohol or use drugs the night before the study. Moreover, they were also requested not to smoke, nor to eat heavy meals or consume caffeine drinks such as coffee, tea, coke or energy drink two hours before the research as this might affect cortisol levels. The study was double blind and approved by the commission Ethiek Psychology of Leiden University. All participants were compensated for responding to only questionnaires, as well as the experimental part of the study. For the questionnaires, participants received €3,50 and the participants who filled in the questionnaires and did the experimental procedure received €22,00.
2.2 Research design
This is an experimental study containing a within subject design, in which the within subject variable were the cortisol levels and the between variable was the SQ. It was part of a larger study conducted at Leiden University. The study contained two parts. The first part consisted of an online assessment battery using the tool Qualtrics. The second part consisted of experimental stress tests and was performed on Tuesdays through Fridays. The study started in March and ended in December.
2.3 Variables
2.3.1 Fatigue
Fatigue was measured with a subscale, subjective experience of fatigue, of the Dutch version of the Checklist Individual Strength, named the Checklist Individuele Spankracht (CIS20R) (Vercoulen et al., 1994). It is a multidimensional specific fatigue scale questionnaire that measures fatigue experienced within the last two weeks. The questionnaire with only the subscale ‘subjective experience of fatigue’ is named, CIS8R. The CIS8R has a good internal consistency (r = .92). The
motivation (‘I feel very active’) and physical activity level (‘I am physically not very active’) (Dittner,
Wessely, & Brown, 2004). The CIS8R gives a total score that is calculated as the sum of eight items, ranging from 8 to 56. Total scores between 27 and 25 indicate heightened fatigue and a score higher then 35 indicate the presence of severe fatigue. The higher the score, the higher the fatigue level (Hewlett et al., 2011).
2.3.2 Sleep quality
Sleep quality (SQ) was measured with the Dutch version of the Pittsburgh Sleep Quality Index (PSQI). PSQI is a self-rated quantitative screening measurement tool. It does not provide accurate clinical diagnoses, but rather assesses SQ and disturbances over a one-moth time interval. PSQI has shown good internal consistency (α = .83) and good test-retest reliability of the overall global score (r = .87). The PSQI in the sample of the current study has also good internal consistency (r = .76; sub-scales are discussed below). It consists of 19 individual questions that provide a global PSQI score. The questionnaire can further be divided into seven sub-scales which weigh equally on a scale from 0 to 3. A 0 indicates no difficulty, while a 3 indicates severe difficulty. The components are: subjective SQ (‘how would you rate your sleep quality overall’), habitual sleep efficiency (‘when have you usually gone to bed at night’), sleeps disturbances (how often have you had trouble sleeping because you have bad dreams’), sleep duration (‘how many hours of actual sleep did you get at night’), sleep latency (‘how long has it usually take you to fall asleep each night’), use of sleep medication (‘how often have you taken medicine to help you sleep), and daytime dysfunction (‘how much of a problem
has it been for you to keep up enough enthusiasm to get things done’). A global PSQI score of 5 or higher indicates severe difficulties in at least two areas, or moderate difficulties in more than 3 areas. Participants obtaining a score of 5 or higher are classified as ‘poor’ quality sleepers. A score lower
than 5 indicates GSQ sleepers (Buysse et al., 1989).
2.4 Stress tasks
2.4.1 Physical stressor: Cold Pressure Task
The Cold Pressure Task (CPT) is a reliable and robust physical pain test that increases activity of the sympathetic nervous system and the HPA axis. The CPT consisted of putting the dominant hand up to the wrist in a NESLAB RTE-10 litre water bath with cold water. The water was approximately 4
°C (±0.2 ◦ C). The hand needed to be put into the water for as long as possible with a maximum duration of five minutes. Participants received standardized instructions such as ‘please try to keep your hand immersed in the water for at least two minutes or we are not able to use your data’ to
exposure to the CPT was classified as cold pressure pain tolerance (CPTo) (Goodin et al., 2012; Walsh, Schoenfeld, Ramamurthy, & Hoffman, 1989).
2.4.2 Psychosocial stressor: Trier Social Stress Test
The Trier Social Stress Test (TSST) is a psychosocial stimulation tool that has a profound effect on adrenocorticotropic hormone, human growth hormone, prolactin, serum and salivary cortisol response (Kirschbaum, Pirke, & Hellhammer, 1993). TSST consisted of two components, namely public speaking and mental arithmetic. The researcher and a two-person panel conducted the first component, public speaking. The panel always consisted of a male and a female. The researcher instructed the participant to prepare a talk, in which they needed to introduce themselves to a two-person panel and convince them that they are the perfect applicants for their dream vacant position. They were noted that the speech would be recorded with a camera and a voice recorder. Participants were given five minutes of preparation time and were provided with paper and pencils to outline their talks. For the preparation time the researcher and panel left the room. After five minutes, the panel returned and asked the participant to take place in an uncomfortable chair and requested the participant to leave their written concept for their speech behind. The panel emphasized that the speech is recorded with camera and voice recorder for further analyses. The participants were instructed to start their speech. The panel responded in a standardized way to evoke negative feelings and stress. The panel only started asking various scripted questions after three minutes. After six minutes the panel stopped the first component. The panel conducted the second component, mental arithmetic. Participants needed to serially subtract the number 17 from 1965 as fast and as accurately as possible. The subject had to restart with every failure or upon being silent for five seconds. The panel responded in a standardized way to evoke feelings of stress. After two minutes, the panel asked the participant to switch to an easier task. In this task participants were requested to subtract 13 from 1687 as fast as possible. Participants who refused to do math got a different task. They needed to increase the number 1 with steps of 2. The mental arithmetic assignment lasted four minutes (Kirschbaum et al., 1993).
2.5 Salivary cortisol reactivity
To evaluate the stress levels, cortisol levels were measured over time. They are a robust biomarker of the HPA axis activation. Cortisol levels were measured from oral fluids by using salivates from the brand Sarstedt (Kumari et al., 2009). After the experimental procedure, the saliva samples were refrigerated before being transferred to the laboratory Biobank Klinische Chemie en
Laboratoriumgeneeskunde in the Leids Universitair Medisch Centrum (LUMC). Cortisol was measured using electro-chemoluminescence immunoassays on Roche Modular Analytics E170
2.6 Experimental procedure
Through advertisements potential participants were asked to fill in an online test battery, consisting of Checklist Individual Strength (CIS8R) (Hewlett et al., 2011), PSQI (Buysse et al., 1989), RAND 36-item Health Survey (Hays & Morales, 2001), Penn Stage Worry Questionnaire (van Rijsoort, Emmelkamp, & Vervaeke, 1999), Medical Outcomes Study Sleep scale (Allen, Kosinski, Hill-Zabala, & Calloway, 2009) and the Eysenck Personality Questionnaire (Muniz, Garcia-Cueto, & Lozano, 2005).
Results of the questionnaires were treated anonymously and encoded. Encoding took place by an independent third party of Leiden University. On the basis of PSQI scores, at least 24 participants with a GSQ and 24 participants with PSQ were invited to participate in the experimental part of the study. A cut-off score of the global score 5 or higher on the PSQI indicated a PSQ and a score lower than 5 indicated GSQ (Buysse et al., 1989; Goodin et al., 2012). The participants were also divided into two groups based on the CIS8R. A cut-off score of the total score 36 and higher was used to determine the participants group LTF. Scores lower than 36 indicated the group NLTF (Hewlett et al., 2011). Participants have been invited two times to the Faculty of Social and Behavioural Sciences of Leiden University. In the invitation participants received information about the research, exclusion criteria and detailed instructions of what not to do prior to the research. In each session, either the TSST or the CPT was performed. Participants performed the second stress test a week after the completion of the first stress test. The order of the stress test was counterbalanced between participants. In each session the cortisol levels, Positive and Negative Affect Schedule (PANAS) and Visual Analogue Scale (VAS) for stress was measured six times: five minutes before and after the stress test, as well as 15, 25, 35 and 45 minutes after the stress test (Collins, Moore, & McQuay, 1997; Peeters, Ponds, & Vermeeren, 1996; Watson, Clark, & Tellegen, 1988). For the CPT additional measurements were taken. On the CPT form the duration of the CPT was noted, the first moment of pain, the average pain over CPT, the worst pain experienced in CPT, the average unpleasantness over CPT, and the temperature of the back of the hand before the CPT. Furthermore, participants filled in the short-form McGill Pain Questionnaire.
Each appointment consisted of providing information about the procedure, the stress test, filler tasks and a check-up of various questions whether participant did not meet the exclusion criteria. The experimental procedure took place in test rooms with a standardized setup. A laptop with charger was set up with the PANAS and VAS questionnaire in Qualtrics and a DVD of landscapes. A puzzle was placed on the small table and for each stress test a different puzzle was used. Six salivettes were placed on the big table in order, S1 to S6. The researchers wore white lab coats. For the CPT the water
bath with cold water of 4 °C (±0.2 ◦ C) was prepared twenty minutes before the test.
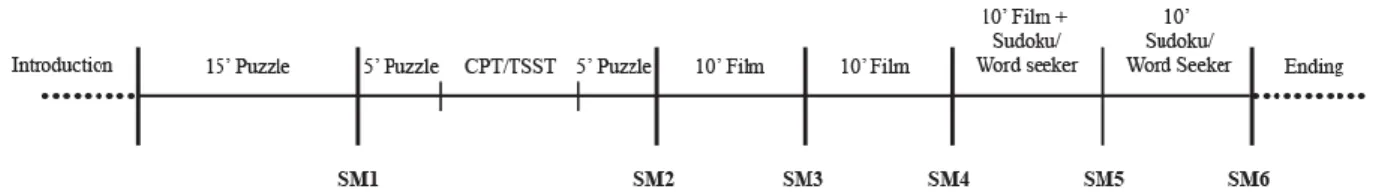
assignment to make a puzzle after which the experimenter left the room. After fifteen minutes, the experimenter returned and the participant received information about the cortisol sampling procedure, followed by the first measurement. Each measurement consisted of filling a salivette with saliva and filling in the questionnaires on Qualtrics. The participants were requested to drink water after each measurement. After completion, the experimenter left and the participant continued on the puzzle. After five minutes the experimenter returned and explained either the TSST or the CPT. The participant who followed the TSST would start directly with the test. The participant received five minutes of preparation time after which the experimenter left the room. The participant who followed the CPT was requested to continue on the puzzle for another five minutes, after which followed the CPT. On average, the CPT took fifteen minutes and the TSST twenty-five. After completion of the TSST or the CPT the participant was requested to work on the puzzle for five more minutes and the experimenter left the room. The second measurement took place after five minutes. Following, a movie of landscapes was used to fill out the time for the following two measurements, each measurement after ten minutes. After the fourth measurement, the participant received a Sudoku and a word seeker to fill out for the remaining ten minutes. Then, the last measurement took place. Participants got a debriefing after finishing both stress tasks from the experimenter. The debriefing consisted of an explanation about the scope of the research and confirmation that others had not informed them about the research. They were urged not to tell others about the content of the research. They were also informed that the TSST stress task consisted of unrealistic expectations so that negative emotions would be evoked. When the participant had left, Qualtrics was closed and the equipment and forms were stored in a closet inside the testing room. Information that has been given during the procedure may vary slightly based on the order of the stress tests that the participant follows.
Fig. 1 Schematic representation of the procedure with the salivette measurements (SM), activities with the taken time in minutes (e.g. 15’).
2.7 Statistical analyses
The results of the CIS8R, PSQI and cortisol level measurements were used to provide answers to the research question. Before participants were invited to the lab, two raters first classified participants’ SQ on the basis of the PSQI. These raters were other individuals than the experimenters.
divided into two groups based on the CIS8R. A cut-off score of the total score 36 and higher is used to determine the participants group LTF. Score lower than 36 indicate the group NLTF (Hewlett et al., 2011). The laboratory Biobank Klinische Chemie en Laboratoriumgeneeskunde inside the LUMC analyzed the salivette measurements over time, except the 35-minute measurements due to financial reasons. Unfortunately, 20 cortisol salivette samples gave a value under 1.5 nmol/L spread over nine participants. These measurements were set to one nmol/L after consultation with the laboratory Biobank Klinische Chemie en Laboratoriumgeneeskunde. The given salivette measurements were given in nmol/L and were transformed into the µg/dL to match the unity used in the Goodin (2012) study. The salivette measurement 5 minutes before the stress test represents the cortisol baseline. The statistical analyses were performed with IBM SPSS statistics 24. Analyses of the stress tests were done separately. In the data set one salivate measurement in the CPT test after 25 minutes could not be analysed because there was not enough saliva on the sample. Rather than exclude the participant, the macro for The Hot Deck Imputation (HDI) was used for the missing data point, which is effective statistically valid approach for missing data problems that is easy to use (Myers, 2011).
The salivette measurements were subjected to logarithmic transformation using a log10
transformation, since the measurements over time appeared to be highly skewed distributed according to Shapiro-Wilk’s test (p’s > 0.05) (Field, 2013).
Independent samples t-tests were performed to assess whether the baseline of participants with GSQ differs from the baseline of participants with PSQ. These analyses were performed for both stress tests separately. Also, paired sample t-tests were performed to see whether the CPT and TSST significantly induced a stress reaction. These analyses were performed between the measurements: baseline and 15 minutes after the stress test, 15 minutes after the stress test and 25 minutes after the stress test and between 25 minutes and 45 minutes. They were performed to see whether cortisol levels significantly differ from each other. For every independent sample t-test and paired sample t-test the assumptions were checked, namely the assumption of normality was assessed by Shapiro-Wilk’s test (p > .05) and possible outliers were detected with the outlier-labeling rule with a multiplication value of 2.2 (Hoaglin & Iglewicz, 1987). After checking if the stress test had effect, the Area Under the Curve (AUCI) is calculated which represents the CR. It is calculated by using the trapezoid formula to
summarize the salivette measurements over time for both the TSST and the CPT. AUCI is a frequented
method in neuroscience to comprise information that is contained in repeated measurements over time (Pruessner, Kirschbaum, Meinlschmid, & Hellhammer, 2003).
depended variable was the AUCI of the TSST or the CPT and the independent variable was the
classification GSQ and PSQ, line c in figure 2. The second model had the classification LTF and NLTF as depended variable and the classification GSQ and PSQ as independent variable, line a in figure 2. In the third model the depended variable was the AUCI of the TSST or the CPT and the
independent variable the classification LTF and NLTF, line b in figure 2. The fourth model was checked with a multiple regression analysis. In this analysis, the dependent variable was the AUCI of
the TSST or the CPT and the independent variables were the classification GSQ and PSQ and the classification LTF and NLTF, line c’ in figure 2. (Baron & Kenny, 1986).
Fig. 2 Schematic representation of the mediation analysis with poor sleep quality (PSQ), good sleep quality (GSQ), long-term fatigue (LTF) and not long-term fatigue (NLTF).
For every simple linear analysis, the assumptions were checked. Namely, the assumption of linearity was checked with a plot and the assumption of normality was assessed by Shapiro-Wilk’s test (p > .05). Moreover, possible outliers were detected with the outlier-labeling rule with a multiplication value of 2.2 (Hoaglin & Iglewicz, 1987), the assumption of independent errors assessed with the Durbin-Watson test (value > 1 and < 3) and the assumption of homoscedasticity was assessed by the scatterplot of the standardized residual and predicted value. In case of violation of the assumption of normality, bootstrapping 95% bias corrected confidence interval was used. For the multiple regression analyses the additional assumption of multicollinearity is examined by the tolerance (not < 0.1) and variance inflation factor (not > 2.5) (Field, 2013).
In addition to the mediation analyses, bivariate relationships between gender, PSQI global score, PSQI component scores, CIS8R total score, baseline and AUCI for the CPT and TSST were also
3. Results
3.1 Demographic results
Forty-eight participants completed the whole experimental procedure (34 females, 14 males,
Mage = 21.77). Another three participants only completed the CPT test. This resulted in 51 participants
for the CPT test (36 females, 15 males, Mage = 21.67). Two participants did not complete the CIS8R
questionnaire in Quatrics. Table 1 and 2 represents an overview of the total participants with GSQ or PSQ and LTF or NLTF in both the stress tests CPT and TSST.
Table 1
Overview number of participants in the categories good quality sleepers and poor quality sleepers in the CPT and TSST.
TSST Male TSST Female TSST Total CPT Male CPT Female CPT Total
GSQ 7 18 25 7 19 26
PSQ 7 16 23 8 17 25
Note: CPT = Cold Pressure Task; TSST = Trier Social Stress Test; GSQ = Good Sleep Quality; PSQ = Poor Sleep Quality.
Table 2
Overview number of participants in the categories long-term fatigued and not long-term fatigued in the CPT and TSST.
TSST Male TSST Female TSST Total CPT Male CPT Female CPT Total
LTF 12 17 29 13 18 31
NLTF 2 16 18 2 16 18
Note: LTF = Long-term Fatigue; NLTF = Not Long-term Fatigue.
3.2 Salivary cortisol over time
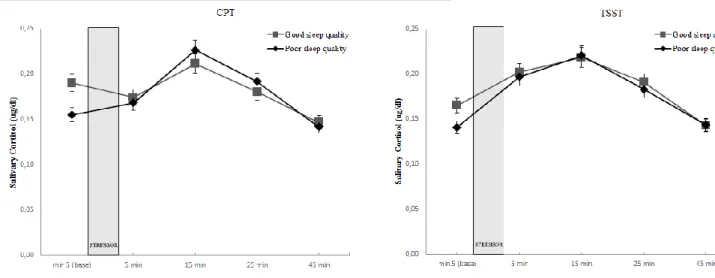
Salivary cortisol measurements over time for the groups PQS and the GSQ in the CPT and TSST are portrayed in figure 3. Independent samples t-tests were performed to assess whether the baseline of participants with GSQ (M -.8 differs from the baseline of participants with PSQ. These analyses were performed for both stress tests separately. No outliers were detected by using the outlier-labeling rule. Only the baseline cortisol level of the TSST was normally distributed, as assessed by Shapiro-Wilk’s test (p > .05). Therefore, bootstrapping of 95% bias corrected confidence interval was used.
In the CPT, the baseline of participants with GSQ (M = -0.81, SE = 0.05) was higher than the baseline of participants with PSQ (M = -0.85, SE = 0.04). This difference, 0.04, BCa 95% CI [-0.08, 0.17], was not significant t(49) = 0.67, p = .507, and represented a small-sized effect, d = 0.19.
In the TSST, the baseline of participants with GSQ (M = -0.85, SE = 0.05) was higher than the baseline of participants with PSQ (M = -0.94, SE = 0.06). This difference, 0.09, BCa 95% CI [-0.05, 0.24], was not significant t(46) = 1.26, p = .227, and represented a medium-sized effect, d = 0.36.
measurements 15 minutes, 25 and 45 were considered. Almost all the measurements in the CPT and TSST were normally distributed as assessed by Shapiro-Wilk’s test (p > .05) and no outliers were detected by using the outlier-labeling rule. It should be noted that only the CPT baseline violated the test of normality. Therefore, bootstrapping of 95% bias corrected confidence interval was used.
In the CPT, participants’ cortisol levels reached its peak 15 minutes after the stress test (M =
-0.75, SE = 0.04). When compared to the baseline (M = -0.83, SE = 0.03), it had an increase, on average, of -0.09, BCa 95% CI [-0.16, -0.02]. This increase was significant t(50) = -2.39, p = .021, and represented a small-sized effect, d = 0.31. After 15 minutes, the cortisol levels start to decrease. The cortisol levels 25 minutes after the CPT (M = -0.83, SE = 0.04) were lower in comparison to the cortisol levels 15 minutes after the CPT (M = -0.75, SE = 0.04). This difference, 0.08, BCa 95% CI [0.05, 0.11], was significant t(50) = 5.63, p < 0.001, and represented a small-sized effect, d = 0.30. The cortisol levels keep decreasing, whereas the cortisol measurement 45 minutes after the CPT (M = -0.93, SE = 0.04) are lower in comparison to the cortisol levels 25 minutes after the CPT (M = -0.83,
SE = 0.04). This difference, 0.10, BCa 95% CI [0.08, 0.13], was significant t(50) = 7.10, p < 0.001, and represented a small-sized effect, d = 0.34. Furthermore, the 45 minutes cortisol measurement (M = -0.93, SE = 0.04) appears to be significant lower than the baseline (M = -0.83, SE = 0.03), with a difference of 0.10, BCa 95% CI [0.03, 0.17], t(50) = 2.84, p = 0.006, and represented a small-sized effect, d = 0.44.
Fig 3. Difference in salivette cortisol concentrations over time between good and poor quality sleepers. Error bars represents a 95% confidence interval. The gray box labeled “STRESSOR” indicates the timing of the CPT and TSST.
3.3 Correlations
To assess if the SQ components of the PSQI, fatigue measured by CIS8R, gender, baseline cortisol levels and CR are related with each other, Pearson correlations were performed. The analyses show how the baseline cortisol levels of the CPT and TSST, CR of the CPT and TSST, gender, total CIS8R score, score on the components of the PSQI and the total PSQI score are related, see table 3. Gender is significantly correlated with the CPT baseline cortisol (r = -.30, p = .035). The total score of the CIS8R appeared to be related to several components of the PSQI, namely Subjective SQ (r = -.36,
p = .012), Sleep disturbances (r = -.33, p = .023) and Daytime dysfunction (r = -.53, p < .001). It was also significantly related to the global PSQI score (r = -.48, p = .001). Closely looking into the components of PSQI, it appeared that not all components were significantly correlated. The component “Use of sleep medication” was only significantly related to the global PSQI score (r = .30,
Table 3
Zero-order correlations.
(1) (2) (3) (4) (5) (6) (7) (8) (9) (10) (11) (12) (13)
(1) Gender -
(2) Subjective sleep quality**
.08 - (3) Sleep latency** -.15 .56* - (4) Sleep duration** -.12 .48* .54* - (5) Habitual sleep
efficiency**
.32* .50* .40* .53* - (6) Sleep disturbances** .01 .55* .41* .42* .33* - (7) Use of sleep
medication**
.06 .14 .16 .16 .05 .18 - (8) Daytime dysfunction** .04 .39* .35* .12 .10 .23 .07 - (9) Global PSQI score .04 .81* .82* .72* .67* .64* .30* .51* - (10) CIS8R total score -.19 -.36* -.27 -.25 -.28 -.33* -.24 -.53* -.48* - (11) CPT Baseline
cortisol (µg/dL)
-.30* -.13 .08 .04 -.05 .03 -.17 .04 -.02 .22 - (12) TSST Baseline
cortisol (µg/dL)
-.03 -.06 -.18 -.16 -.07 -.03 .04 -.04 -.12 .09 .38* - (13) CPT Cortisol
reactivity AUCI
.08 .03 .17 -.13 -.03 -.17 -.01 .25 .06 -.07 -.30* -.35* - (14) TSST Cortisol
reactivity AUCI
-.02 -.005 .11 -.06 -.02 -.07 .02 .12 .03 -.07 -.07 -.56* .39* Note: Gender is coded 1 = men, 2 = woman; CIS8R = Checklist Individuele Spankracht; µg/dL = micrograms per deciliter; TSST = Trier Social Stress Test; AUCI = area under the curve for cortisol reactivity; ** = component of the Pittsburgh Sleep Quality Index; * p < .05.
3.4 Cortisol reactivity, sleep quality and long-term fatigue
Mediation analyses were formed two times, for the CPT and the TSST to test the hypotheses. Each mediation analysis contained four models, three models were checked with linear regression analyses and one multiple regression analysis. All the measurements in these analyses had no outliers that were detected by using the outlier-labeling rule and the assumption of independent errors assessed with the Durbin-Watson test (value > 1 and < 3) was met for the CPT and TSST. In all the models,
the assumption of homoscedasticity assessed by the scatterplot of the standardized residual and predicted value and assumption of linearity were violated, possibly because of the dichotomous variable SQ. The CPT AUCI and TSST AUCI were normally distributed as assessed by
Shapiro-Wilk’s test (p > .05). The classifications of SQ and LTF were not normally distributed.
Therefore, bootstrapping 95% bias corrected confidence interval was used. For the multiple regression analyses additional assumption of multicollinearity was checked. The predictors did not violate the assumption examined by the tolerance (not < 0.1) and variance inflation factor (not > 2.5).
see table 4. Supporting the hypothesis that participants with PSQ are more long-term fatigued than participants with GSQ. The third model is also checked with a simple linear regression to check whether participants who are LTF show higher CR after exposure to acute stressors than participants who are NLTF. The model showed not to be significant (F(1,47) = 0.143, p = .707), see table 5. The fourth model of the mediation analysis was performed, even though there was no significant effect of SQ on CR and LTF on CR in the CPT. The fourth model was checked with a multiple regression analysis to assess whether the relationship between SQ and CR after exposure to acute stressors would be mediated by LTF. There was no significant effect of SQ and LTF on CR (F(1,46) = 0.483, p = .620, with an R2 of .021), see table 5.
Table 4
Simple linear regression analysis of the model in the CPT and TSST.
b (SE) p CI*
Model 1. SQ on LTF 0.291 (0.132) .037** 0.030, 0.550 Note: SE = Standard error; * CI = Confidence Interval BCa 95; ** p < .05.
Table 5
Regression analyses of the different models for the CPT.
b (SE) p CI*
Model 1. SQ on CR 4.203 (3.011) .168 -2.005, 9.809 Model 3. LTF on CR 1.200 (3.184) .698 -4.854, 7.287 Model 4. SQ and LTF on CR
- SQ - LTF
2.922 (3.323) 0.289 (3.561)
.401 .923
-3.579, 9.124 -7.181, 6.923 Note: *CI = Confidence Interval BCa 95%.
after exposure to acute stressors would be mediated by LTF. There was no significant effect of SQ and LTF on CR (F(1,44) = 0.719, p = .493, with an R2 of .032), see table 6. This finding and the finding of the model in the CPT do not support the hypothesis that the relationship between SQ and CR after exposure to acute stressors is be mediated by LTF.
Table 6
Regression analyses of the different models for the CPT.
b (SE) p CI*
Model 1. SQ on CR 4.906 (4.074) .233 -2.915, 13.054 Model 3. LTF on CR 3.297 (3.900) .426 -4.416, 10.768 Model 4. SQ and LTF on CR
- SQ - LTF
4.158 (5.150) 1.959 (4.855)
.435 .681
4. Discussion
The aim of this study was to investigate possible relationships between SQ, CR and fatigue, and to replicate previous findings by Goodin and colleagues (2012), and Minkel and colleagues (2014). Only a relationship between SQ and fatigue has been found. In the current study, CR was generated two times by using a stressor, namely the CPT and TSST. Participants’ cortisol levels showed a significant increase after the stressor in comparison to their baseline cortisol levels. This increase was found in both stress tests. Also, the rebound appears 45 minutes after the stress tests. In other words, the use of the stress tests CPT and TSST were successful. The baseline cortisol levels of participants with PSQ did not significantly differ from the baseline cortisol levels of participants with GSQ in the CPT and TSST. For the analyses, the AUCI was calculated by using the cortisol
measurements over time that represents CR. This was done twice: once for the CPT and once for the TSST. Only a relationship between SQ and fatigue was found.
To assess how the SQ components of the PSQI, fatigue, gender, baseline cortisol levels and CR were related, Pearson correlations were performed, leading to some interesting findings. Firstly, not every component of SQ is related to each other, which is surprising considering the internal consistency of the PSQI. For example, the aspect ‘use of sleep medication’ is not related to any other
aspect within the PSQI. This could be due to the fact that the use of medication excluded participants from the current study. Secondly, the baseline cortisol levels and CR of the CPT and TSST are not related to any component of the SQ and to fatigue measured by the CIS8R. This was not expected, as multiple studies found a link between SQ and CR (Goodin et al., 2012; Minkel et al., 2014). Thirdly, LTF is related to SQ, but not related to all components of SQ. It is not related to sleep latency, sleep duration, use of sleep medication and habitual sleep efficiency. This is a surprising finding, as fatigue has been shown to be related to sleep efficiency in another study (Lichstein, Means, Noe, & Aguillard, 1997).
associated with SQ. Therefore, the results do not support the hypothesis that the relationship between SQ and CR is mediated by LTF. To summarize, the results of this study show that stress invoked by a physically stressful condition and a socially stressful condition cannot be predicted by the SQ measured by the PSQI and LTF measured by the CIS8R. These findings were surprising since they are not in accordance with most of the hypotheses. Therefore, it could be debated how the results of the current study differ from the aforementioned expectations.
Multiple studies found either that PSQ leads to higher CR (Goodin et al., 2012; Minkel et al., 2014) or to a blunted cortisol response (Capaldi Ii et al., 2005; Wright et al., 2007). These
discrepancies could be explained by a difference in the method and the definition of SQ. SQ can be measured subjectively on the basis of self-report or objectively, for example with actigraphy. Some studies found a relationship between CR and components of objective SQ, namely sleep deprivation, wake percentage, minutes awake, number of wake episodes and sleep efficiency (Minkel et al., 2014; Wright et al., 2007). However, other studies found a relationship between the overall definition of subjective SQ and CR (Capaldi Ii et al., 2005; Goodin et al., 2012) or no relationship between subjective SQ and CR at all (Bassett, Lupis, Gianferante, Rohleder, & Wolf, 2015; Wright et al., 2007). Taking a closer look at the method, it appears that Goodin (2012) and Basset (2015) both used the self-report PSQI to measure SQ subjectively. However, participants in the study of Goodin (2012) filled out the PSQI beforehand, while participants in the study of Basset (2015) filled out the PSQI in 30 minutes after the stress test. Both studies had the same aim but their conclusions were different. It could be debated that the timing of the PSQI was of influence. Also, it should be noted that Goodin (2012) used the CPT stress test and Bassett (2015) the TSST stress test. This might be a reason both studies led to different results. Minkel (2012) showed that more intense stressors, for example the TSST and a difficult version of the Stroop color-naming task, were less influenced by sleep deprivation, a part of SQ, than mild stressors (Minkel et al., 2012). The CPT can be argued to be a mild stressor task that causes different findings in the study. However, in this study participants filled out the PSQI before they got invited to participate in the experimental procedure which contained both stress test CPT and TSST. No relationship was found. Results of the current study might indicate that the timing of the PSQI or the intensity of the stress task do not affect the relationship between SQ and CR. However, unlike Goodin (2012), this study did not statistically adjust for gender, positive and negative affect schedule questionnaire and cold pressure tolerance. Moreover, it could be debated that the results of the CPT were not influenced by third factors, like gender (Vigil & Coulombe, 2011). However, correlation analyses show no correlation between CR and gender. It should be mentioned, that in the current study gender is not equally balanced. Future research with a balanced (or
threshold (Levine & Desimone, 1991). More research is needed to determine exactly what influences the possible relationship between CR and SQ by using the CPT. Besides, not every discussed study used the PSQI to measure SQ.
Firstly, Minkel (2014) controlled the sleep pattern of participants in sleep laboratory to measure sleep deprivation objectively. In this study, Minkel found a relationship between SQ and CR by using the stress test TSST (Minkel et al., 2014). Secondly, Wright (2007) used an actigraphy to measure sleep components. Associations between CR and the SQ components wake percentage, minutes awake, number of wake episodes and sleep efficiency were found by using the Stroop-color test as a stressor. Additionally, Wright (2007) also used the VAS self-report to measure SQ. Unlike the actigraphy, no relationship was found between the VAS self-reported SQ and CR (Wright et al., 2007). It looks like there is no relationship between SQ and CR when SQ is measured subjectively. There appears to be a relationship between SQ and CR when SQ is measured objectively, by using either the TSST or the Stroop-Color test. This is with the exception of the study of Goodin (2012) who found a relationship between SQ and CR when SQ is measured objectively with the PSQI. Next to the different design of the study, alternative findings could be due to the selected population.
In the study carried out for this research paper, most of the recruitment took place through SONA, an online recruitment program, and the Facebook pages of Leiden University psychology students. The recruitment process has resulted in a group of many psychology students and an average age of 21. This has probably affected the results, as both younger people and highly educated people experience more complaints of fatigue (Bensing, Hulsman, & Schreurs, 1999). Psychology students are also generally more mentally fatigued than people with occupations like soldiers or junior physicians (Smets, Garssen, Bonke, & Dehaes, 1995). This could explain why the majority of the current study sample experiences long term fatigue. Also, the question is whether the results of the current study are representative of and could thus be generalized to the general population. Unfortunately, it remains unclear whether the sample group has affected the results. This study did take these possible influences on the results into account.
study. Despite the fact that there are several possible influences that have affected the results, the current study has a strong design.
The strengths of this study are the double-blind design of the study, large number of participants, and the similarity of the baseline in both SQ conditions prior to the stressors and its comprehensiveness. In addition, the study also looks at physical and social stress instead of only one kind of stress. However, the study presented in this research paper also has limitations.
Firstly, not every participant finished the entire study. One participant did not want to continue after the first part of the experimental procedure, another participant could not continue due to medication use, and a third participant did not respond to the second invitation. Secondly, the time between filling out the PSQI and the experimental procedure differs for each participant. In some cases, it took more than a month. This could be of influence, since the PSQI measures the SQ in the last month (Buysse et al., 1989). This results in the possibility that the SQ of participants could have changed over time. Thirdly, it is unclear if the participants truthfully completed the online test battery. Potential bias may have occurred, in particular that participants completed the online test battery in a way that they thought would get them invited to participate in the study. Unfortunately, this could not be checked. Fourthly, participants with poor SQ were harder to find, resulting in a long testing period. Because of the long testing period, the testing location was not always available. Therefore, an alternative testing room was used to speed up the testing period. However, this could raise the question whether the different testing rooms had an influence on the CR. As seen in the methodology, the TSST has a standardized set up room. Despite the standardized set up, the rooms did not always match up exactly in terms of materials and room size. It remains unclear whether the change of room would influence or has influenced the CR in the TSST. Fifthly, because of the delay, some participants were allowed to participate in the study despite not fully meeting the inclusion criteria. Circumstances and differentiations around the inclusion criteria have been documented before each stress test, examples are having experienced a stressful event prior to the experiment or eating prior the stress test. This could reflect in the cortisol levels. However, no outliers were detected in the analyses. Finally, the testing period lasted for a time period of seven months. This could affect the basal cortisol levels since cortisol significantly varies per season. Lowest cortisol levels are measured during the summer (Hadlow, Brown, Wardrop, & Henley, 2014).
The study also has some limitations that arise in the research plan, which must be taken into consideration. Different panel people conducted the TSST. The TSST relies on the ability of the panel to react in a standardized way that stresses the participants (Kirschbaum et al., 1993). Some panel members may have outperformed their roll, therefore enhancing the stress reaction. In contract, some panel members may also have invoked less stressful reactions. These differences could reflect in the cortisol levels of the test subjects. Also, the study was executed inside a laboratory. Naturally it could be discussed whether the laboratory responses of the CPT and TSST could be generalised to stressful conditions in daily life. However, research of Kidd, Carvalho and Steptoe (2014) show that laboratory-field association is not moderated by demographic or psychosocial factors and provides evidence for ecological validity of acute laboratory stress testing (Kidd, Carvalho, & Steptoe, 2014). Therefore, findings of the current study could be generalized to stressful conditions in daily life.
References
Adam, E. K., Hawkley, L. C., Kudielka, B. M., & Cacioppo, J. T. (2006). Day-to-day dynamics of experience-cortisol associations in a population-based sample of older adults. Proceedings of the National Academy of Sciences of the United States of America, 103(45), 17058-17063. doi:10.1073/pnas.060503103
Akerstedt, T., Knutsson, A., Westerholm, P., Theorell, T., Alfredsson, L., & Kecklund, G. (2002). Sleep disturbances, work stress and work hours: A cross-sectional study. Journal of Psychosomatic Research, 53(3), 741-748. doi:10.1016/s0022-3999(02)00333-1
Allen, R. P., Kosinski, M., Hill-Zabala, C. E., & Calloway, M. O. (2009). Psychometric evaluation and tests of validity of the Medical Outcomes Study 12-item Sleep Scale (MOS sleep). Sleep Medicine, 10(5), 531-539. doi:10.1016/j.sleep.2008.06.003
Baron, R. M., & Kenny, D. A. (1986). The moderator–mediator variable distinction in social psychological research: Conceptual, strategic, and statistical considerations. Journal of personality and social psychology, 51(6), 1173.
Bassett, S. M., Lupis, S. B., Gianferante, D., Rohleder, N., & Wolf, J. M. (2015). Sleep quality but not sleep quantity effects on cortisol responses to acute psychosocial stress. Stress-the
International Journal on the Biology of Stress, 18(6), 638-644. doi:10.3109/10253890.2015.1087503
Bensing, J. M., Hulsman, R. L., & Schreurs, K. M. G. (1999). Gender differences in fatigue - Biopsychosocial factors relating to fatigue in men and women. Medical Care, 37(10), 1078-1083. doi:10.1097/00005650-199910000-00011
Beurskens, A., Bultmann, U., Kant, I., Vercoulen, J., Bleijenberg, G., & Swaen, G. M. H. (2000). Fatigue among working people: Validity of a questionnaire measure. Occupational and Environmental Medicine, 57(5), 353-357. doi:10.1136/oem.57.5.353
Bower, J. E., Ganz, P. A., & Aziz, N. (2005). Altered cortisol response to psychologic stress in breast cancer survivors with persistent fatigue. Psychosomatic Medicine, 67(2), 277-280.
doi:10.1097/01.psy.0000155666.55034.c6
Buysse, D. J., Reynolds, C. F., Monk, T. H., Berman, S. R., & Kupfer, D. J. (1989). The Pittsburgh Sleep Quality Index: A new instrument for psychiatric practice and research. Psychiatry Research, 28(2), 193-213. doi:10.1016/0165-1781(89)90047-4
Capaldi Ii, V. F., Handwerger, K., Richardson, E., & Stroud, L. R. (2005). Associations between sleep and cortisol responses to stress in children and adolescents: A pilot study. Behavioral sleep medicine, 3(4), 177-192. doi:10.1207/s15402010bsm0304_1
Carroll, D., Phillips, A. C., & Der, G. (2008). Body mass index, abdominal adiposity, obesity, and cardiovascular reactions to psychological stress in a large community sample. Psychosomatic Medicine, 70(6), 653-660. doi:10.1097/PSY.0b013e31817b9382
Collins, S. L., Moore, R. A., & McQuay, H. J. (1997). The visual analogue pain intensity scale: What is moderate pain in millimetres? Pain, 72(1-2), 95-97. doi:10.1016/s0304-3959(97)00005-5 Dittner, A. J., Wessely, S. C., & Brown, R. G. (2004). The assessment of fatigue: A practical guide for
clinicians and researchers. Journal of Psychosomatic Research, 56(2), 157-170. doi:10.1016/s0022-3999(03)00371-4
Epel, E. S., McEwen, B., Seeman, T., Matthews, K., Castellazzo, G., Brownell, K. D., . . . Ickovics, J. R. (2000). Stress and body shape: Stress-induced cortisol secretion is consistently greater among women with central fat. Psychosomatic Medicine, 62(5), 623-632.
Field, A. (2013). Discovering statistics using IBM SPSS statistics: Sage.
Goodin, B. R., Smith, M. T., Quinn, N. B., King, C. D., & McGuire, L. (2012). Poor sleep quality and exaggerated salivary cortisol reactivity to the cold pressor task predict greater acute pain severity in a non-clinical sample. Biological Psychology, 91(1), 36-41.
doi:10.1016/j.biopsycho.2012.02.020
Hartwig, E. A., Aust, S., & Heuser, I. (2013). HPA system activity in alexithymia: A cortisol awakening response study. Psychoneuroendocrinology, 38(10), 2121-2126.
doi:10.1016/j.psyneuen.2013.03.023
Hays, R. D., & Morales, L. S. (2001). The RAND-36 measure of health-related quality of life. Annals of Medicine, 33(5), 350-357. doi:10.3109/07853890109002089
Hewlett, S., Dures, E., & Almeida, C. (2011). Measures of Fatigue Bristol Rheumatoid Arthritis Fatigue Multi-Dimensional Questionnaire (BRAF MDQ), Bristol Rheumatoid Arthritis Fatigue Numerical Rating Scales (BRAF NRS) for Severity, Effect, and Coping, Chalder Fatigue Questionnaire (CFQ), Checklist Individual Strength (CIS20R and CIS8R), Fatigue Severity Scale (FSS), Functional Assessment Chronic Illness Therapy (Fatigue) (FACIT-F), Multi-Dimensional Assessment of Fatigue (MAF), Multi-Dimensional Fatigue Inventory (MFI), Pediatric Quality Of Life (PedsQL) Multi-Dimensional Fatigue Scale, Profile of Fatigue (ProF), Short Form 36 Vitality Subscale (SF-36 VT), and Visual Analog Scales (VAS). Arthritis Care & Research, 63, S263-S286. doi:10.1002/acr.20579
Hoaglin, D. C., & Iglewicz, B. (1987). Fine-tuning some resistant rules for outlier labeling. Journal of the American Statistical Association, 82(400), 1147-1149. doi:10.2307/2289392
Kecklund, G., & Ackerstedt, T. (2004). Apprehension of the subsequent working day is associated with a low amount of slow wave sleep. Biological Psychology, 66(2), 169-176.
doi:10.1016/j.biopsycho.2003.10.004
Kidd, T., Carvalho, L. A., & Steptoe, A. (2014). The relationship between cortisol responses to laboratory stress and cortisol profiles in daily life. Biological Psychology, 99, 34-40. doi:10.1016/j.biopsycho.2014.02.010
Kirschbaum, C., Pirke, K. M., & Hellhammer, D. H. (1993). The Trier Social Stress Test: A tool for investigating psychobiological stress responses in a laboratory setting. Neuropsychobiology, 28(1-2), 76-81. doi:10.1159/000119004
Kumari, M., Badrick, E., Ferrie, J., Perski, A., Marmot, M., & Chandola, T. (2009). Self-reported sleep duration and sleep disturbance are independently associated with cortisol secretion in the Whitehall II study. Journal of Clinical Endocrinology & Metabolism, 94(12), 4801-4809. doi:10.1210/jc.2009-0555
Leproult, R., Copinschi, G., Buxton, O., & VanCauter, E. (1997). Sleep loss results in an elevation of cortisol levels the next evening. Sleep, 20(10), 865-870.
Levine, F. M., & Desimone, L. L. (1991). The effects of experimenter gender on pain report in male and female subjects. Pain, 44(1), 69-72. doi:10.1016/0304-3959(91)90149-r
Lichstein, K. L., Means, M. K., Noe, S. L., & Aguillard, R. N. (1997). Fatigue and sleep disorders.
Behaviour Research and Therapy, 35(8), 733-740. doi:10.1016/s0005-7967(97)00029-6 Mariman, A. N., Vogelaers, D. P., Tobback, E., Delesie, L. M., Hanoulle, I. P., & Pevernagie, D. A.
(2013). Sleep in the chronic fatigue syndrome. Sleep Medicine Reviews, 17(3), 193-199. doi:10.1016/j.smrv.2012.06.003
Marquie, J. C., Foret, J., & Queinnec, Y. (1999). Effects of age, working hours, and job content on sleep: A pilot study. Experimental Aging Research, 25(4), 421-427.
doi:10.1080/036107399243896
Meerlo, P., Sgoifo, A., & Suchecki, D. (2008). Restricted and disrupted sleep: Effects on autonomic function, neuroendocrine stress systems and stress responsivity. Sleep Medicine Reviews, 12(3), 197-210. doi:10.1016/j.smrv.2007.07.007
Miller, G. E., Chen, E., Fok, A. K., Walker, H., Lim, A., Nicholls, E. F., . . . Kobor, M. S. (2009). Low early-life social class leaves a biological residue manifested by decreased glucocorticoid and increased proinflammatory signaling. Proceedings of the National Academy of Sciences of the United States of America, 106(34), 14716-14721. doi:10.1073/pnas.0902971106
Minkel, J., Banks, S., Htaik, O., Moreta, M. C., Jones, C. W., McGlinchey, E. L., . . . Dinges, D. F. (2012). Sleep Deprivation and Stressors: Evidence for Elevated Negative Affect in Response to Mild Stressors When Sleep Deprived. Emotion, 12(5), 1015-1020. doi:10.1037/a0026871 Minkel, J., Moreta, M., Muto, J., Htaik, O., Jones, C., Basner, M., & Dinges, D. (2014). Sleep
Mueller, A., Strahler, J., Armbruster, D., Lesch, K. P., Brocke, B., & Kirschbaum, C. (2012). Genetic contributions to acute autonomic stress responsiveness in children. International Journal of Psychophysiology, 83(3), 302-308. doi:10.1016/j.ijpsycho.2011.11.007
Muniz, J., Garcia-Cueto, E., & Lozano, L. M. (2005). Item format and the psychometric properties of the Eysenck Personality Questionnaire. Personality and Individual Differences, 38(1), 61-69. doi:10.1016/j.paid.2004.03.021
Myers, T. A. (2011). Goodbye, listwise deletion: Presenting hot deck imputation as an easy and effective tool for handling missing data. Communication Methods and Measures, 5(4), 297-310.
Peeters, F., Ponds, R., & Vermeeren, M. (1996). Affectiviteit en zelfbeoordeling van depressie en angst. Tijdschrift voor psychiatrie, 38, 240-250.
Pilcher, J. J., & Huffcutt, A. I. (1996). Effects of sleep deprivation on performance: A meta-analysis.
Sleep, 19(4), 318-326.
Pruessner, J. C., Kirschbaum, C., Meinlschmid, G., & Hellhammer, D. H. (2003). Two formulas for computation of the area under the curve represent measures of total hormone concentration versus time-dependent change. Psychoneuroendocrinology, 28(7), 916-931.
doi:10.1016/s0306-4530(02)00108-7
Sapolsky, R. M. (1994). Why zebras don't get ulcers: New York, NY: WH Freeman.
Schmidt, M. E., Semik, J., Habermann, N., Wiskemann, J., Ulrich, C. M., & Steindorf, K. (2016). Cancer-related fatigue shows a stable association with diurnal cortisol dysregulation in breast cancer patients. Brain, Behavior and Immunity, 52, 98-105.
Smets, E. M. A., Garssen, B., Bonke, B., & Dehaes, J. (1995). The Multidimensional Fatigue Inventory (MFI) psychometric qualities of an instrument to assess fatigue. Journal of Psychosomatic Research, 39(3), 315-325. doi:10.1016/0022-3999(94)00125-o
ter Wolbeek, M., van Doornen, L. J. P., Coffeng, L. E., Kavelaars, A., & Heijnen, C. J. (2007). Cortisol and severe fatigue: A longitudinal study in adolescent girls.
Psychoneuroendocrinology, 32(2), 171-182. doi:10.1016/j.psyneuen.2006.12.003
van Rijsoort, S., Emmelkamp, P., & Vervaeke, G. (1999). The Penn State Worry Questionnaire and the Worry Domains Questionnaire: Structure, reliability and validity. Clinical Psychology & Psychotherapy, 6(4), 297-307.
doi:10.1002/(sici)1099-0879(199910)6:4<297::aid-cpp206>3.0.co;2-e
Vercoulen, J., Swanink, C. M. A., Fennis, J. F. M., Galama, J. M. D., Vandermeer, J. W. M., & Bleijenberg, G. (1994). Dimensional assessment of chronic fatigue syndrome. Journal of Psychosomatic Research, 38(5), 383-392. doi:10.1016/0022-3999(94)90099-x
Vigil, J. M., & Coulombe, P. (2011). Biological sex and social setting affects pain intensity and observational coding of other people's pain behaviors. Pain, 152(9), 2125-2130. doi:10.1016/j.pain.2011.05.019
Walsh, N. E., Schoenfeld, L., Ramamurthy, S., & Hoffman, J. (1989). Normative model for Cold Pressor Test. American Journal of Physical Medicine & Rehabilitation, 68(1), 6-11. doi:10.1097/00002060-198902000-00003
Watson, D., Clark, L. A., & Tellegen, A. (1988). Development and validation of brief measures of positive and negative affect: The PANAS scales. Journal of Personality and Social Psychology, 54(6), 1063-1070. doi:10.1037/0022-3514.54.6.1063