Trans-ethnic
analysis
of
metabochip
data
identi
fi
es
two
new
loci
associated
with
BMI
J
Gong
1,
KK
Nishimura
1,
L
Fernandez-Rhodes
2,
J
Haessler
1,
S
Bien
1,
M
Graff
2,
U
Lim
3, Y
Lu
4,5,6,
M
Gross
7,
M
Fornage
8,
S
Yoneyama
2,
CR
Isasi
9,
P
Buzkova
10,
M
Daviglus
11,
D-Y
Lin
12, R Tao
12,
R
Goodloe
13,
WS
Bush
14,
E
Farber-Eger
13,
J
Boston
13,
HH
Dilks
15,
G
Ehret
16,17,
CC
Gu
18,
CE
Lewis
19,
K-DH
Nguyen
16,
R
Cooper
20,
M
Leppert
21,
MR
Irvin
22,
EP
Bottinger
4,
LR
Wilkens
3,
CA
Haiman
23,
L
Park
3,
KR
Monroe
23,
I
Cheng
24,
DO
Stram
23,
CS
Carlson
1,
R
Jackson
25,
L
Kuller
26,
D
Houston
27,
C
Kooperberg
1,
S
Buyske
28,29,
LA
Hindorff
30,
DC
Crawford
13,
RJF
Loos
4,5,31,
L
Le
Marchand
3,
TC
Matise
28,
KE
North
2and
U
Peters
1OBJECTIVE:
Body mass index (BMI) is commonly used to assess obesity, which is associated with numerous diseases and negative
health outcomes. BMI has been shown to be a heritable, polygenic trait, with close to 100 loci previously identi
fi
ed and replicated in
multiple populations. We aim to replicate known BMI loci and identify novel associations in a trans-ethnic study population.
SUBJECTS:
Using eligible participants from the Population Architecture using Genomics and Epidemiology consortium, we
conducted a trans-ethnic meta-analysis of 102 514 African Americans, Hispanics, Asian/Native Hawaiian, Native Americans and
European Americans. Participants were genotyped on over 200 000 SNPs on the Illumina Metabochip custom array, or imputed into
the 1000 Genomes Project (Phase I). Linear regression of the natural log of BMI, adjusting for age, sex, study site (if applicable), and
ancestry principal components, was conducted for each race/ethnicity within each study cohort. Race/ethnicity-speci
fi
c, and
combined meta-analyses used
fi
xed-effects models.
RESULTS:
We replicated 15 of 21 BMI loci included on the Metabochip, and identi
fi
ed two novel BMI loci at 1q41 (rs2820436) and
2q31.1 (rs10930502) at the Metabochip-wide signi
fi
cance threshold (P
o
2.5 × 10
−7). Bioinformatic functional investigation of SNPs
at these loci suggests a possible impact on pathways that regulate metabolism and adipose tissue.
CONCLUSION:
Conducting studies in genetically diverse populations continues to be a valuable strategy for replicating known loci
and uncovering novel BMI associations.
International Journal of Obesity
(2018)
42,
384
–
390; doi:10.1038/ijo.2017.304
INTRODUCTION
Obesity is a heritable risk factor for a large number of serious health
conditions.
1–4It already imposes an enormous burden on the public
health system and will continue to impact the cost of medical care
through the predicted rise in diseases linked to chronic obesity.
5–7In
US ethnicities, obesity rates vary in African Americans (36.2%),
Hispanics/Latinos (31.5%), Native Americans (41.2%), European
Americans (27.9%) and Asians (9.9%).
8Body mass index (BMI)
heritability studies estimate that up to 70% of BMI variability may
be attributed to genetic factors.
9–11Although this might suggest that
genetic traits contribute to racial/ethnic differences in rates of obesity,
the relative importance of genetics compared with diet, behavior and
socioeconomic factors is under continued investigation.
12However, it
is indisputable that many minority groups have been
disproportio-nately affected by the obesity epidemic and obesity research in
minorities must remain a public health priority.
Genome-wide association studies (GWAS) in European ancestry
populations have successfully identi
fi
ed numerous genetic
var-iants associated with BMI,
fi
rmly establishing the importance of
genetic factors on obesity.
13–15However, examining genetic
associations in minority groups may reveal previously unidenti
fi
ed
BMI loci and help to pinpoint causal variants. Conducting analyses
1
Division of Public Health Sciences, Fred Hutchinson Cancer Research Center, Seattle, WA, USA;2
Department of Epidemiology, School of Public Health, University of North Carolina at Chapel Hill, Chapel Hill, NC, USA;3Cancer Research Center, University of Hawaii, Honolulu, HI, USA;4The Charles Bronfman Institute for Personalized Medicine, Icahn School of Medicine at Mount Sinai, New York, NY, USA;5
The Genetics of Obesity and Related Metabolic Traits Program, Icahn School of Medicine at Mount Sinai, New York, NY, USA;6Division of Epidemiology, Department of Medicine, Vanderbilt-Ingram Cancer Center, Vanderbilt Epidemiology Center, Vanderbilt University School of Medicine, Nashville, TN, USA;7
Masonic Cancer Center, University of Minnesota, Minneapolis, MN, USA;8
Health Science Center, University of Texas, Austin, TX, USA;9
Department of Epidemiology and Population Health, Albert Einstein College of Medicine, Bronx, NY, USA;10
Department of Biostatistics, University of Washington, Seattle, WA, USA;11
Department of Preventive Medicine, Northwestern University Feinberg School of Medicine, Chicago, IL, USA;12
Department of Biostatistics, University of North Carolina at Chapel Hill, Chapel Hill, NC, USA; 13
Center for Human Genetics Research, Vanderbilt University Medical Center, Nashville, TN, USA;14
Department of Epidemiology and Biostatistics, Institute for Computational Biology, Case Western Reserve University, Cleveland, OH, USA;15
Sarah Cannon Research Institute, Nashville, TN, USA;16
Center for Complex Disease Genomics, McKusick-Nathans Institute of Genetic Medicine, Johns Hopkins University School of Medicine, Baltimore, MD, USA;17
Division of Cardiology, Geneva University Hospital, Geneva, Switzerland; 18
Department of Biostatistics, Washington University, St Louis, MO, USA;19Department of Medicine, University of Alabama, Birmingham, AL, USA;20Preventive Medicine and Epidemiology, Loyola University, Chicago, IL, USA;21
Department of Human Genetics, University of Utah, Salt Lake City, UT, USA;22
Department of Epidemiology, University of Alabama, Birmingham, AL, USA;23Keck School of Medicine, University of Southern California, Los Angeles, CA, USA;24Cancer Prevention Institute of California, Fremont, CA, USA; 25
Department of Internal Medicine, Ohio State Medical Center, Columbus, OH, USA;26
Department of Medicine, University of Pittsburgh, Pittsburgh, PA, USA;27
Wake Forest University School of Medicine, Winston-Salem, NC, USA;28
Department of Genetics, Rutgers University, Piscataway, NJ, USA;29
Department of Statistics and Biostatistics, Rutgers University, Piscataway, NJ, USA;30
Division of Genomic Medicine, National Human Genome Research Institute, National Institutes of Health, Bethesda, MD, USA and31
The Mindich Child Health and Development Institute, Icahn School of Medicine at Mount Sinai, New York, NY, USA. Correspondence: U Peters, Fred Hutchinson Cancer Research Center, Seattle, WA, USA.
E-mail: [email protected]
height and weight. A validation study within MEC was conducted to assess the validity of these measures and showed that self-reported BMI was sometimes underestimated, but the difference was small (o1 BMI unit) compared to thefindings from national surveys.28To reduce the influence of outliers on the analysis, individuals who were underweight (BMIo18.5 kg m−2) and extremely overweight (BMI470 kg m−2) were excluded, and BMI values were natural log transformed to correct for the right-skewed distribution of BMI.
Genotyping and imputation
Genotyping was performed using the Metabochip, whose design has been described elsewhere.29In brief, the Metabochip is a custom Illumina iSelect genotyping array of ~ 200 000 SNP markers and was designed to cost-effectively analyze putative association signals identified through GWAS meta-analyses of many obesity-related metabolic and cardiovascular traits. Imputation of Metabochip SNPs was conducted in MEC African Americans and Hispanics, MSSM African Americans and Hispanics, and WHI African Americans (SHARe) and Europeans. Study-specific reference samples,30or reference samples from 1000 Genomes Phase I31were used. The programs
MaCH and minimac were used for phasing and imputation,
respectively.32–34A summary of genotyping and imputation performance for each participating study has been published previously35 and reproduced in Supplementary Table S2.
Within each race/ethnicity, related participants were identified within and between studies using PLINK.36Identity by descent was estimated and when apparentfirst-degree relative pairs were identified, the member with the lower call rate was excluded from further analyses, with the exception of GenNet, SOL and HyperGen. These studies accounted for family structure using linear mixed models (GenNet, HyperGen) or with general-ized estimated equations which incorporate clusters offirst-degree relative pairs/household members (SOL).37In the remaining studies, participants with an inbreeding coefficientF40.15 were excluded. Ancestry principal components were generated using the Eigensoft software38,39using either an unrelated subset, or in the 1000 Genomes reference populations, which were then projected into the study sample. Ancestral outliers were excluded from further analyses, as described previously.40 Additional information is included in the Supporting Information.
A total of 88 505 individuals were genotyped with the Metabochip, and an additional 14 009 with GWAS data were imputed into the 1000 Genomes Project31or study-specific reference samples.30For individuals with imputed data, only the Metabochip genetic variants were examined. Genotype data were cleaned by standard quality control procedures as described in the Supporting Information.
Analysis
As has been done in previous publications,16,41BMI values were natural log transformed to account for the right-skewed distribution. Extreme BMI values o18.5 kg m−2or470 kg m−2were excluded from the analysis, with the assumption that these outliers could be attributable to data coding errors or an underlying rare condition outside the scope of this investigation. Given that CARDIA participants were generally younger, and young adults may have naturally low BMI measurements, the 18.5 kg m−2 exclusion criteria was waived for this cohort. The analyses were restricted to adults 20 years or older.
The population was stratified by study and self-identified race/ethnicity, with each subgroup analyzed separately. Multivariable linear regressions for each study-specific minority group were adjusted for age, sex, study site (if applicable) and ancestry principal components (Supplementary Table S2). A sex × age interaction term was included in all models (except WHI, which only includes women) to account for possible effect modification by sex. The sex × age interaction term was intended to account for potential sex-specific effects on BMI that vary by sex and age, given that obesity risk and body composition are known to vary by age, and our study population includes both elderly participants and young adults older than 20 years of age. The results from each ethnicity, and for all ethnicities combined, were meta-analyzed using an inverse-variance weightedfixed-effects model in METAL.42No inflation was observed in this meta-analysis (inflation factorλ= 0.97).
The SNP with the smallestP-value within a locus was considered the lead SNP. BMI associations were considered statistically significant if the
P-value surpassed the Bonferroni corrected threshold of significance (Po2.5 × 10−7), correcting for ~ 200 000 SNPs included on the Metabochip array. The locus was considered novel if the lead SNP was not in LD
in
underrepresented
minority
populations
has
been
shown
to
improve
the
statistical
power
to
detect
novel
loci
by
increasing
allele
frequency
and
the
variance
of
allele
counts
for
some
genetic
variants.
16–18A
recent
fi
ne-mapping
study
in
African
Americans
bene
fi
tted
from
the
lower
linkage
disequilibrium
(LD)
patterns
when
identifying
independent
signals
in
known
BMI
loci,
and
also
found
two
novel
loci,
presumably
aided
by
the
gain
in
power
owing
to
the
higher
minor
allele
frequencies
of
these
variants
in
those
with
African
genetic
ancestry.
16GWAS
restricted
to
minority
populations
have
had
similar
successes,
uncovering
additional
BMI
loci
previously
unidenti
fi
ed
in
studies
of
exclusively
European
ancestry.
19–23To
date,
the
largest
and
most
comprehensive
BMI
GWAS
included
individuals
of
both
European
and
non-European
descent,
con
fi
rmed
41
known
loci.
and
found
56
novel
BMI-associated
loci.
24The
results
from
these
studies
highlights
the
feasibility
and
bene
fi
ts
of
using
diverse
human
populations
as
a
strategy
to
broaden
our
knowledge
of
BMI
genetics.
To
identify
additional
BMI
loci,
we
leveraged
the
multiethnic
design
of
the
Population
Architecture
using
Genomics
and
Epidemiology
(PAGE)
consortium
to
conduct
a
discovery
meta-analysis
in
up
to
102
514
individuals.
Using
this
approach,
we
identi
fi
ed
two
novel
BMI-associated
loci,
rs2820436
(1q41)
and
rs10930502
(2q31.1).
MATERIALS
AND
METHODS
Study
population
ThePAGEconsortiumisfundedbytheNationalHumanGenomeResearch Institutetoinvestigate the epidemiologicarchitectureof well-replicated geneticvariantsassociatedwith humandiseases ortraits.25 ThePAGE-I study, initiated in 2008, consists of a coordinating center and four consortia,eachwithaccesstolarge,diversepopulation-basedstudies.The four consortia are: Epidemiologic Architecture for Genes Linked to Environment(EAGLE),whichisbasedondatafromVanderbiltUniversity Medical Center's biorepository linked to de-identified electronichealth records(EAGLE-BioVU);theMultiethnicCohortStudy(MEC);theWomen's HealthInitiative(WHI);andCausalVariantsAcrosstheLifeCourse(CALiCO), aconsortium offivecohortstudies:theAtherosclerosisRiskin Commu-nities(ARIC)study, CoronaryArtery Risk Developmentin Young Adults (CARDIA),theCardiovascularHealthStudy(CHS),theHispanicCommunity HealthStudy/StudyofLatinos(SOL)and theStrong HeartStudy.25The PAGE-IIstudy,initiatedin2013,addedtheCharlesBronfmanInstitutefor Personalized Medicine at Mount Sinai Medical Center, BioMe BioBank (MSSM).Forspecificanalysesinthispaper,PAGEreachedouttoadditional studies,including GenNetand the HypertensionGenetic Epidemiology Network(HyperGen) toincreasethe AfricanAmerican samplesize.The SupportingInformationincludesdetaileddescriptionsofeachstudy.
AfricanAmerican,Hispanic,Asian/NativeHawaiian,NativeAmericanand Europeanparticipants fromthe ARIC,EAGLE-BioVU, CHS,CARDIA,MEC, MSSM,SOL,WHI,GenNetandHyperGenwereeligibleforinclusioninthis study(SupplementaryTableS1).Race/ethnicitywasself-reportedinmost studiesexceptforEAGLE-BioVU,whererace/ethnicitywas administratively-reportedandrecordedintheelectronichealthrecord.26,27Allstudieswere approvedbyInstitutionalReviewBoardsattheirrespectivesites,andall study participants save EAGLE-BioVU provided informed consent. The Vanderbilt University Internal Review Board has determined that data containedwithinEAGLE-BioVUareconsideredlimiteddatasetsasdefined bytheHealthInsurancePortabilityandAccountabilityAct(HIPAA)andare inaccordancewithprovisionsofTitle45,CodeofFederalRegulations,part 46(45CFR46)thatdefinecriteriafor'non-humansubjects'research.
The final sample of minorities from PAGE included 35,606 African American,26048 Hispanic/Latino,22466Asian/NativeHawaiian,17859 EuropeanAmericanand535NativeAmericanparticipants(Supplementary TableS1).
Anthropometric
measurements
(r2
o0.1 in any 1000 Genomes population) with a previously published known BMI loci. The list of known BMI loci was obtained by extracting records from the GWAS Catalog of the National Human Genome Research Institute (http://www.ebi.ac.uk/gwas/, accessed 26 April 2016) and through a literature search (April 2017) identifying publications based on high-throughput genotyping arrays that are not genome-wide (and thus, excluded from the GWAS Catalog),16 BMI studies examining GxE associations,43,44 and internal publications from collaborators that we expect to be published within the next year (Turcot V, in progress). Bioinformatic functional follow-up was performed for the most significant index SNP and all SNPs in high LD with the index SNP (r2⩾0.8 in African 1000 Genomes Population). HaploReg v445and the UCSC Genome Browser from the Roadmap epigenomics project were used to assess whether variants in each of these loci were positioned in a putative enhancer or promoter specific to adipose tissue. GTEx expression data were also used to assess whether any of the loci overlapped eQTL results.
RESULTS
The Metabochip array contains high density genetic variants at 21
previously published GWAS-identi
fi
ed BMI loci. We
fi
rst assessed
these known loci to evaluate the reproducibility of these loci in a
multiethnic study population. Our study con
fi
rmed 15 of the 21
previously known BMI loci, signi
fi
cant at
P
o
5.8 × 10
−5, an
approximate Bonferroni multiple testing correction for the
average 866 SNPs at each BMI locus (Supplementary Table S3).
Among the Metabochip previously known BMI loci that failed to
replicate, the meta-analysis p-values approached signi
fi
cance, with
most in the 10
−4range.
When we examined the remaining Metabochip content, we
found an additional 14 loci associated with BMI, which achieved a
Metabochip-wide signi
fi
cance level of
P
o
2.5 × 10
−7, correcting
for ~ 200 000 SNPs on the Metabochip array (Supplementary
Table S4). Eleven of these loci (or SNPs in high LD,
r
24
0.8, with
these loci) were in LD (r
24
0.1 in any 1000 Genomes population)
with BMI loci previously identi
fi
ed since the development of the
Metabochip.
14,21–24,46–49A twelfth SNP (rs11927381) no longer
achieved Metabochip-wide signi
fi
cance after conditioning on a
nearby SNP (rs1516725) that had previously been associated with
BMI.
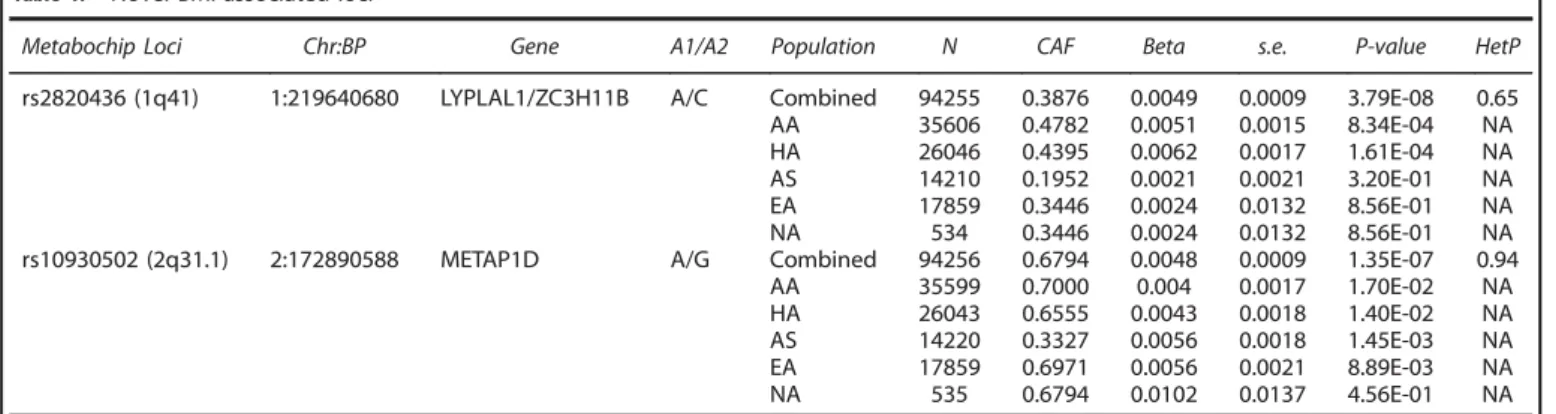
24Thus, we discovered two novel BMI-associated loci: 1q41
(rs2820436) and 2q31.1 (rs10930502) (Table 1). No evidence of
heterogeneity was observed across studies at these two loci, with
Cochran
’
s Q heterogeneity p-values of 0.65 and 0.94, for
rs2820436 and rs10930502, respectively (Table 1, Figure 1).
The minor allele frequencies of these SNPs differed across the
different ethnic groups (Table 1). rs2820436 was most frequent
among PAGE African Americans (CAF = 0.48), and least frequent in
Asians (CAF = 0.20), with the strongest association seen in the
African Americans (P
= 8.34E-04) and Hispanic/Latinos (P
=
1.61E--04). Although rs10930502 was also most frequent among African
Americans (CAF = 0.70) and European Americans (CAF = 0.70), and
least frequent among Asians (CAF = 0.33), the association was
strongest among the Asians (P
= 1.45E-03) and European
Amer-icans (P
= 8.89E-03). Generally, the observed allele frequencies in
our own study population were similar to those from the same
ethnic groups in the 1000 Genomes populations. Both of these
SNPs were analyzed in the most recent and largest BMI GWAS
study to date (P
(rs2820436)= 1.02E-02;
P
(rs10930502)= 2.91E-04),
24and
were directionally consistent with our own results, providing
additional support for these variants.
The variant rs10930502 was included on the Metabochip to
follow-up on signi
fi
cant and suggestive signals from the largest
available GWAS meta-analysis on BMI, whereas rs2820436 was
included on the array for
fi
ne-mapping regions associated with
waist-to-hip ratio (WHR). Given that rs2820436 was included on
the Metabochip due to its previously published association with a
non-BMI trait, we evaluated whether the associations with BMI
were independent using individuals where WHR data were
available (n
= 53 481). When the association between rs2820436
and BMI was adjusted by WHR, the overall association did not
noticeably change. Conversely, when the association between
rs2820436 and WHR was examined, adjusting for BMI, this
P-value
also achieved Metabochip-wide Bonferroni signi
fi
cance (P
= 3.09
E-10). These
fi
ndings suggest that this loci may in
fl
uence multiple
phenotypes related to body composition.
Functional investigation of the SNPs supports their likely
involvement in lipid metabolism. We found that rs2820436
strongly tagged (r
2= 0.94 in 1000 Genomes Phase I Africans) a
putative enhancer variant, rs2605096, positioned in an eQTL for
the gene lysophospholipase-like 1 (LYPLAL1)
previously associated
with adiponectin,
50adiposity,
51cholesterol, T2D and WHR.
52Although rs10930502 was positioned in an eQTL for a lincRNA
in adipose tissue, it did not strongly tag a putative regulatory
variant. However, it was in moderate LD (r
2= 0.48,
D
’
= 0.85 in 1000
Genomes Phase I Africans) with variant rs34636594 at 2q31.1,
which was positioned in a transcription factor-binding enhancer in
adipose tissue. LincRNAs are highly tissue speci
fi
c and typically
co-expressed with neighboring genes and thus we hypothesize that
the 2q31.1 association may exert its effects on the candidate gene
SLC25A12, through regulation of lincRNA.
DISCUSSION
This trans-ethnic meta-analysis replicated 15 of 21 previously
known BMI loci included on the Metabochip. Of the six loci that
did not reach statistical signi
fi
cance in our own study, two of these
had lead SNPs that were very rare, with CAF
o
0.01 in 1000
Genomes populations and PAGE racial/ethnic subgroups. As most
Table 1.
Novel BMI-associated lociMetabochip Loci Chr:BP Gene A1/A2 Population N CAF Beta s.e. P-value HetP
rs2820436 (1q41) 1:219640680 LYPLAL1/ZC3H11B A/C Combined 94255 0.3876 0.0049 0.0009 3.79E-08 0.65 AA 35606 0.4782 0.0051 0.0015 8.34E-04 NA HA 26046 0.4395 0.0062 0.0017 1.61E-04 NA AS 14210 0.1952 0.0021 0.0021 3.20E-01 NA EA 17859 0.3446 0.0024 0.0132 8.56E-01 NA NA 534 0.3446 0.0024 0.0132 8.56E-01 NA rs10930502 (2q31.1) 2:172890588 METAP1D A/G Combined 94256 0.6794 0.0048 0.0009 1.35E-07 0.94 AA 35599 0.7000 0.004 0.0017 1.70E-02 NA HA 26043 0.6555 0.0043 0.0018 1.40E-02 NA AS 14220 0.3327 0.0056 0.0018 1.45E-03 NA EA 17859 0.6971 0.0056 0.0021 8.89E-03 NA NA 535 0.6794 0.0102 0.0137 4.56E-01 NA
those with European ancestry, but in high LD with the causal SNPs
in those with non-European ancestry. This would cause the
association to be weaker or non-signi
fi
cant in Europeans owing to
exposure misclassi
fi
cation, where the tag SNP is an inaccurate
indicator for the presence of the causal SNP. Given that the
Metabochip was designed to facilitate
fi
ne-mapping in
non-Europeans, it is not surprising that some of the Metabochip tag
SNPs may perform better at estimating causal
genotype-phenotype associations in a predominantly non-European study
population.
Our
fi
ndings demonstrate the value of conducting GWAS in
non-European populations, both when replicating
fi
ndings
pre-viously discovered in large, often European-centric GWAS, and for
discovering novel associations which may be population-speci
fi
c,
or have stronger effects in those with non-European ancestry.
Finally, the functional
fi
ndings provide additional evidence for the
biological relevance of these new loci in the BMI phenotype,
which warrant further investigation. Although these results are
intriguing, additional replication is needed, especially using study
populations that include underrepresented individuals. Both of
these SNPs are most frequent in those with African ancestry, and
our association in rs10930502 appears to be the strong in those
with Asian ancestry.
Many genetic studies of BMI with larger sample sizes have been
published and comparatively, we were underpowered to detect
and replicate weaker associations, especially in less-frequent
variants. It is possible that additional novel, or
population-speci
fi
c loci may be found in a larger, trans-ethnic study
population. However, we assembled one of the largest and most
diverse non-European study populations and were still able to
con
fi
rm 15 of the 21 known BMI loci included on the Metabochip.
Although the Metabochip was designed to replicate and
fi
ne-map
Figure 1.
Combined and study-speci
fi
c associations in novel BMI-associated loci. AA
=
African American, HA
=
Hispanic American, PI
=
Paci
fi
c
Islander, ARIC
=
Atherosclerosis Risk in Communities Study, WHI
=
Women
’
s Health Initiative, MEC
=
Multiethnic Cohort, CHS
=
Cardiovascular
Health Study, SHARe
=
WHI SNP Health Association Resource, GenNET
=
GenNet study, HyperGEN
=
Hypertension Genetic Epidemiology
Network, CARDIA
=
Coronary Artery Risk Development in Young Adults study, EAG-BioVUE
=
Epidemiologic Architecture for Genes Linked to
Environment accessing Vanderbilt University Medical Center BioVU, MSSM
=
The Charles Bronfman Institute for Personalized Medicine at
Mount Sinai Medical Center, BioMe BioBank, SOL
=
The Hispanic Community Health Study / Study of Latinos.
of
these
loci
were
originally
discovered
in
GWAS
studies
with
much
larger
sample
sizes,
13–15,24,53–55our
smaller
study
was
likely
insuf
fi
ciently
powered
to
replicate
the
rarer
variants
(Supporting
Information).
Other
loci
that
we
failed
to
replicate
had
lead
SNPs
that
were
more
frequent
in
Europeans
than
in
non-Europeans.
Given
that
only
17%
of
our
study
sample
consisted
of
those
with
European
ancestry,
insuf
fi
cient
power
may
also
have
contributed
to
our
inability
to
replicate
some
of
these
loci,
especially
if
these
were
European-speci
fi
c
associations.
Interestingly,
both
of
the
novel
loci
we
identi
fi
ed,
rs2820436
(1q41)
and
rs10930502
(2q31.1),
are
common
in
those
with
European
ancestry,
with
a
frequency
of
0.68
and
0.31
in
1000
Genomes
Europeans,
respectively.
Previous
large,
European-based
BMI
GWAS
studies
may
have
failed
to
detect
these
associations
due
to
population-speci
fi
c
GxG
interactions,
or
GxE
interactions
linked
to
cultural,
socioeconomic,
or
behavior
risk
factors,
resulting
in
a
more
pronounced
effect
on
BMI
in
minority
groups
compared
with
Europeans.
For
both
novel
SNPs
reported
here,
the
largest
betas
in
our
study
occurred
in
a
non-European
subgroup,
suggesting
that
the
genotypes
might
have
a
greater
effect
on
BMI
among
non-Europeans
(Supplementary
Table
S5).
Should
non-European
population-speci
fi
c
effects
exist,
our
large
sample
of
minority
subjects
may
have
yielded
more
power
to
detect
those
associations
compared
to
previous
GWAS
studies
that
may
have
been
underpowered
to
detect
population-speci
fi
c
effects
related
to
a
certain
minority
group.
obtained from dbGaP under accession phs000227. A full listing of WHI investigators can be found at: http://www.whiscience.org/publications/WHI_investigators_shortlist.pdf. Funding support for the Genetic Epidemiology of Causal Variants Across the Life Course (CALiCo) program was provided through the NHGRI PAGE program (U01HG007416, U01HG004803 and its NHGRI ARRA supplement). The following CALiCo studies contributed to this manuscript and are funded by the following agencies: The Atherosclerosis Risk in Communities Study (ARIC) is carried out as a collaborative study supported by National Heart, Lung, and Blood Institute contracts (HHSN268201100005C, HHSN268201100006C, HHSN268201100007C, HHSN2682011 00008C, HHSN268201100009C, HHSN268201100010C, HHSN268201100011C and HHSN268201100012C), R01HL087641, R01HL59367 and R01HL086694; National Human Genome Research Institute contract U01HG004402; and National Institutes of Health contract HHSN268200625226C. The authors thank the staff and participants of the ARIC study for their important contributions. Infrastructure was partly supported by Grant Number UL1RR025005, a component of the National Institutes of Health and NIH Roadmap for Medical Research. The Coronary Artery Risk Development in Young Adults (CARDIA) study is supported by the following National Institutes of Health, National Heart, Lung and Blood Institute contracts: 95095; 48047; 48048; 48049; 48050; N01-HC--45134; N01-HC-05187; and N01-HC-45205. CARDIA is conducted and supported by the National Heart, Lung, and Blood Institute in collaboration with the University of Alabama at Birmingham (HHSN268201300025C & HHSN268201300026C), Northwestern University (HHSN268201300027C), University of Minnesota (HHSN268201300028C), Kaiser Foundation Research Institute (HHSN268201300029C) and Johns Hopkins University School of Medicine (HHSN268200900041C). CARDIA is also partially supported by the Intramural Research Program of the National Institute on Aging. The Hispanic Community Health Study/Study of Latinos (SOL) was carried out as a collaborative study supported by contracts from the National Heart, Lung, and Blood Institute (NHLBI) to the University of North Carolina (N01-HC65233), University of Miami HC65234), Albert Einstein College of Medicine (N01-HC65235), Northwestern University (N01-HC65236), and San Diego State University (N01-HC65237). Additional support was provided by 1R01DK101855-01 and 13GRNT16490017. The following Institutes/Centers/Offices contribute to the HCHS/ SOL through a transfer of funds to the NHLBI: National Center on Minority Health and Health Disparities, the National Institute of Deafness and Other Communications Disorders, the National Institute of Dental and Craniofacial Research, the National Institute of Diabetes and Digestive and Kidney Diseases, the National Institute of Neurological Disorders and Stroke, and the Office of Dietary Supplements. The Cardiovascular Health Study (CHS) is supported by contracts HHSN268201200036C, HHSN268200800007C, N01 HC55222, N01HC85079, N01HC85080, N01HC85081, N01HC85082, N01HC85083, N01HC85086, and grants HL080295 and HL087652 from the National Heart, Lung, and Blood Institute (NHLBI), with additional contribution from the National Institute of Neurological Disorders and Stroke (NINDS). Additional support was provided by AG023629 from the National Institute on Aging (NIA). A full list of principal CHS investigators and institutions can be found at http://www.chs-nhlbi.org/PI.htm. CHS GWAS DNA handling and genotyping at Cedars-Sinai Medical Center was supported in part by the National Center for Research Resources, grant UL1RR033176, and is now at the National Center for Advancing Translational Sciences, CTSI grant UL1TR000124; in addition, the National Institute of Diabetes and Digestive and Kidney Diseases grant DK063491 to the Southern California Diabetes Endocrinology Research Center. The Strong Heart Study (SHS) is supported by NHLBI grants U01 HL65520, U01 HL41642, U01 HL41652, U01 HL41654, U01 HL65521 and R01 HL109301. The data sets used for the analyses described in this manuscript were obtained from dbGaP under accession phs000223 (ARIC), phs000236, (CARDIA), phs000301 (CHS), phs000555 (HCHS/SOL). The opinions expressed in this paper are those of the author(s) and do not necessarily reflect the views of the Indian Health Service. GenNet is one of four networks in the Family Blood Pressure Program, established in 1995 and supported by a series of agreements with the NIH National Heart, Lung and Blood Institute. Samples and data from The Charles Bronfman Institute for Personalized Medicine (IPM) BioMe Biobank used in this study were provided by The Charles Bronfman Institute for Personalized Medicine at the Icahn School of Medicine at Mount Sinai (New York). Phenotype data collection was supported by The Andrea and Charles Bronfman Philanthropies. Funding support for the Population Architecture Using Genomics and Epidemiology (PAGE) IPM BioMe Biobank study was provided through the National Human Genome Research Institute (U01HG007417). The data sets used for the analyses described in this manuscript were obtained from dbGaP under accession phs000925. The Hypertension Genetic Epidemiology Network (HyperGEN) study was supported by National Heart, Lung and Blood Institute contracts HL086694 and HL055673. Assistance with phenotype harmonization, SNP selection and annotation, data cleaning, data management, integration and dissemination, and general study coordination was provided by the PAGE Coordinating Center (U01HG007419, U01HG004801-01 and its NHGRI ARRA supplement). The National Institutes of Mental Health also contributes to the support for the Coordinating Center. We gratefully acknowledge Dr Ben Voight for sharing the Metabochip SNP LD and minor allele frequency statistics estimated in the Malmö
loci
known
to
be
associated
with
23
disease-related
traits,
its
content
is
not
genome-wide
and
non-Metabochip
loci
were
not
evaluated
in
this
study.
Yet,
the
inclusion
of
strong
and
well-established
metabolically-related
loci
allowed
us
to
identify
a
potential
pleiotropic
association
with
WHR.
Studies
that
replicate
our
fi
ndings
are
advised
to
isolate
the
association
that
contributes
speci
fi
cally
to
BMI,
given
that
our
associations
with
BMI
remain
signi
fi
cant
after
adjusting
for
WHR.
Through
accompanying
research
efforts,
we
will
bene
fi
t
from
the
Metabochip
’
s
increased
marker
density
to
fi
ne-map
these
associations
and
further
describe
the
relationship
between
these
loci,
BMI
and
related
phenotypes.
35Certainly,
there
are
challenges
associated
with
multiethnic
genetic
studies,
but
there
are
also
legitimate
bene
fi
ts,
which
may
help
explain
more
of
the
BMI
heritability.
The
dearth
of
studies
that
include
underrepresented
populations
only
sustains
dispa-rities
in
genetic
research,
inhibits
our
ability
to
identify
population-speci
fi
c
genetic
risk
factors,
and
hinders
the
development
and
application
of
genetic
fi
ndings
in
real-world
clinical
settings.
56–58Our
fi
ndings
are
promising
and
perhaps
more
importantly,
demonstrate
the
need
to
conduct
additional
genetic
studies
of
complex
traits
in
non-European
individuals.
CONFLICT
OF
INTEREST
Theauthorsdeclarenoconflictofinterest.
ACKNOWLEDGEMENTS
Diet and Cancer Study. The PAGE consortium thanks the staff and participants of all PAGE studies for their important contributions.
REFERENCES
1 Calle EE, Kaaks R. Overweight, obesity and cancer: epidemiological evidence and proposed mechanisms.Nat Rev Cancer2004;4: 579–591.
2 Kopelman PG. Obesity as a medical problem.Nature2000;404: 635–643. 3 Miller WM, Nori-Janosz KE, Lillystone M, Yanez J, McCullough PA. Obesity
and lipids.Curr Cardiol Rep2005;7: 465–470.
4 Vucenik I, Stains JP. Obesity and cancer risk: evidence, mechanisms, and recom-mendations.Ann N Y Acad Sci2012;1271: 37–43.
5 Cawley J, Meyerhoefer C. The medical care costs of obesity: an instrumental variables approach.J Health Econ2012;31: 219–230.
6 Danaei G, Ding EL, Mozaffarian D, Taylor B, Rehm J, Murray CJet al.The pre-ventable causes of death in the United States: comparative risk assessment of dietary, lifestyle, and metabolic risk factors.PLoS Med2009;6: e1000058. 7 Olshansky SJ, Passaro DJ, Hershow RC, Layden J, Carnes BA, Brody Jet al.A
potential decline in life expectancy in the United States in the 21st century.N Engl
J Med2005;352: 1138–1145.
8 Blackwell DL, Lucas JW, Clarke TC. Summary health statistics for U.S. adults: national health interview survey 2012.Vital Health Stat 102014; 1–161. 9 Hjelmborg J, Fagnani C, Silventoinen K, McGue M, Korkeila M, Christensen Ket al.
Genetic influences on growth traits of BMI: a longitudinal study of adult twins.
Obesity (Silver Spring)2008;16: 847–852.
10 Maes HH, Neale MC, Eaves LJ. Genetic and environmental factors in relative body weight and human adiposity.Behav Genet1997;27: 325–351.
11 Stunkard AJ, Foch TT, Hrubec Z. A twin study of human obesity.JAMA1986;256: 51–54.
12 McAllister EJ, Dhurandhar NV, Keith SW, Aronne LJ, Barger J, Baskin Met al.Ten putative contributors to the obesity epidemic.Crit Rev Food Sci Nutr2009;49: 868–913.
13 Berndt SI, Gustafsson S, Magi R, Ganna A, Wheeler E, Feitosa MFet al. Genome-wide meta-analysis identifies 11 new loci for anthropometric traits and provides insights into genetic architecture.Nat Genet2013;45: 501–512.
14 Speliotes EK, Willer CJ, Berndt SI, Monda KL, Thorleifsson G, Jackson AUet al.
Association analyses of 249,796 individuals reveal 18 new loci associated with body mass index.Nat Genet2010;42: 937–948.
15 Willer CJ, Speliotes EK, Loos RJ, Li S, Lindgren CM, Heid IMet al.Six new loci associated with body mass index highlight a neuronal influence on body weight regulation.Nat Genet2009;41: 25–34.
16 Gong J, Schumacher F, Lim U, Hindorff LA, Haessler J, Buyske Set al.Fine Mapping and Identification of BMI Loci in African Americans.Am J Hum Genet2013;93: 661–671.
17 Pulit SL, Voight BF, de Bakker PI. Multiethnic genetic association studies improve power for locus discovery.PLoS One2010;5: e12600.
18 Zhang J, Stram DO. The role of local ancestry adjustment in association studies using admixed populations.Genet Epidemiol2014;38: 502–515.
19 Guo Y, Lanktree MB, Taylor KC, Hakonarson H, Lange LA, Keating BJet al. Gene-centric meta-analyses of 108 912 individuals confirm known body mass index loci and reveal three novel signals.Hum Mol Genet2013;22: 184–201.
20 Monda KL, Chen GK, Taylor KC, Palmer C, Edwards TL, Lange LAet al.A meta-analysis identifies new loci associated with body mass index in individuals of African ancestry.Nat Genet2013;45: 690–696.
21 Okada Y, Kubo M, Ohmiya H, Takahashi A, Kumasaka N, Hosono Net al.Common variants at CDKAL1 and KLF9 are associated with body mass index in east Asian populations.Nat Genet2012;44: 302–306.
22 Wen W, Cho YS, Zheng W, Dorajoo R, Kato N, Qi Let al.Meta-analysis identifies common variants associated with body mass index in east Asians.Nat Genet2012;
44: 307–311.
23 Wen W, Zheng W, Okada Y, Takeuchi F, Tabara Y, Hwang JYet al.Meta-analysis of genome-wide association studies in East Asian-ancestry populations identifies four new loci for body mass index.Hum Mol Genet2014;23: 5492–5504. 24 Locke AE, Kahali B, Berndt SI, Justice AE, Pers TH, Day FRet al.Genetic studies of
body mass index yield new insights for obesity biology. Nature2015; 518: 197–206.
25 Matise TC, Ambite JL, Buyske S, Carlson CS, Cole SA, Crawford DCet al.The Next PAGE in understanding complex traits: design for the analysis of Population Architecture Using Genetics and Epidemiology (PAGE) Study.Am J Epidemiol
2011;174: 849–859.
26 Dumitrescu L, Ritchie MD, Brown-Gentry K, Pulley JM, Basford M, Denny JCet al.
Assessing the accuracy of observer-reported ancestry in a biorepository linked to electronic medical records.Genet Med2010;12: 648–650.
27 Hall JB, Dumitrescu L, Dilks HH, Crawford DC, Bush WS. Accuracy of administratively-assigned ancestry for diverse populations in an electronic med-ical record-linked biobank.PLoS One2014;9: e99161.
28 Connor Gorber S, Tremblay MS. The bias in self-reported obesity from 1976 to 2005: a Canada-US comparison.Obesity (Silver Spring)2010;18: 354–361. 29 Voight BF, Kang HM, Ding J, Palmer CD, Sidore C, Chines PSet al.The metabochip,
a custom genotyping array for genetic studies of metabolic, cardiovascular, and anthropometric traits.PLoS Genet2012;8: e1002793.
30 Liu EY, Buyske S, Aragaki AK, Peters U, Boerwinkle E, Carlson Cet al.Genotype imputation of Metabochip SNPs using a study-specific reference panel of ~ 4,000 haplotypes in African Americans from the Women's Health Initiative.Genet
Epi-demiol2012;36: 107–117.
31 Genomes Project C, Abecasis GR, Auton A, Brooks LD, DePristo MA, Durbin RM
et al.An integrated map of genetic variation from 1,092 human genomes.Nature
2012;491: 56–65.
32 Li Y, Willer C, Sanna S, Abecasis G. Genotype imputation.Annu Rev Genomics Hum
Genet2009;10: 387–406.
33 Li Y, Willer CJ, Ding J, Scheet P, Abecasis GR. MaCH: using sequence and genotype data to estimate haplotypes and unobserved genotypes.Genet Epidemiol2010;
34: 816–834.
34 Howie B, Fuchsberger C, Stephens M, Marchini J, Abecasis GR. Fast and accurate genotype imputation in genome-wide association studies through pre-phasing.
Nat Genet2012;44: 955–959.
35 Fernandez-Rhodes L, Gong J, Haessler J, Franceschini N, Graff M, Nishimura KK
et al.Trans-ethnicfine-mapping of genetic loci for body mass index in the diverse
ancestral populations of the Population Architecture using Genomics and Epi-demiology (PAGE) Study reveals evidence for multiple signals at established loci.
Hum Genet2017;136: 771–800.
36 Purcell S, Neale B, Todd-Brown K, Thomas L, Ferreira MA, Bender Det al.PLINK: a tool set for whole-genome association and population-based linkage analyses.
Am J Hum Genet2007;81: 559–575.
37 Lin DY, Tao R, Kalsbeek WD, Zeng D, Gonzalez F 2nd, Fernandez-Rhodes Let al.
Genetic association analysis under complex survey sampling: the Hispanic Com-munity Health Study/Study of Latinos.Am J Hum Genet2014;95: 675–688. 38 Patterson N, Price AL, Reich D. Population structure and eigenanalysis.PLoS Genet
2006;2: e190.
39 Price AL, Patterson NJ, Plenge RM, Weinblatt ME, Shadick NA, Reich D. Principal components analysis corrects for stratification in genome-wide association stu-dies.Nat Genet2006;38: 904–909.
40 Buyske S, Wu Y, Carty CL, Cheng I, Assimes TL, Dumitrescu Let al.Evaluation of the metabochip genotyping array in African Americans and implications forfine mapping of GWAS-identified loci: the PAGE study.PLoS One2012;7: e35651. 41 Fesinmeyer MD, North KE, Ritchie MD, Lim U, Franceschini N, Wilkens LRet al.
Genetic risk factors for BMI and obesity in an ethnically diverse population: results from the population architecture using genomics and epidemiology (PAGE) study.Obesity (Silver Spring)2013;21: 835–846.
42 Willer CJ, Li Y, Abecasis GR. METAL: fast and efficient meta-analysis of genome-wide association scans.Bioinformatics2010;26: 2190–2191.
43 Justice AE, Winkler TW, Feitosa MF, Graff M, Fisher VA, Young Ket al. Genome-wide meta-analysis of 241,258 adults accounting for smoking behaviour identifies novel loci for obesity traits.Nat Commun2017;8: 14977.
44 Graff M, Scott RA, Justice AE, Young KL, Feitosa MF, Barata Let al.Genome-wide physical activity interactions in adiposity - A meta-analysis of 200,452 adults.PLoS
Genet2017;13: e1006528.
45 Ward LD, Kellis M. HaploReg: a resource for exploring chromatin states, con-servation, and regulatory motif alterations within sets of genetically linked var-iants.Nucleic Acids Res2012;40: D930–D934.
46 Melen E, Granell R, Kogevinas M, Strachan D, Gonzalez JR, Wjst Met al. Genome-wide association study of body mass index in 23 000 individuals with and without asthma.Clin Exp Allergy2013;43: 463–474.
47 Stergiakouli E, Gaillard R, Tavare JM, Balthasar N, Loos RJ, Taal HRet al. Genome-wide association study of height-adjusted BMI in childhood identifies functional variant in ADCY3.Obesity (Silver Spring)2014;22: 2252–2259.
48 Warrington NM, Howe LD, Paternoster L, Kaakinen M, Herrala S, Huikari Vet al.A genome-wide association study of body mass index across early life and child-hood.Int J Epidemiol2015;44: 700–712.
49 Winkler TW, Justice AE, Graff M, Barata L, Feitosa MF, Chu Set al.The Influence of Age and Sex on Genetic Associations with Adult Body Size and Shape: A Large-Scale Genome-Wide Interaction Study.PLoS Genet2015;11: e1005378. 50 Dastani Z, Hivert MF, Timpson N, Perry JR, Yuan X, Scott RAet al.Novel loci for
adiponectin levels and their influence on type 2 diabetes and metabolic traits: a multi-ethnic meta-analysis of 45,891 individuals.PLoS Genet2012;8: e1002607. 51 Lindgren CM, Heid IM, Randall JC, Lamina C, Steinthorsdottir V, Qi Let al.
52 Heid IM, Jackson AU, Randall JC, Winkler TW, Qi L, Steinthorsdottir Vet al. Meta-analysis identifies 13 new loci associated with waist-hip ratio and reveals sexual dimorphism in the genetic basis of fat distribution.Nat Genet2010;42: 949–960. 53 Thorleifsson G, Walters GB, Gudbjartsson DF, Steinthorsdottir V, Sulem P, Helga-dottir Aet al.Genome-wide association yields new sequence variants at seven loci that associate with measures of obesity.Nat Genet2009;41: 18–24. 54 Graff M, Ngwa JS, Workalemahu T, Homuth G, Schipf S, Teumer Aet al.
Genome-wide analysis of BMI in adolescents and young adults reveals additional insight into the effects of genetic loci over the life course.Hum Mol Genet2013;22: 3597–3607.
55 Elks CE, Perry JR, Sulem P, Chasman DI, Franceschini N, He Cet al.Thirty new loci for age at menarche identified by a meta-analysis of genome-wide association studies.Nat Genet2010;42: 1077–1085.
56 Bustamante CD, Burchard EG, De la Vega FM. Genomics for the world.Nature
2011;475: 163–165.
57 Rosenberg NA, Huang L, Jewett EM, Szpiech ZA, Jankovic I, Boehnke M. Genome-wide association studies in diverse populations.Nat Rev Genet2010;11: 356–366. 58 Haga SB. Impact of limited population diversity of genome-wide association
studies.Genet Med2010;12: 81–84.