Towards Developing An Intergrated Maturity Model Framework For
Managing An Enterprise Business Intelligence
Chuah M.H
1and Wong K.L
21
Universiti Tunku Abdul Rahman, Malaysia, [email protected] 2
Universiti Tunku Abdul Rahman, Malaysia, [email protected]
ABSTRACT
There has been a great deal of recent interest that is driving research and development in the area of Business Intelligence (BI), but the issues regarding the implementation of enterprise scale of BI is still concern among BI academics and practitioners. Therefore, an Enterprise Business Intelligence Maturity Model (EBI2M) is proposed to serve as useful guideline for enterprises which are planning or undertaking large scale BI initiatives. In this paper, the author utilizes a Delphi study to conduct two stages of enquiries with a panel of BI experts, and then refines the research into a preliminary EBI2M model.
Keywords: Business Intelligence (BI), maturity model
I INTRODUCTION
Due to competitive environment, numerous of companies have started to implement Business Intelligence (BI). BI is important as it can provide the statistics overview to let manager to get insight business performance in systematic manner. BI serves as ‘black box’, where data is transformed into useful information and this useful information is turned to new knowledge that finally delivers to the top manager for the decision making.
Although BI is important, many of companies still struggle to implement this. Lupu et.al (1997) reported that about 60%-70% of business intelligence applications fail due to the technology, organizational, cultural and infrastructure issues. . Furthermore, EMC Corporation argued that many BI initiatives have failed because tools weren’t accessible through to end users and the result of not meeting the end users’ need effectively. Computerworld (2003) stated that BI projects fail because of failure to recognize BI projects as cross organizational business initiatives, unengaged business sponsors, unavailable or unwilling business representatives, lack of skilled and available staff, no business analysis activities, no appreciation of the impact of dirty data on business profitability and no understanding of the necessity for and the use of metadata.
Hence, Business Intelligence Maturity Model is needed to provide step by step guidelines to help the companies to implement BI. Section below illustrates the various Business Intelligence Maturity Models defined by various academics and practitioners.
II MATURITY MODEL
Maturity model can be used to benchmark certain project or practices and further recommend to an organization to improve on certain areas so that whole projects can be carried by an organization effectively (Kohlegger et.al, 2009; Rosemann and Bruin, 2005). Maturity model can applied in various disciplines such as software development, knowledge management, performance measurement, data management and business intelligence (Rajereic, 2010). A most popular maturity model that used in software development is capability maturity model (CMM) which developed by Software Engineering Institute (SEI), Carnegie Mellon University.
The idea of Capability Maturity Model (CMM) was initially raised by Watts Humphrey at Software Engineering Institute (SEI), Carnegie Mellon University in 1986.
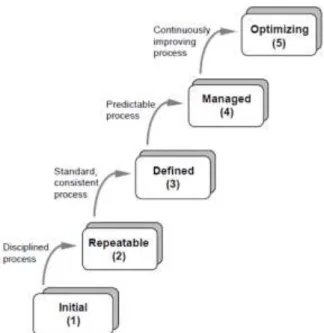
CMM offers a set of guidelines to improve an organization’s processes within an essential area (Wang & Lee 2008). CMM consists of five maturity level as shown in figure 1.
Figure 1. Capability Maturity Model (Paulk et.2006) .
CMM consists of five maturity levels namely: initial, repeatable, defined, managed and optimizing. In the initial level, processes are uncontrolled, disorganized, ad-hoc. Project outcomes are depend on individual efforts. Process unpredictable; always change or modified as the work progress. In Repeatable level, project management processes are defined. Planning and managing new projects based on the experience with similar project (Paulk et.al 2006).In Defined level, the organization has developed own processes, which are documented and used while in Managed level, quality management procedures are defined. In optimizing level, processes are constantly being improved.
CMMs have been developed in many field area such as systems engineering, software engineering, software acquisition, workforce management and development, and integrated product and process development (IPPD) (Paulk et.al, 2006).
Capability Maturity Model Integration (CMMI) was derived in 2000 and it is an improved version of the CMM. CMMI is an integrated model that combines three source models: the Capability Maturity Model for Software (SW-CMM) v2.0, the Systems Engineering Capability Model (SECM), the
Integrated Product Development Capability Maturity Model (IPD-CMM) into (Paulk et.al, 2006).
III OVERVIEW OF BUSINESS
INTELLIGENCE MATURITY MODELS There are many Business Intelligence maturity model developed by different authors such as Business intelligence Development Model (BIDM), TDWI’s maturity model, Business Intelligence Maturity Hierarchy, Hewlett Package Business Intelligence Maturity Model, Gartner’s Maturity Model, Business Information Maturity Model, AMR Research’s Business Intelligence/ Performance Management Maturity Model, Infrastructure Optimization Maturity Model and Ladder of business intelligence (LOBI). This section reviewed several of business intelligence maturity models by different authors.
A. TDWI’s maturiy models
The TDWI’s maturity model is one of the popular tools that used to evaluate business intelligence maturity. The TDWI’s maturity model was prepared and reviewed by Eckerson from TDWI. The model was built with online web-based and it is easy to access by any users. The model adapted the bell shape curve and consists of six stages namely Non-excitant, Preliminary, Repeatable, Managed and Optimizing. However, this model was more focusing on technical aspect of business intelligence such as data warehousing rather than focus on business aspect like organizational and culture aspect.
Figure 2. TDWI’s msturity model .
B. Business Intelligence Maturity Hierarchy (BIMH)
Business Intelligence Maturity Hierarchy (BIMH) was proposed by Roger Deng in 2007. This model consists of four levels of Business Intelligence Maturity: data, information, knowledge and wisdom. BIMH applied the knowledge management field and the author constructed maturity levels from a technical point of view but can considered as incomplete.
C. Hewlett Package BI Maturity Model
Hewlett Package Business Intelligence Maturity Model was developed in 2009. HPBI consists of three dimensions namely business enablement, information technology, and strategy and program management. Hewlett Package BI Maturity Model depicted the maturity levels from business technical aspect. Hewlett Package BI Maturity Model is new and need to improve to add more technical aspects such as data-warehousing and analytical aspects. D. Gartner’s Maturity Model
Gartner’s Maturity Model concentrates of three key areas namely people, processes and metric or technology across five maturity levels: unaware, tactical, focused, strategic and pervasive. Gartner’s Maturity model provides more non technical view and concentrates on the business technical aspect. It is well documented and can search easily on the Web. The assessment offers the series of
questionnaire to form of spreadsheet. However, criteria to evaluate the maturity level categorization are not well defined. Categorization mainly based on the individual maturity levels but not based on the business users and IT employees.
E. Business Information Maturity Model Business Information Maturity Model was proposed by William and William in 2007. The model concentrates of three success factors namely alignment and governance, leverage and delivery; and seven key areas namely BI strategic position, partnership between business units and IT, BI portfolio management, information and analysis usage, process of improving business culture, process of establishing decision culture and technical readiness of BI/DW. This model is well provided with series of questionnaire to assist the users to perform self evaluation. However, criteria to evaluate the maturity level are not well defined.
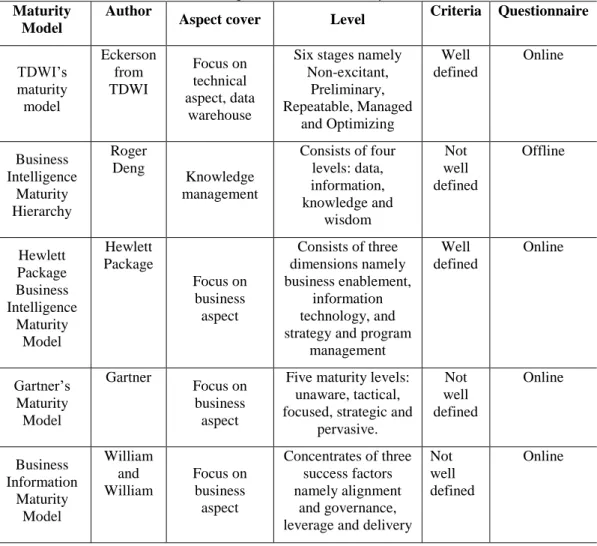
Table 1. Comparison between BI maturity model.
Maturity Model
Author
Aspect cover Level Criteria Questionnaire
TDWI’s maturity model Eckerson from TDWI Focus on technical aspect, data warehouse
Six stages namely Non-excitant, Preliminary, Repeatable, Managed and Optimizing Well defined Online Business Intelligence Maturity Hierarchy Roger Deng Knowledge management Consists of four levels: data, information, knowledge and wisdom Not well defined Offline Hewlett Package Business Intelligence Maturity Model Hewlett Package Focus on business aspect Consists of three dimensions namely business enablement, information technology, and strategy and program
management Well defined Online Gartner’s Maturity Model Gartner Focus on business aspect
Five maturity levels: unaware, tactical, focused, strategic and
pervasive. Not well defined Online Business Information Maturity Model William and William Focus on business aspect Concentrates of three success factors namely alignment and governance, leverage and delivery
Not well defined
Table 1 above depicts summary of various business intelligence maturity models. As shown in the table 1, the majority of the models do not focus the business intelligence as entire which some of models focus on the technical aspect and some of the models focus on business point of view. For example, TDWI’s model only concentrates on the data warehousing while Business Intelligence Maturity Hierarchy only concentrates on knowledge management. It is not complete to represent business intelligence. We know that business intelligence covers not only data warehousing, but also business performance, balanced scorecard, analytical components. In addition, the documentation of some maturity models above is not well defined and they do not provide any guidelines or questionnaire to evaluate maturity levels.
IV PROPOSED FRAMEWORK
Based on the literature review above, the majority of the models do not focus the business intelligence as entire which some of models focus on the technical aspect and some of the models focus on business point of view. If the organizations want to know exact their business intelligence maturity levels as whole, they have to use multiple models and that it is time consuming. Hence, there is need to have integrated maturity model to combine existing different maturity model and questionnaires and evaluation criteria should be provided. In view of this, an Enterprise Business Intelligence Maturity Model (EBI2M) is proposed.
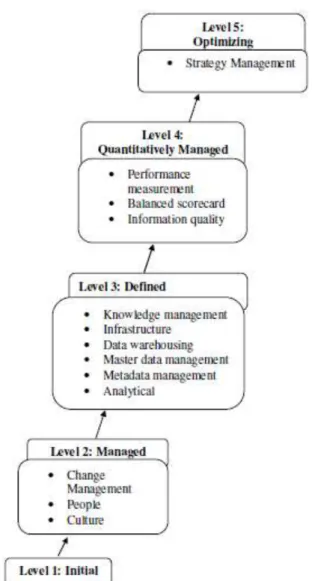
The proposed EBI2M consists of five levels namely; initial, managed, defined, quantitatively managed and optimizing; all of which are adapted from CMMI maturity levels. There are thirteen key process areas, namely; change management, culture, strategic management, process, people, performance management, balanced scorecard, information quality, data warehousing, master data management, analytical, infrastructure and knowledge management.
V METHODOLOGY
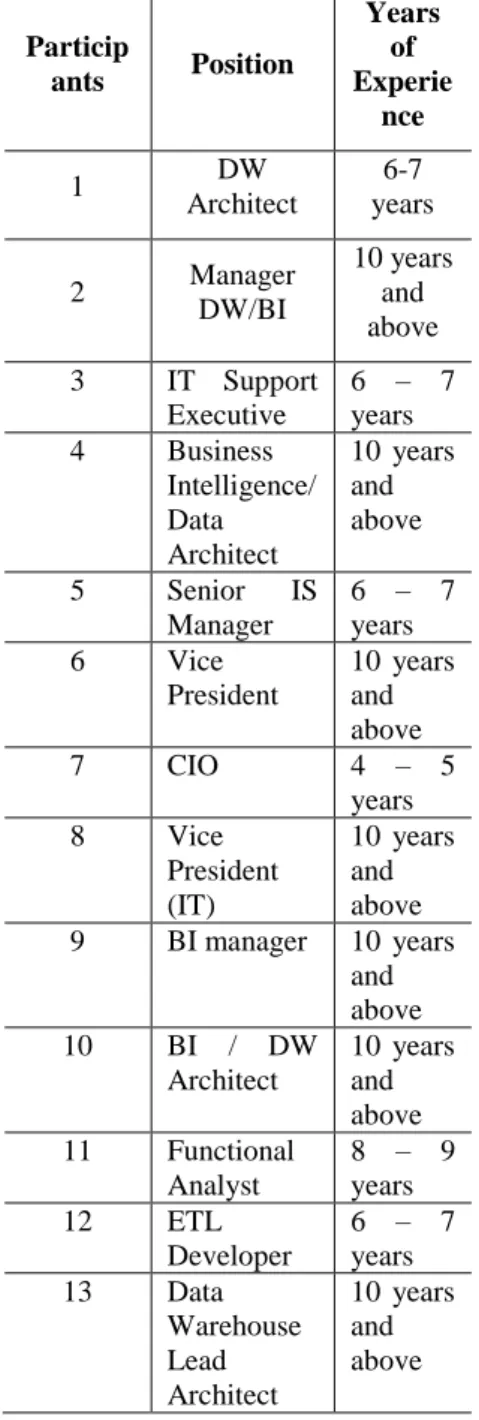
The Stage 1 Delphi study is used to narrow down the scope of this research because of limited academic literature. Around 15 BI experts were chosen through various BI forums Connections. These BI experts were chosen based on their experience on BI. Table 2 shows the experiences of 15 participants.
In the first round of Delphi study, the series of questionnaire were distributed to 15 participants. The participants were asked to map the key process area
(change management, culture, strategic management, people, performance measurement, balanced scorecard, information quality, data warehousing, metadata management, master data management, analytical, infrastructure and knowledge management) suitable to the maturity levels. In the second round, the results of round one were released to the participants. Participants are asked to evaluate the questions again and decide whether they wanted to change their original answers / opinions to concur with the opinions of the other panel members, or whether they were content to remain with their original answers / opinions. The third round of Delphi study will be another iteration of the exact activity in the previous round, with the results being analyzed accordingly.
Table 2. Delphi Study’s participate.
Particip ants Position Years of Experie nce 1 DW Architect 6-7 years 2 Manager DW/BI 10 years and above 3 IT Support Executive 6 – 7 years 4 Business Intelligence/ Data Architect 10 years and above 5 Senior IS Manager 6 – 7 years 6 Vice President 10 years and above 7 CIO 4 – 5 years 8 Vice President (IT) 10 years and above 9 BI manager 10 years and above 10 BI / DW Architect 10 years and above 11 Functional Analyst 8 – 9 years 12 ETL Developer 6 – 7 years 13 Data Warehouse Lead Architect 10 years and above
14 Manager 10 years and above 15 Director 6 – 7 years VI RESULTS
Delphi study results were analyzed using descriptive statistics, including the median and the interquartile range. Interquartile ranges are usually used in Delphi studies to show the degree of group consensus. When using a five point Likert scale, responses with a quartile deviation less than or equal to 0.6 can be deemed high consensus, those greater than 0.6 and less than or equal to 1.0 can be deemed moderate consensus, and those greater than 1.0 should be deemed low consensus (Raskin, 1994; Faherty, 1979).W
hen using five point of Likert Scale
, the value of mean is more than 3.5 is shortlisted.Table 3. The result of Delphi Study’s after three rounds.
Key Process Area Median Inter-quartile (IQ) Change management 2 0.5 Organization Culture 2 0.5 Strategic Management 5 0 People 3 0 Balanced Scorecard 4 0 Information Quality 4 0 Data Warehousing 3 0 Analytical 3 0.5 Infrastructure 3 0 Performance Measurement 4 0 Master Data Management 3 0 Metadata Management 3 0 Knowledge Management 3 0.5
Table 3 depicts the Delphi study’s result after three rounds. The median values were used to indicate the preferred Capability Maturity level for each Maturity Indicator, where 1 indicates the lowest and 5 the highest Maturity level. For example, ‘change management’ and ‘organization culture’ are placed in
maturity level two; ‘people’, ‘data warehousing’, ‘analytical’, ‘infrastructure’, ‘master data management’, ‘metadata management’ and ‘knowledge management’ are placed in level 3; ‘balanced scorecard’, ‘information quality’, ‘performance management’ are placed in level 4; ‘strategic management’ is placed in level 5.
Figure 3. Preliminary Enterprise Business Intelligence Maturity Model.
VII CONCLUSION AND FUTURE WORKS
The purpose of this paper is to explore and develop an EBI maturity model (EBI2M). The EBI2M model is used to help the organization to identify how well they implement BI as well as provides steps by steps to guide the organization to achieve higher level of maturity. This paper applied the Delphi Method to construct an EBI2M. Due to the current lack of complete information and limitation of literature review, particularly on business intelligence maturity models, there is a need for experts to explore and identify the key process areas that can subsequently be used to construct viable and realistic maturity
models. However, reliance on the Delphi study alone is not sufficient for the collection of data needed to rigorously address the research objective. Therefore, based on the research constructs and findings of Delphi study, multiple case studies will be carried out in the future.
ACKNOWLEDGMENT
The authors acknowledge the time and commitment of all members of the Delphi Study for their useful contributions.
REFERENCES
Ang, J & Teo, TSH. (2000). Management Issues in Data Warehousing: Insights from the Housing and Development Board. Decision Support Systems. 29(1): 11-20.
Cates, J.E., Gill, S.S., Zeituny, N . (2005). The Ladder of Business Intelligence (LOBI): a framework for enterprise IT planning and architecture. International Journal of Business Information system. 1(1): 220-238.
Chang, E. (2006). Advanced BI Technologies, Trust, Reputation and Recommendation Systems. 7th Business Intelligence Conference (Organised by Marcus Evans), Sydney, Australia.
Computerworld. (2003). The top 10 Critical Challenges for Business Intelligence Success. Computerworld.
Deng, R. (2007). Business Intelligence Maturity Hierarchy: A New
Perspective from Knowledge Management. Information
Management. http://www.information-management.com/
infodirect/20070323/1079089-1.html
Eckerson, W. (2004). Gauge Your Data Warehouse Maturity.
Information management. viewed on 29. April 2009,
<
http://www.information-management.com/issues/20041101/1012391-1.html>.
Faherty, V. (1979). Continuing social work education: Results of a Delphi
surved. Journal of Education for Social Work. 15(1): 12-19.
Gartner Research. (2007). Gartner EXP Survey of More than 1,400 CIOs Shows CIOs Must Create Leverage to Remain Relevant to the
Business. Retrieved 01/04/2009, from
<http://www.gartner.com/it/page.jsp?id=501189>.
Gartner Research. (2008). Gartner EXP Worldwide Survey of 1,500 CIOs Shows 85 Percent of CIOs Expect Significant Change Over Next
Three Years. Retrieved 01/04/2009, from
<http://www.gartner.com/it/page.jsp?id=587309>.
Gartner Research. (2009). Gartner EXP Worldwide Survey of More than 1,500 CIOs Shows IT Spending to Be Flat in 2009. Retrieved 01/04/2009, from <http://www.gartner.com/it/page.jsp?id=855612>. Hagerty, J. (2006). AMR Research's Business Intelligence/ Performance
Management Maturity Model, Version 2.Viewed on 21 April 2009,
<http://www.cognos.com/pdfs/analystreports/ar_amr_researchs_bi_p erf.pdf >.
Hewlett-Packard. (2007). The HP Business Intelligence Maturity Model.
Viewed on 21 April 2009.
<http://h71028.www7.hp.com/ERC/downloads/4AA1-5467ENW.pdf
>.
Hostmann, B. (2007). Business Intelligence Scenario. Paper presented at the Gartner Business Intelligence Summit, London.
IDC. (2007). Top Ranked Business Intelligence Tools Vendors Maintain
Positions. Viewed 03 Jul 2007,
<http://www.idc.com/getdoc.jsp?containerId=prUS20767807>.
Juran, JM, Gryna, FMJ & Bingham, RS. (1974). Quality Control Handbook, 3 edn, McGraw-Hill Book Co, New York, NY.
Kahn, B, Strong, D & Wang, . (2002). Information Quality Benchmarks: Product and Service Performance. Communications of the ACM :184-192.
Kašnik, A. (2008). odel optimization infrastructure. Internal material of ZRSZ, Ljubljana.
Ke, W., & Kwok, K. W. (2008). Organizational Culture and Leadership in ERP Implementation. Decision support system : 208-218.
Kohlegger, M., Maiyer, R., Thalmann, S. (2009). Understand Maturity
Models : Results of a Structured Content Analysis. In : Proceedings
of 9th International Conference on Knowledge Management and
Knowledge Technologies, pp.51-61.
Loshin, D. (2003). Business Intelligence: The Savvy Manager’s Guide. Morgan Kaufmann Publishers/Elsevier, Boston.
Lupu, A.M., Bologa, R., Lungu, I and Bra, A. (2007). The impact of organization changes on business intelligence projects. Proceedings
of the 7th WSEAS International Conference on Simulation, Modeling
and Optimization, Beijing, China, September 15-17: 414-418. Moss, L & Atre, S. (2003). Business Intelligence Roadmap: The
Complete Lifecycle for Decision-Support Applications. Addison-Wesley, Boston, MA.
Moss, L & Hoberman, S. (2004). The Importance of Data Modeling as a Foundation for Business Insight, Teradata.
Paulk, MC, Curtis, B, Chrissis, MB & Weber, CV. (2006). Capability Maturity Model for Software, Version 1.2, Software Engineering Institute/Carnegie Mellon University.
Rajterič, I.H. (2010). Overview of Business Intelligence Maturity Models. International Journal of Human Science. 15(1): 47-67.
Raskin, M.S. (1994). The Delphi study in field instruction revisited: Expert consensus on issues and research priorities. Journal of Social Work Education : 75-89.
Redman, TC. (1998). The Impact of Poor Data Quality on theTypical
Enterprise Communications of the ACM. 41(2): 79-82.
Richardson, J.K., Schlegel. (2008). Magic Quadrant for Business Intelligence Platforms. Gartner.
Rosemann, M and Bruin, T. D. (2005).Towards a Business Process
Managment Maturity Model’. ECIS 2005 Proceedings. pp.37.
Sacu, C. and Spruit, M. (2010). BIDM: The Business Intelligence Development Model. Proceedings of the 12th International Conference on Enterprise Information Systems, Funchal, Madeira-Portugal.
Simon, R. (2002). Performance Measurement and Control Systems for implementing strategy. Prentice Hall.
Tayi, GK & Ballou, DP (1998). Examining Data Quality. Communications of the ACM. 41(2): 54-57.
Turban, E and Volonino, L. (2010). Information Technology For Management: Transforming Organization In The Digital Economy, Wiley.
Turban, E., Sharda, R., Aronson, J. E., & D. King. (2011). Business Intelligence: A Managerial Approach. Prentice Hall.
Vercellis, C. (2009). Business Intelligence : Data Mining and
Optimization for Decision Making. Wiley.
Wang, M H and Lee, C S. (2008). An Intelligent PPQA Web Services for
CMMI Assessment'. Eight International Conference on Intelligent
Systems Design and Applications, (pp. 229-234).
Whitehorn, M & Whitehorn, M. (1999). Business Intelligence: The IBM
Solution Datawarehousing and OLAP. Springer-Verlag, NY.
William, S and William, N. (2007). The Profit Impact of Business Intelligence. Morgan Kaufmann Publishers, San Francisco.