Section 10: Salary Distribution Process
The South Dakota Board of Regents (BOR) utilizes a merit salary model for salary augmentation of all Board of Regents employees (note: Civil Service falls under State Employee classification). The specific process of salary distribution for unit faculty is negotiated between COHE and the BOR and can be found in section XIX, Salary Provisions in the
BOR/COHE Agreement.
The merit salary distribution process for Professorial rank, Librarian rank, Lecturer rank and Non-Faculty Exempt (NFE)/professional employees, includes three components:
Market
Performance
Institutional Priorities
Determining FAR Composite Rating
To qualify for any pool of dollars, a FAR (Faculty Annual Review) composite rating of “1”, meets expectations must be achieved. The relationship of standards, performance levels and evaluation language is as follows:
Does not meet expectations
– Fell short of basic expectations; not making adequate progress for success
– “0” in salary computations Meets expectations
– Achieved expectations of role/rank
– Solid performance…what one would expect to see for adequate progress
– “1” in salary computations Exceeds expectations
– Went beyond expectations of rank/role; “quality performance”
– Demonstrated exceptional performance and showing indicators of performance at a higher rank; making excellent and strong progress
– “2” in salary computations Substantially exceeds expectations
– Went far beyond expectations of rank/role; exemplary; top 10% ; use sparingly to truly distinguish exemplary performance
– Is clearly performing at a more advanced rank or at the highest level of full professor
– “3” in salary computations
At SDSU, worksheets are completed for each faculty member to derive a FAR composite rating. The worksheets request two types of data:
Workload distribution for fall and spring (for 9-month faculty) and for summer, fall, and spring (for 10-or 12-month faculty).
FAR ratings (using the above computations) for each evaluated role, typically teaching/advising, scholarship, and service.
The workload spreadsheet lists the percentage of work time in each of four categories and the FAR rating in each category (See Table 1). The four categories are: 1) Teaching/ Advising; 2) Research, Scholarship, and Creative Activity; 3) General Service; and 4) Assigned Professional Service. The percentage time in a category times the rating for that category equals “points.” The total points divided by 100 equals the “weighted average rating” or composite rating. Please see Table 1 for example.
Salary Process at SDSU
The specific distribution process at SDSU was revised in 2011-2012. Table 2 and Figure 1 present the negotiated BOR/COHE Agreement, SDSU’s salary distribution model prior to FY12, and revised salary distribution model effective FY12 and going forward.
The Salary Distribution process uses the Oklahoma Target Survey as part of the market portion of a salary package. The Oklahoma Target Survey or the Oklahoma State University Academic Salary Survey by Discipline was first published in 1974. It is a project directed by Oklahoma State University’s Office of Institutional Research and
Information Management. The inspiration behind the project emerged from the desire for current salary information for university management. The result is a study which higher education administrators and government officials can use for salary budget decisions.
In an effort to produce a national sample of average faculty salaries by discipline, doctoral degree granting institutions from each state and the national service academies were selected to provide low, high, and average salaries for each academic discipline and faculty rank represented on their campuses. With the exception of the service academies, these institutions annually award doctorates in a minimum of five different discipline areas.
The universities participate by invitation. For example, an invitation to participate in the 2014-2015 Faculty Salary Survey was extended to 147 institutions including many belonging to the Association of Public and Land-Grant Universities (APLU), those who have historically participated in previous years, and others who also award doctoral degrees in five different discipline areas and data from 111 institutions was submitted by the required deadline to be included in the survey.
Please see Table 2 and Figure 1 for distribution model.
Salary Distribution Process and Example by Type of Appointment Professorial and Librarian Rank
A. Market 20%: The market portion of the salary package is calculated by taking the individual faculty unit member’s Oklahoma target salary (100%) and comparing that to the previous year’s salary. As provided for in the agreement, the Oklahoma target salary is increased in proportion to the FAR composite rating. Persons with less than 1.00 FAR composite rating receive no market increase.
B. Performance 60%: Within this pool, 45% is distributed per a formula specified in the BOR/COHE Agreement and the remaining 15% is provided as a dean’s discretionary pool for faculty based on distinguished performance. Persons with less than 1.00 FAR composite rating receive no performance increase.
Formula performance increase calculations (45%) are computer derived using the following steps:
1) Determine “FAR composite rating” for each person Example: FAR Composite Rating = 2.025
2) Determine FAR composite rank multiplier: Full Professor/ Librarian: 1.02
Associate professor/ Associate Librarian: 1.01 Assistant Professor/ Assistant Librarian: 1.00 Example: 1.02
3) Calculate “Performance Salary Points” (PSP) for each person
Formula: FYXX Total Salary * FAR Composite Rating * Rank Multiplier * FYXX Percent Time: Example: $ 45,987 * 2.025 * 1.02 * 100 = 9,498,615
4) Calculate the “Total Performance Salary Points” (TPSP) for the college This is the total of PSP for all faculty members in the college.
Example: College of Ag and Biological Sciences: TPSP = 2,215,356,521 5) Note the “total performance pool” for the college
This is calculated as follows:
The “total salary enhancement pool” for the college: Total of all FYXX salaries for the college x 4.0%. (For next year’s salary)
Example: $12,046,772 * 4.0% = $481,871
The “total performance pool” for the college is 60% of the “total salary enhancement pool”. This 60% is separated into 2 parts: 45% is for “Formula Performance Increase” and 15% for “Distinguished Performance” Example: $481,871 * 0.60 = $289,123 = Total salary enhancement pool for the college.
$481,871 * 0.45 = $216,842 = Total pool “Formula Performance Increase” salary enhancements for the college
$481,871 * 0.15 = $72,281 = Total pool for “Distinguished performance” salary enhancements for the college 6) Calculate “Formula Performance Increase”
Formula: (PSP (for the individual) divided by TPSP (for the college)) * College Performance Pool (for the college) Example: (9,498,615 / 2,215,356,521) * $216,842 = $930
Summary: FYXX Salary: $45,987
Market Increase: 925 (Calculated elsewhere)
Formula Performance Increase: 930
Discretionary Performance Incr: 0
Institutional Priorities: 0
Promotion: 0
Stipend Increase: 0 TOTAL FYXX Salary: $47,842
C. Institutional Priorities 20%: This pool is for institutional priorities and special circumstances. A person with less than 1.00 overall performance rating cannot receive any increase from this pool. In the current year, the following institutional priorities were used (items are not listed in any order of importance):
1. Excellence and Innovation in Teaching and Advising; 2. Scholarship and Research Productivity,
3. Retention and Student Success, and
4. Innovation and impact in professional service including outreach and engagement
.
Please see Table 3 for salary distribution worksheet. Other Important Considerations:
Should circumstances arise that cannot be solved via the pools of funding above (e.g. equity, significant risk of losing someone, other circumstances), a small pool of funds has been set aside by the Provost. Special requests can be made to this pool.
Faculty who complete a promotion or terminal degree adjustment will receive appropriate salary increases; however, the funds for terminal degree increases do not come from salary process monies.
Lecturer Rank (instructor, lecturer, senior lecturer)
D. Market: Before any other distribution is considered, funds will be allocated to address market. This is calculated by taking the individual instructor/lecturer’s target salary and comparing that to the previous year’s salary. The following ranges will be used in determining market adjustments. Persons with less than 1.00 FAR composite rating receive no market increase.
INSTRUCTOR: (if not available in OK survey) 70% of 90%-100% of Oklahoma Salary Survey for an Assistant Professor
LECTURER: 85% of 90%-100% of Oklahoma Salary Survey for an Assistant Professor
SENIOR LECTURER: 95% of 90%-100% of Oklahoma Salary Survey for an Assistant Professor
E. Performance 90% of remaining pool: Within this pool, 75% is distributed per a formula specified in the BOR/COHE Agreement and the remaining 15% is provided as a dean’s discretionary pool for instructor/lecturer based on distinguished performance. Persons with less than 1.00 FAR composite rating receive no performance increase.
F. Institutional Priorities 10%: This pool is for institutional priorities and special circumstances. A person with less than 1.00 overall FAR composite rating cannot receive any increase from this pool. In current year, the following institutional priorities were used (items are not listed in any order of importance):
1. Excellence and Innovation in Teaching and Advising; 2. Scholarship and Research Productivity,
3. Retention and Student Success, and
4. Innovation and impact in professional service including outreach and engagement
.
Separate salary worksheets are completed for unit professorial/librarian faculty, lecturer faculty and non-unit faculty. A portion of the worksheet is computed by formula with salary amount already loaded into the worksheet while the other portion of the worksheet is completed by the department head and/or dean in awarding discretionary dollars. Other Important Considerations:
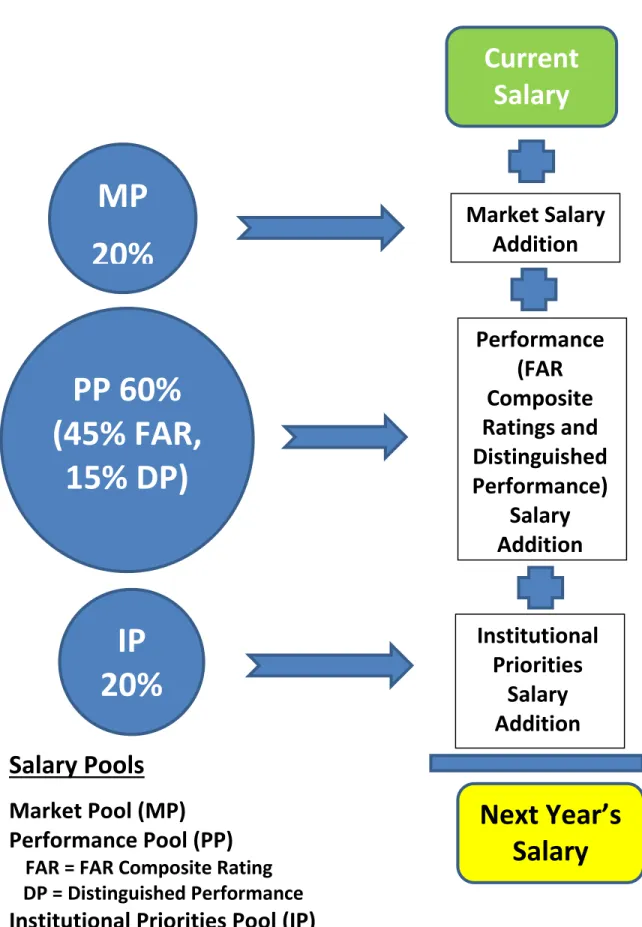
Figure 1. Salary Distribution
SDSU Salary Distribution
MP
20%
IP
20%
PP 60%
(45% FAR,
15% DP)
Market Salary
Addition
Institutional
Priorities
Salary
Addition
Performance
(FAR
Composite
Ratings and
Distinguished
Performance)
Salary
Addition
Current
Salary
Next Year’s
Salary
Salary Pools
Market Pool (MP)
Performance Pool (PP)
FAR = FAR Composite Rating
DP = Distinguished Performance
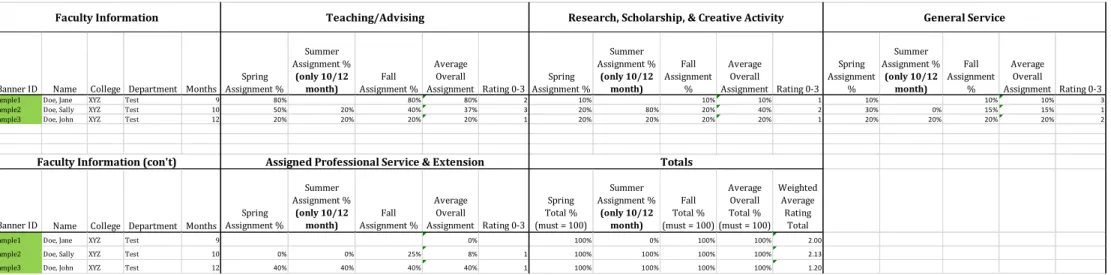
Table 1 Worksheet to Calculate PSE/FAR Composite Rating
Banner ID Name College Department Months
Spring Assignment % Summer Assignment % (only 10/12 month) Fall Assignment % Average Overall
Assignment Rating 0-3 Spring Assignment % Summer Assignment % (only 10/12 month) Fall Assignment % Average Overall
Assignment Rating 0-3 Spring Assignment % Summer Assignment % (only 10/12 month) Fall Assignment % Average Overall
Assignment Rating 0-3
Sample1 Doe, Jane XYZ Test 9 80% 80% 80% 2 10% 10% 10% 1 10% 10% 10% 3
Sample2 Doe, Sally XYZ Test 10 50% 20% 40% 37% 3 20% 80% 20% 40% 2 30% 0% 15% 15% 1
Sample3 Doe, John XYZ Test 12 20% 20% 20% 20% 1 20% 20% 20% 20% 1 20% 20% 20% 20% 2
Banner ID Name College Department Months
Spring Assignment % Summer Assignment % (only 10/12 month) Fall Assignment % Average Overall
Assignment Rating 0-3 Spring Total % (must = 100)
Summer Assignment % (only 10/12 month) Fall Total % (must = 100)
Average Overall Total % (must = 100)
Weighted Average
Rating Total
Sample1 Doe, Jane XYZ Test 9 0% 100% 0% 100% 100% 2.00
Sample2 Doe, Sally XYZ Test 10 0% 0% 25% 8% 1 100% 100% 100% 100% 2.13
Sample3 Doe, John XYZ Test 12 40% 40% 40% 40% 1 100% 100% 100% 100% 1.20
Faculty Information (con't) Assigned Professional Service & Extension Totals
Table 2. BOR and SDSU Salary Policies.
BOR Policy*
Before FY12
FY12 and
beyond Who? Notes
Market pool 20-35% 20% 20% computer
formula
Allocations based on difference between current salary and Oklahoma using ratings as follows:
1= compared to 100% Oklahoma 2= compared to 110% Oklahoma 3=compared to 120% Oklahoma Performance
pool
60-70% for total pool
70% 60%
Rating-driven by rank and grouping
55% 45% computer
formula
salary x rank x performance rating; distributed to groupings (college) 15% for
distinguished performance
15%** 15% Dean/Dept
head
This is for highest rated faculty who deserve special recognition
Institutional Priorities pool
5-20% 10%** 20% Dean/Dept
head
Consider performance, market conditions and other circumstances bearing upon individual contribution to program success *For consideration under any pool, faculty member must have a composite rating of 1 (meets expectations) or higher. **2.5 composite or higher required to receive these funds under old policy.
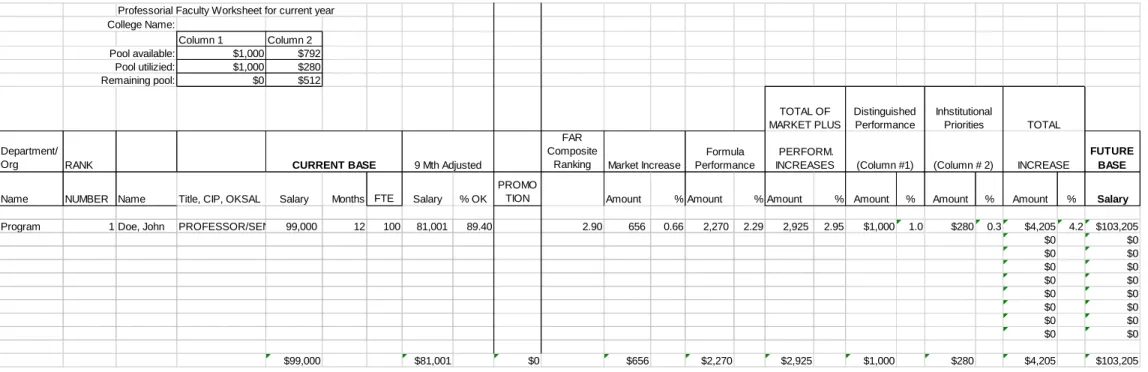
Table 3 Salary Distribution Worksheet
Professorial Faculty Worksheet for current year College Name:
Column 1 Column 2
Pool available: $1,000 $792
Pool utilizied: $1,000 $280
Remaining pool: $0 $512
Department/
Org RANK
FAR Composite
Ranking
FUTURE BASE
Name NUMBER Name Title, CIP, OKSAL Salary Months FTE Salary % OK
PROMO
TION Amount % Amount % Amount % Amount % Amount % Amount % Salary
Program 1 Doe, John PROFESSOR/SENIOR RESEARCH SCIENTIST CIP: 450701 OKSAL: $90603 99,000 12 100 81,001 89.40 2.90 656 0.66 2,270 2.29 2,925 2.95 $1,000 1.0 $280 0.3 $4,205 4.2 $103,205
$0 $0
$0 $0
$0 $0
$0 $0
$0 $0
$0 $0
$0 $0
$0 $0
$99,000 $81,001 $0 $656 $2,270 $2,925 $1,000 $280 $4,205 $103,205
TOTAL
INCREASE Distinguished
Performance
(Column #1)
Inhstitutional Priorities
(Column # 2) TOTAL OF
MARKET PLUS
CURRENT BASE
Formula Performance
PERFORM. INCREASES