Highway Vehicle Fires
continued on next page
Findings
Approximately one in six fires is a highway vehicle fire. This does not include the
■
tens of thousands of fire department responses to highway vehicle accident sites. Unintentionally started fires and the failure of equipment are the leading causes of
■
highway vehicle fires.
Eighty-four percent of highway vehicle fires occur in passenger vehicles.
■
Sixty-two percent of highway vehicle fires and 34 percent of fatal highway vehicle
■
fires originate in the engine area of the vehicle.
Where a contributing factor is noted, the leading factor contributing to the ignition of
■
highway vehicle fires is mechanical failures (47 percent).
Insulation around electrical wiring (28 percent) and flammable liquids in the engine
■
area (21 percent) are the items first ignited in highway vehicle fires. Fifty-seven percent of fatal vehicle fires are the result of a collision.
■
These short topical reports are designed to explore facets of the U.S. fire problem as depicted through data collected in USFA’s National Fire Incident Reporting System (NFIRS). Each topical report briefly addresses the nature of the specific fire or fire-related topic, highlights important find-ings from the data, and may suggest other resources to consider for further informa-tion. Also included are recent examples of fire incidents that demonstrate some of the issues addressed in the report or that put the report topic in context.
F
rom 2004 to 2006, an estimated 258,500 highway vehicle (automobiles, vans, trucks) fires occurred each year. These highway vehicle fires account for 16 percent of fires responded to by fire departments across the Nation. This topical report addresses the characteristics of high-way vehicle fires reported to the National Fire Incident Reporting System (NFIRS) between 2004 and 2006.Highway vehicle fires represent approximately 90 percent of all vehicle fires and resulted in an average of approximately
490 deaths, 1,275 injuries, and $1 billion in property loss each year.1
Table 1 presents losses, averaged over this 3-year period, of highway vehicle fires and all reported fires. The first set of loss figures are losses averaged over all fires and highway vehicle fires. The second set is average losses only when a loss occurs.2
Table 1. Loss Measures for All Fires and Highway Vehicle Fires
(3-year average, 2004–2006)
MEASURE ALL FIRES HIGHWAY VEHICLE FIRES
Average loss:
Fatalities/1,000 fires 2.0 2.6
Injuries/1,000 fires 10.2 4.5
Dollar loss/fire $5,918 $3,080
Average per fire loss for fires with loss:
One of the challenges in the analysis of NFIRS vehicle fire data is the large number of unknown, undetermined, or unavailable entries reported. For example, in the following analysis of the heat source and items first ignited in highway vehicle fires, the undetermined entries comprise 50 percent and 57 percent of the data respectively, making it difficult to establish any concrete conclusions.
Types of Highway Vehicle Fires
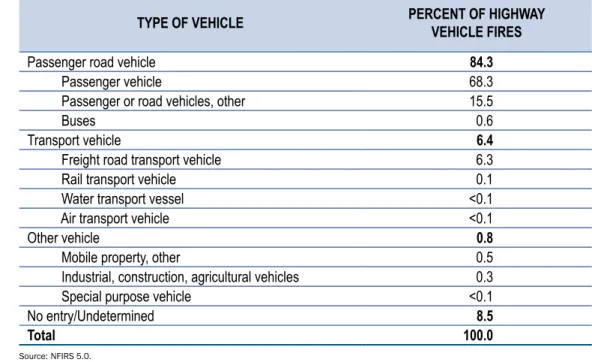
The majority of highway vehicle fires, 84 percent, occur in nontransport passenger vehicles; 68 percent of highway
vehicle fires occur in standard passenger vehicles, another 16 percent occur in some other type of passenger vehicle, and less than 1 percent occur in buses. Only 7 percent of highway vehicle fires occur in nonpassenger vehicles: 6 percent of highway vehicle fires occur in transport vehicles, with freight transport vehicles accounting for the majority of these fires, and less than 1 percent occur in other types of vehicles. In the remaining 9 percent of highway vehicle fires, the type of vehicle was not reported (Table 2).
Table 2. Types of Highway Vehicle Fires
(2004–2006)
TYPE OF VEHICLE PERCENT OF HIGHWAY VEHICLE FIRES
Passenger road vehicle 84.3
Passenger vehicle 68.3
Passenger or road vehicles, other 15.5
Buses 0.6
Transport vehicle 6.4
Freight road transport vehicle 6.3
Rail transport vehicle 0.1
Water transport vessel <0.1
Air transport vehicle <0.1
Other vehicle 0.8
Mobile property, other 0.5
Industrial, construction, agricultural vehicles 0.3
Special purpose vehicle <0.1
No entry/Undetermined 8.5
Total 100.0
Source: NFIRS 5.0.
Notes: Totals may not add due to rounding.
Causes of Highway Vehicle Fires
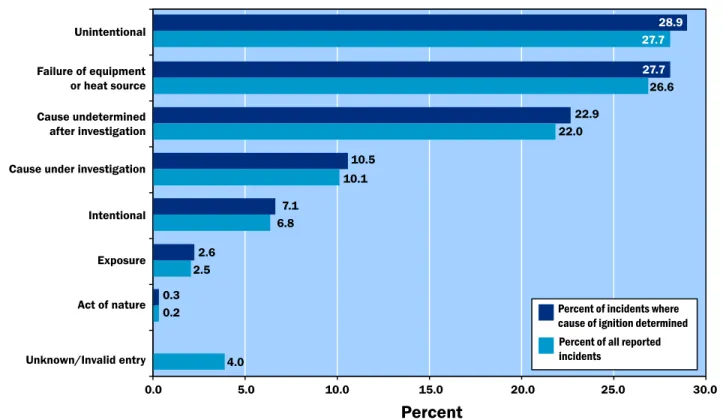
As shown in Figure 1, unintentionally caused fires account for 29 percent of vehicle fires. These fires may be the result of either careless behavior or accidental actions. Intentionally set fires constitute only 7 percent of vehicle fires. NFIRS no longer collects information on suspicious fires that may have been intentionally set.3 As a result, intentional fires may be undercounted. Moreover, due to the volume of fires, many automobile fires are not investigated for possible arson.
The failure of equipment or the heat source is the cause of 28 percent of vehicular fires. These fires are generally a result of mechanical problems, ranging from a faulty design in the vehicle to an improperly installed device.
Determining the cause of vehicle fires is often challenging. As a result, in 23 percent of the vehicle fires no cause was determined after investigation.
Unintentional
0.0 5.0 10.0 15.0 20.0 25.0 30.0
Failure of equipment or heat source
Cause under investigation Intentional Exposure Act of nature
Unknown/Invalid entry Cause undetermined
after investigation
Percent of incidents where cause of ignition determined Percent of all reported incidents
28.9 27.7 27.7
26.6 22.9
22.0 10.5
10.1 7.1
6.8 2.6
2.5 0.3 0.2
4.0
Percent
Where Highway Vehicle Fires Start
(Area of Fire Origin)
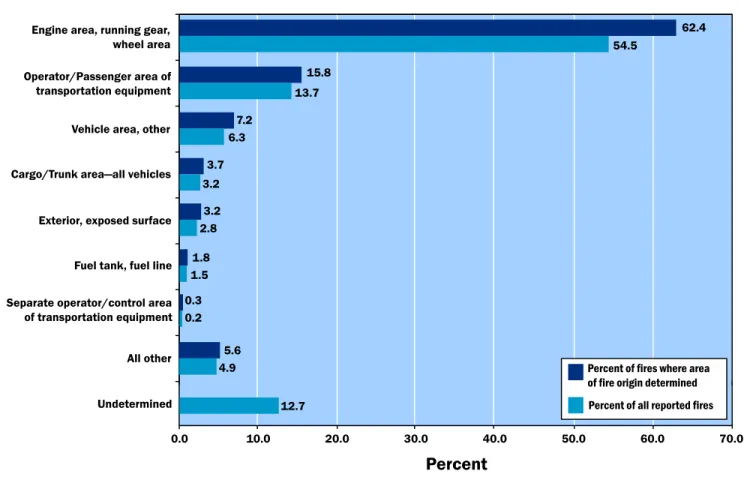
Not surprisingly, an overwhelming majority (94 percent) of highway vehicle fires originate within the vehicle itself
(Figure 2). In fact, 62 percent of highway vehicle fires originate in the engine, running gear4, or wheel areas of the vehicle. The second most common area of origin is in the passenger area of the vehicle (16 percent).
Figure 1. Causes of Highway Vehicle Fires
(2004–2006)
Source: NFIRS 5.0.
Figure 2. Area of Fire Origin in Highway Vehicles
(2004–2006)
Source: NFIRS 5.0.
Note: The chart reflects 321,447 total entries, 280,501 valid entries, and 40,946 undetermined entries.
Engine area, running gear, wheel area
0.0 70.0
Operator/Passenger area of transportation equipment
Cargo/Trunk area—all vehicles Exterior, exposed surface Fuel tank, fuel line Separate operator/control area
of transportation equipment
Undetermined Vehicle area, other
1.8 1.5 0.3 0.2
60.0 50.0
40.0 30.0
20.0 10.0
Percent of fires where area of fire origin determined Percent of all reported fires
All other 5.6 4.9
12.7 15.8 7.2
6.3 3.7 3.2 3.2 2.8
62.4 54.5
13.7
Percent
How Highway Vehicle Fires Start (Heat
Source)
Sixty-two percent of highway vehicle fires derive their heat source from powered equipment (Figure 3). Fittingly, the subcomponents of this category comprise four of the top five leading sources of heat in all highway vehicle fires—heat from powered equipment (21 percent); radiated or con-ducted heat from operating equipment (16 percent); electri-cal arcing (16 percent); and spark, ember, or flame from operating equipment (9 percent).
The next leading category of heat sources in highway vehicle fires is from hot or smoldering objects (12 percent). This includes fires igniting from hot embers or ashes, sparks that result from friction, and other hot materials.
As shown in Figure 3, an additional 10 percent of high-way vehicle fires derive their heat source from other open flames or smoldering objects. This includes backfire from the engine and heat from cigarettes, cigars, matches, torches, and the like.
Figure 3. Sources of Heat in Highway Vehicle Fires
(2004–2006)
Source: NFIRS 5.0.
Note: The chart reflects 321,447 total entries, 160,176 valid entries, and 161,271 undetermined entries.
Heat from powered equipment
0.0 70.0
Hot or smoldering object
Heat source: other Heat spread from another fire Multiple heat sources including multiple ignitions
Explosive, fireworks
Undetermined Heat from other open flame or
smoldering materials
1.4 0.7 1.3 0.7
60.0 50.0
40.0 30.0
20.0 10.0
Percent of incidents where heat source determined Percent of all reported fires
Chemical, natural heat source 0.7 0.4
50.2 11.8
9.7 4.8
9.3 4.6 3.9 1.9
61.9 30.8
5.9
Percent
What Ignites
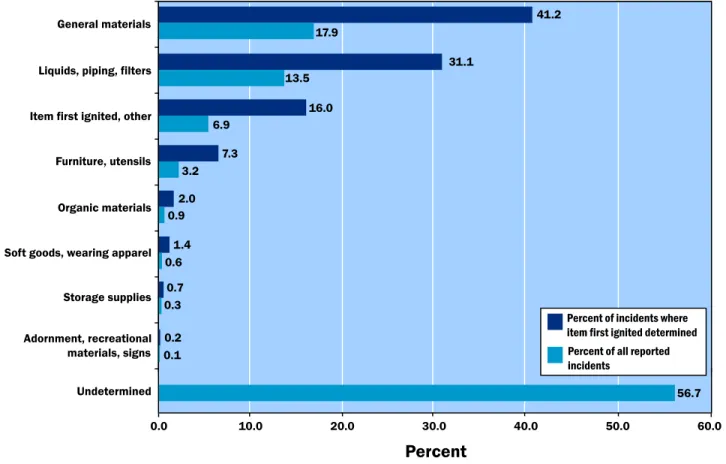
Forty-one percent of the items first ignited in highway vehicle fires fall under the category of general materials. This category includes materials such as tires, insulation around electric wire and cables, trash, and fabric. The insulation around electrical wiring or other cables is the most common item to be ignited initially not only within this category, but in all highway vehicle fires (28 percent). Interestingly, while it is often assumed that vehicle fires commonly originate with the tires of the vehicle, tires are the item first ignited in only 3 percent of highway vehicle fires.
The second leading category of items first ignited is liquids, piping, and filters (31 percent). This category primarily includes fuel in various locations in the vehicle. Not unex-pectedly, fuel from the engine area is the leading item first ignited within this category, and is the second most com-mon item first ignited in highway vehicle fires overall (21 percent) due to its combustibility. Flammable liquids and gases in general account for 28 percent of items first ignited (Figure 4).
Figure 4. Item First Ignited in Highway Vehicle Fires
(2004–2006)
Source: NFIRS 5.0.
Note: The chart reflects 321,447 total entries, 139,298 valid entries, and 182,149 undetermined entries.
General materials
0.0 Liquids, piping, filters
Furniture, utensils Organic materials Soft goods, wearing apparel Storage supplies
Undetermined Item first ignited, other
1.4 0.6
0.7 0.3
60.0 Adornment, recreational
materials, signs 0.10.2
56.7 31.1
16.0 6.9
7.3 3.2 2.0 0.9
41.2 17.9
13.5
Percent
10.0 20.0 30.0 40.0 50.0
Percent of incidents where item first ignited determined Percent of all reported incidents
Factors Contributing to Ignition
By far, the leading factor contributing to the ignition of highway vehicle fires is mechanical failures (47 percent). These mechanical failures can include a leak or break in a component of the vehicle, automatic or manual control failures, or the use of an improper type of fuel. Within this category, unspecified mechanical failures (29 percent) are the leading factors contributing to the ignition of highway
vehicle fires, followed by a leak or break in a component of the vehicle (11 percent).
Electrical failures such as short circuits are the next leading factors at approximately 23 percent. The misuse of a mate-rial, such as spilling flammable liquid or gas too close to the vehicle, is the next leading factor at approximately 12 percent (Figure 5).
Figure 5. Factors Contributing to Ignition of Highway Vehicle Fires (Where Specified)
(2004–2006)
Source: NFIRS 5.0.
Notes: 1) Includes incidents where factors that contributed to the ignition of the fire were specified. Multiple factors contributing to fire ignition may be noted for each incident. 2) 129,846 entries where factor contributing to ignition was specified.
Mechanical failure
0.0 Electrical failure
Fire spread or control Factors contributing to ignition, other Operational deficiency Design, manufacture, installation deficiency Misuse of material or product
0.8 Natural condition 0.5
7.0
Percent
10.05.0 15.0 20.0 25.0 30.0 35.0 40.0 45.0 50.0
47.2 23.2
11.9
7.0 6.8
When They Occur
As shown in Figure 6, highway vehicle fires occur mainly in the afternoon and evening, peaking from 3 p.m. to 6 p.m. Fires occur the least often in the morning hours from 4 a.m. to 7 a.m.
Figure 7 shows that vehicle fires occur nearly uniformly throughout the year. Highway vehicle fires peak in midsum-mer in July (10 percent), possibly due to elevated outdoor temperatures or increased vehicle use.
Figure 6. Time of Alarm for Highway Vehicle Fires
(2004–2006)
Source: NFIRS 5.0. Note: 321,447 total entries.
Figure 7. Highway Vehicle Fires by Month
(2004–2006)
3.6
0.0 7.0
1.0 2.0 3.0 4.0 5.0 6.0
Mid-1 AM1 AM-2 AM2 AM-3 AM3 AM-4 AM4 AM-5 AM5 AM-6 AM6 AM-7 AM7 AM-8 AM8 AM-9 AM 9 AM-1
0 AM 10 AM-1
1 AM 11 AM-1
2 PM 12 P
M-1 P M 1 PM-2 P
M 2 PM-3 P
M 3 PM-4 P
M 4 PM-5 P
M 5 PM-6 P
M 6 PM-7 P
M 7 PM-8 P
M 8 PM-9 P
M
9 PM-1 0 PM 10 P
M-11 P M 11 P
M-Mid
3.3 3.2 2.9
2.6 2.4 2.6 3.1
3.3 3.4
3.8 4.3
4.9 5.1
5.6
6.0 6.1 6.2
5.6 5.0
4.6 4.5 4.2
3.9
Percent
8.0 7.3
8.1 8.3
8.6 9.0
9.8 9.1
8.4 8.1
7.6 7.7
4.0 6.0 8.0 10.0 12.0
Fatal Highway Vehicle Fires
Where the information on the area of fire origin is available, 94 percent of fatal highway fires originate in the vehicle area, and result in 94 percent of highway vehicle fire deaths. Of these fatal fires, the leading area of origin in both fatal highway fires and highway fires in general is the engine area, at 34 percent and 62 percent, respectively. Fires that origi-nate here are by far the deadliest, accounting for 34 percent of all deaths. Fires that originate in the fuel tank account for 2 percent of highway vehicle fires, but 16 percent of fatal fires and 18 percent of deaths.
The heat source in 53 percent of fatal fires with a known origin comes from powered equipment and also accounts for 53 percent of highway vehicle fire deaths. Within this category, sparks, embers, or flames from operating equip-ment account for 9 percent of highway vehicle fires, but are the leading source of fatal fires at 21 percent.
Where the necessary data are available, liquids (most notably gasoline), piping, and filters were the items first ignited in 68 percent of fatal highway vehicle fires, causing 71 percent of deaths. Of these fires, those involving gasoline from the engine were by far the most deadly (41 percent of deaths). Within the liquids, piping, and filters category, fuel in or from the engine area is the second leading item first ignited in highway vehicle fires in general (21 percent), but is by far the leading item in both fatal fires (39 percent) and deaths (41 percent). Additionally, insulation from electrical wiring or cable is responsible for 28 percent of all highway vehicle fires, but only 1 percent of fatal fires and 1 percent of deaths. Gasoline alone is the leading type of material first ignited in highway vehicle fires in general (23 percent) as well as fatal highway vehicle fires (52 percent). Gasoline is responsible for 56 percent of deaths in fatal fires. Flammable liquids in general account for 33 percent of all highway vehicle fires, 67 percent of fatal highway vehicle fires, and 70 percent of deaths. While plastic is the second leading type of mate-rial first ignited, at 21 percent of all highway vehicle fires, it accounts for less than 1 percent of the fatal fires, and less than 1 percent of deaths.
Collisions, as a factor contributing to ignition, result in 3
to the fire. Unspecified mechanical failures contribute to 29 percent of all highway vehicle fires, but are rarely fatal, accounting for 3 percent of fatal fires.
Forty-four percent of fatal highway fires begin unintention-ally. Six percent of fatal highway fires were set intentionunintention-ally. Thirty-nine percent of fatal fires occur between midnight and 7 a.m., especially between 2 and 4 a.m. (14 percent). The highest percentages of deaths occur between 3 and 4 p.m. (7 percent), 3 and 4 a.m. (7 percent), and 6 and 7 a.m. (6 percent).
Conclusion
Vehicle fires generally are given less attention than structure fires, largely because most people do not realize the extent to which they contribute to the fire problem. Highway vehicle fires account for 90 percent of vehicle fires, and 16 percent of all fires—one of every six fires. Highway vehicle fires also account for 14 percent of all fire deaths, and 94 percent of vehicle fire deaths.
In the case of collisions, it often is difficult to determine whether the fire and ensuing losses are the result of the fire alone or from the fire following the collision. As mechanical and electrical failure play a large role in these fires, testing to determine how and why these fires develop would allow engineers to improve future vehicle designs. Additionally, public safety programs aimed at educating the public on fire and vehicle safety, coupled with initiatives to reduce the number of vehicle collisions, would further reduce the num-ber of highway fires and deaths.
Examples
• October 2004: The engine of a low-mileage, late-model sport utility vehicle caught fire. The manufacturer claims the fire was caused by incompetent mechanics, while mechanics contend that the close proximity of the oil fil-ter to the exhaust system was to blame. Similar fires have occurred in over 60 other 2003 or 2004 models made by the same manufacturer.5
• January 2008: Three teens were arrested for attempted arson after stuffing combustibles, such as paper, into the gasoline tanks of several cars and then igniting them.6 • February 2008: While driving on the highway, a driver
noticed a fire had started in his engine compartment. He pulled over and the 1991 Chevy van quickly went up in flames. The fire spread up the embankment on the side of the road and covered about one-half acre.7
• May 2008: A mechanical failure in a vehicle caused the vehicle to catch fire. The body shop where the car was being serviced was damaged in the ensuing fire.8
To request additional information or to comment on this report, visit http://www.usfa.dhs.gov/applications/feedback/index.jsp
Related Topics:
Motor Vehicle Fires: What You Need to Know
■ ,
FA-243/April 2003, http://www.usfa.dhs.gov/ downloads/pdf/publications/fa-243.pdf
Roadway Operations Safety
■ , http://www.usfa.
dhs.gov/fireservice/research/safety/roadway. shtm
National Fire Incident Reporting System
Data Specifications for Highway Vehicle
Fires
Data for this report were extracted from the NFIRS annual public data release (PDR) for 2004, 2005, and 2006. Only version 5.0 data were extracted.
Highway vehicle fires were defined as:
• Incident types 131 (passenger vehicle fire) and 132 (road freight or transport vehicle fire).
• Mobile property involved 1 (not involved in ignition, but burned) and 3 (involved in ignition and burned).
• Aid types 3 (mutual aid given) and 4 (automatic aid given) were excluded to avoid double counting of incidents.
Notes:
1 As highway vehicles are a major property class, the national
esti-mates are based only on the National Fire Protection Association’s
(NFPA) annual survey, Fire Loss in the United States. Fires are rounded
to the nearest 500, deaths to the nearest 5, injuries to the nearest 25, and loss to the nearest $ million.
2 The average fire death and injury loss rates computed from
the NFPA estimates will not agree with average fire death and injury loss rates computed from NFIRS data alone. The fire death rate computed from NFPA estimates would be (1,000 x (490/258,500)) = 1.9 deaths per 1,000 highway vehicle fires and
the fire injury rate would be (1,000x (1,275/258,500)) = 4.9
injuries per 1,000 highway vehicle fires. Loss rates for fires with losses cannot be computed from the NFPA estimates.
3 While the term “suspicious” is not used currently in NFIRS 5.0,
information still is collected on fires that may be intentionally set and may be suspicious or believed to be arson. These fires can be coded as fires “under investigation.” However, not all fires coded as “under investigation” are necessarily suspicious or believed to be arson.
4 The running gear of a vehicle generally refers to components that
transfer power from the engine and deliver it to the wheels, e.g., transmission, drive shaft, differential.
5 Jeremy W. Peters, “Why Are Honda CR-V’s Catching Fire?,”
NYTimes.com, October 12, 2004, http://www.nytimes.
com/2004/10/12/business/12honda.html?n=Top/Reference/ Times%20Topics/Subjects/C/Consumer%20Product%20Safety&_ r=1&adxnnl=1&oref=slogin&adxnnlx=1214251522-tMnY/ qjLJ8NrJfuFQYw8RQ (accessed May 28, 2008).
6 Michael P. McConnell, “Teens face arson charges for attempting
to ignite cars,” DailyTribune.com, January 16, 2008, http://www.
dailytribune.com/stories/011608/loc_n3001.shtml (accessed June 2, 2008).
7 Melanie Davis, “Vehicle fire turns into brush fire Monday
morn-ing on U.S. 421,” WataugaDemocrat.com, February 11, 2008, http://
www.wataugademocrat.com/2008/0211/0211carfire.php
(accessed May 28, 2008).
8 “Car destroyed, building damaged during vehicle fire,”
HickoryRecord.com, May 26, 2008, http://www.hickoryrecord.com/ servlet/Satellite?pagename=HDR/MGArticle/HDR_BasicArticle &c=MGArticle&cid=1173355566758&path= (accessed May 28, 2008).