Users of Public Reports of Hospital Quality:
Who, What, Why, and How?
An aggregate analysis of 16 online public reporting Web
sites and users’ and experts’ suggestions for improvement
Prepared for:
Agency for Healthcare Research and Quality
U.S. Department of Health and Human Services
540 Gaither Road
Rockville, MD 20850
www.ahrq.gov
Prepared by:
Naomi S. Bardach, M.D.
University of California, San Francisco
Judith H. Hibbard, Ph.D.
University of Oregon
R. Adams Dudley, M.D., M.B.A.
University of California, San Francisco
With assistance from
:
Renee Asteria-Penaloza, M.P.H.
Lena Libatique
Edie Wade, Ph.D.
Shoujun Zhao, Ph.D.
Jim Anderson, M.A.
Aaron Kellem, B.A.
AHRQ Publication No. 12-0016-EF
December 2011
Acknowledgments
Appreciation is extended to the 16 organizations that participated in this project,
installing software on their Web sites and donating time to assist all report sponsors in
understanding how to serve Web site visitors better.
Funding source for survey development and data analysis:
Agency for Healthcare Research and Quality
U.S. Department of Health and Human Services
540 Gaither Road
Rockville, MD 20850
www.ahrq.gov
Funding source for data collection:
The California HealthCare Foundation
1438 Webster Street, Suite 400
Oakland, CA 94612
http://www.chcf.org/
The views expressed in this report are those of the authors. No official endorsement by
the Agency for Healthcare Research and Quality, the U.S. Department of Health and
Human Services, or the California HealthCare Foundation is intended or should be
inferred.
The suggested citation format follows: Bardach NS, Hibbard JH, Dudley RA. Users of
Public Reports of Hospital Quality: Who, What, Why, and How?: An aggregate analysis
of 16 online public reporting Web sites and users’ and experts’ suggestions for
improvement. Rockville, MD: Agency for Healthcare Research and Quality; 2011.
AHRQ Publication No. 12-0016-EF.
Contents
Executive Summary ... 1
Introduction ... 4
Section 1. Methods ... 5
Population and Setting ...5
Web Analytics ...5
Survey ...6
Survey Development ... 6
Survey Implementation ... 7
Expert Review of Web Sites ...8
Section 2. Who Is Coming to the Web Sites? ... 10
Key Findings ...10
Implications ...12
Section 3. How Do Visitors Arrive at the Web Sites and Who Stays? ... 13
Key Findings ...13
Implications ...14
Section 4. Visitors‟ Overall Ratings of the Web Sites ... 16
Key Findings ...16
Implications ...18
Section 5. Consumers‟ Feedback ... 19
Key Findings ...19
Implications ...22
Section 6. Health Care Professionals‟ Feedback ... 23
Key Findings ...23
Implications ...25
Section 7. Expert Review of Web Sites ... 26
Key Findings ...26
Implications ...26
Section 8. Summary Recommendations and Conclusions ... 28
Appendix A: Consumer and Health Care Professional Characteristics ... A-1
Appendix B: Numeric Summary of Survey Responses by Respondent Type ... B-1
Appendix C: Summary of Write-in Survey Responses by Respondent Type... C-1
Executive Summary
States, community quality collaboratives, and others are investing millions of dollars in the
sponsorship and development of public reports on the quality of hospital care. The hope is that
these reports will stimulate quality improvement, increase accountability, and improve consumer
choices. Although the major method of distributing these reports is through Web sites, it is not
known who visits these public reporting Web sites or how Web site visitors use the data
presented. This evidence gap leaves report sponsors with minimal guidance on how to construct
and implement a report that will successfully engage consumers and providers.
Two key indicators of success for a public reporting Web site are the number of people who
access it and the experiences people have when using it. However, there is little publicly
available information on these topics. In order to capture these two indicators, we worked with
16 hospital reporting sites affiliated with the AHRQ Chartered Value Exchange program over a
3-month period starting in February 2011. We used two tools: Web analytics to measure and
analyze Web site usage patterns for all visitors to the 16 sites, and an online pop-up survey on
each Web site to gather information through direct interaction with a subset of visitors. The
resulting data were augmented with expert review of the Web sites.
From the survey responses, we focused on consumers (patients and friends or family members)
and health care professional respondents (physicians, nurses, hospital executives, etc.) because
they are important target audiences for the public report sponsors and also accounted for most of
the survey respondents.
We identified 12 key takeaways.
Getting people to come to your Web site:
1.
Although more than 80,000 unique visitors came to the participating Web sites during the
study, the individual sites vary dramatically in the amount of traffic they receive. In
addition, some sites are attracting primarily providers and some are attracting primarily
consumers.
2.
There is a “most common user” profile among current consumer visitors to the 16
participating Web sites
.
More than 80 percent of consumer respondents were 45 years old
or older, 90 percent were White, and 64 percent had at least a 4-year college degree.
Strategies to address the needs of these individuals would serve the current users.
3.
Conversely, the Web sites appear to be little used by important vulnerable populations.
For example, although Medicaid covers over 15 percent of all citizens in the United
States, less than one-half of one percent of survey respondents were Medicaid
beneficiaries. Individuals with less than college education and from racial and ethnic
minorities were also underrepresented. To reach these individuals, it will be important for
Web site sponsors to identify methods of outreach to these populations.
4.
The participating Web sites were also very different in the amount and share of traffic
garnered through the three primary sources: 1) search, or typing keywords into a search
engine; 2) referral, which means arriving through a link on another Web site, such as a
sites in referral traffic. No Web site excelled at generating traffic through all three
sources.
5.
There is opportunity for each of the participating Web sites to increase traffic via one or
more of the following strategies: search engine optimization (techniques to generate more
search traffic), marketing campaigns to consumers or health care professionals to increase
direct traffic, and placement of links to the public report on affiliated Web sites to drive
referral traffic. To date, improving search traffic has been the most effective method of
generating visits.
6.
Few visitors arrive at the participating Web sites through a search for a specific medical
condition or a search for „high quality hospitals‟ or „hospital performance.‟ Many visitors
arriving through search used the specific Web site names or specific hospital names in
their search. In addition, there is limited competition for individual hospital names in
search engines, compared to medical condition searches. Therefore, these may be good
search terms on which to focus search engine optimization activities.
Engaging them once they arrive:
1.
While „high quality hospitals‟ or „hospital performance‟ were not commonly used as
search terms among visitors to the participating sites, the majority of visitors indeed came
to the sites to look at quality information (choose or compare hospitals or confirm a
choice already made). A substantial percentage of visitors are looking for other types of
information (e.g., practical information such as location and phone number) that is often
not available. A strategic response for Web site hosts could be to add content that
addresses these unmet needs.
2.
Some consumers are using the quality data for hospital selection. Across all 16 Web sites,
almost half of consumer visitors reported that they were “likely” or “very likely” to use
the data to choose a hospital or change hospitals.
3.
Consumer visitors to the participating sites indicated they would like to see information
more specific to their decisionmaking needs—specific conditions or surgeries (such as
cancer or joint replacement surgery) and performance of individual doctors practicing at
the hospital.
4.
Health care professionals rated the participating sites as easier to use—and had higher
overall satisfaction ratings—than consumers, but even some health care professionals
found them difficult to use. Across the participating Web sites, there are opportunities to
make it easier for each category of user to find the best hospital.
5.
In addition, and in contrast to consumers, health care professionals often expressed
interest in having more details about quality measures or measurement methodology.
This is the first empirical, survey evidence that it is difficult to serve both audiences with
a single Web site.
6.
An expert review of the participating sites identified areas for consideration for redesign
that would make it easier for users to find the best hospital. For example, few of the
participating sites use rating or measure display strategies that have been shown to help
users understand comparative information and use it to make a choice; few sites use
composite measures or interpretive labels (e.g., “better,” “average,” or “worse”) to
display provider performance. Only one uses a conceptual framework to help visitors
understand the larger concept of quality. Nearly all sites used technical language (for
example, including abbreviations such as ARB for angiotensin receptor blockers, but
even the latter is not understood by most consumers). Many of the participating Web sites
do not allow visitors to choose the hospitals of interest to them, many have visual
displays of information that are difficult to understand, and some do not allow
side-by-side comparisons of hospitals.
It is encouraging that some consumers and health care professionals are finding these Web sites
and that some visitors are using the reports for hospital selection. Exciting opportunities remain
for report sponsors: reaching consumer and health care professional markets more broadly as
well as other markets that remain untapped and improving the power of their reports by focusing
on relevant content and making it easier for individuals to find the hospitals that will provide
them with the best care.
Introduction
The purpose of this report is to help readers understand the current use and experience of public
reporting Web sites by consumers and health care professionals. Several different data sources
were combined to arrive at the conclusions we present. To assist the reader in interpreting our
findings and evaluating our conclusions, in
Section 1
of this report, we will review the methods
used to collect and analyze the data for this project.
We begin our presentation of results in
Section 2
, in which we describe who is coming to the
Web sites, based on survey data. In
Section 3
, we present Web analytics data on how those
visitors are finding the Web sites. To describe the visitor experience, we provide survey data
about respondents‟ overall ratings of the Web sites (
Section 4
) and both consumers‟ (
Section 5
)
and health care professionals‟ (
Section 6
) feedback regarding content and usability.
In
Section 7
, we detail findings from an expert review of Web sites. In
Section 8
, our
recommendations and conclusions from the project are summarized. Detailed data are available
in the appendixes, including tables presenting consumer and health care professional
characteristics (Appendix A), numerical summaries of all survey responses from consumers
(patients and friends and family members) and health care professionals (Appendix B), and a
summary of write-in survey responses (Appendix C).
Section 1. Methods
Population and Setting
Report sponsors participating in this project all have online public reports of hospital quality and
are Chartered Value Exchanges (CVEs)—multistakeholder collaboratives with a mission of
quality improvement and transparency—or CVE affiliates. Web site sponsors were invited to
participate via multiple communication channels and the Web sites of all interested sponsors
were included in the project. The group of participating Web sites represents all major regions of
the country. Data collection occurred during a 3-month period during February-May 2011.
Three sources of information were used in developing this report: Web analytics, survey
responses, and expert review.
Web Analytics
We gathered Web metrics from each Web site, using Google Analytics, a free and commonly
used Web analytics service. Participating Web sites inserted the code for tracking the data into
their Web site and then excluded traffic from computers internal to their organizations.
The total number of unique visitors to the participating Web sites was 87,249. The number of
unique visitors among Web sites varied considerably from 41 to 52,247. Since some of this
variation represents differences in the size of the sites‟ geographic areas and population served,
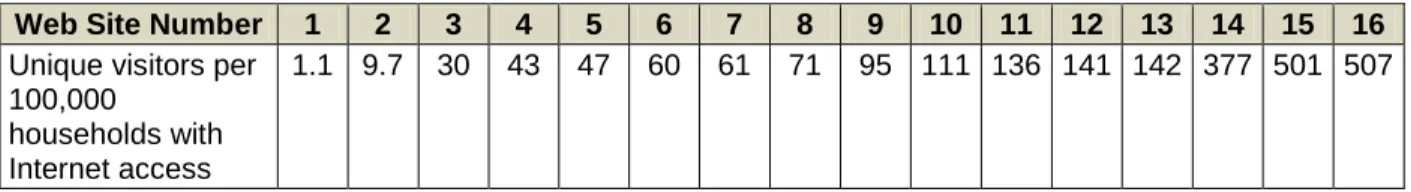
in Table 1 we present the number of visitors per 100,000 Internet-using households. This
population-adjusted figure still varied considerably across the participating sites.
Table 1. Unique visits to each Web site per 100,000 households with Internet access in the site’s geographic area
Web Site Number 1 2 3 4 5 6 7 8 9 10 11 12 13 14 15 16
Unique visitors per 100,000
households with Internet access
1.1 9.7 30 43 47 60 61 71 95 111 136 141 142 377 501 507
Note: The number of Internet-using households in each geographic area was obtained from the Centers for Disease Control and Prevention.
We analyzed sources of traffic in three broad categories: traffic from search engines (e.g.,
Google, Yahoo, Bing); referrals from another Web site (e.g., a link in an online newspaper
article); or direct entries of the Web site URL into the Internet browser bar or clicks on a direct
link in an email or word processed document.
To understand the search terms being used by visitors arriving by search, we analyzed the
keywords used to find the site and the frequency of use for any given search term. We first
reviewed a list of the 50 most commonly used search terms for visitors to each site (800 search
terms in total across the 16 sites) to identify categories of searches that occurred frequently. The
categories identified were searches for:
A hospital name,
A general search for quality information about hospitals, or
Other searches.
For each Web site, we then analyzed the top 50 search terms for that site and sorted them into
these categories.
The analytics also report on visits to site content, including the frequency with which each page
on the Web site is viewed. In an attempt to identify the most popular pages, we downloaded
information about the top 25 pages viewed for each Web site. However, many of the Web sites
did not structure their sites so that views of the hospital quality pages could be separately
identified from views of the home page or other more general pages. Since we could not identify
specific views of the hospital quality pages, we were not able to assess their popularity relative to
other pages or determine which of the hospital quality pages were most viewed.
We looked at bounce rate and absolute numbers of bounced visitors to assess visitor engagement
with the Web sites. Bounce rate is defined as the number of visitors who only viewed one page
of the Web site before leaving, divided by the number of visitors. Lower bounce rate is
considered a sign of higher visitor engagement. The analytics data also included metrics of
overall time spent on-site and average number of page views.
We only present bounce rate information because the other two metrics are potentially
misleading in comparisons across the different types of Web sites in the group. Some
participating Web sites report hospital information exclusively and others report hospital and
outpatient information. As a result, the combined reports may have longer times spent on-site
and higher page views than the hospital only reports, simply due to content presented rather than
due to higher visitor engagement with the site.
Survey
Survey Development
The primary aim of the survey was to provide information on report visitors‟ use and perceptions
of the public reporting Web sites. For those who agreed to take the survey, an initial survey
question determined respondent type: patient, friend or family member, health care professional,
employer, insurer, member of the media, researcher, patient advocate, foundation staff, lawyer,
or government staff/elected official. Next, the survey branched to questions and answer options
that were specific to the type of survey respondent.
The survey covered the following topics:
Overall experience on the Web site and usability of the site,
Purpose of the respondent‟s visit,
Topics or types of information of interest to the respondent,
Use of the information to choose a health care professional or change health care
professionals,
Suggestions for improving the report, and
Demographics.
The survey development team was: Naomi S. Bardach and R. Adams Dudley from the
University of California, San Francisco; Judith Hibbard from the University of Oregon; and
Peggy McNamara and Jan De La Mare from the Agency for Healthcare Research and Quality.
After assembling and analyzing a sample of existing online surveys from participating public
reporting Web sites, the survey team drafted the survey and vetted it with the participating report
sponsors. Subsequently, a series of cognitive interviews was done with 11 potential respondents,
including consumers, providers, an employer, and an insurer in order to improve interpretability
of the survey questions and response options. See
AHRQ‟s Hospital-Public Report (H-PR)
Survey
s.
Appendix B presents the questions asked of the patient, friend or family member, and health care
professional respondents, with statistics about responses aggregated across all participating Web
sites.
Survey Implementation
The invitation to take the survey popped up when site visitors arrived on pages of the public
report. The invitation interrupted the visitor Web site experience and usually occurred
before
the
visitor had seen any of the Web site, but the
survey itself
did not appear until
after
the Web site
visitor had concluded the visit and interaction with the Web site.
Report sponsors chose where the survey invitation popped up—some chose to have it open on
the first page of the Web site where a visitor arrived, some chose to have it open only on the
home page or on pages with hospital quality data, and others chose to have it open only on pages
with hospital quality data.
The survey took 2-4 minutes to complete during pilot testing, depending on the respondent type.
There were more questions for patient and friend or family member respondents (throughout the
report identified as “consumers”).
All survey respondents were asked about overall experience and how they rated the site in terms
of usability. In order to decrease the burden on consumer respondents, each consumer was asked
about only three of the five topics listed below, with the topics selected randomly for each
consumer.
This led to a smaller number of respondents (approximately 3/5 of all consumers
surveyed) for each of the following topics:
Purpose of their visit,
Topics of interest,
Plans for using the information,
Suggestions for improving the report, and
Demographics.
Interpretation of Survey Findings.
Because survey participation was voluntary, the
information from the surveys is not necessarily representative of all visitors to the site. For
instance, though we have information about the proportion of consumer and health care
respondents to the survey may be different than the proportion of physicians visiting the site.
However, in this report, we assume that the tendencies of certain populations to respond to
surveys are similar across Web sites, so comparisons among Web sites on metrics such as
proportions of consumer and health care professional respondents can tell a meaningful story.
For many of the questions, one of the answer options was “Other” and a write-in text box was
available. Qualitative analysis of these answers was completed and any write-in answer that fit
into one of the preset categories was placed in that category. Additional answer categories were
developed for themes that arose frequently.
Throughout the results, we combine the data for the patients and friends and family members in a
single group labeled “consumers.” We focus on the consumer and health care professional
responses in this report since the number of respondents in the other categories was limited, and
because consumers and health care professionals are, generally speaking, the major target
audiences for report sponsors. We report on the aggregate analysis results as well as patterns
among the individual Web sites. The consumer and health care professional perspectives were
analyzed at the individual Web site level only for Web sites with at least 20 consumer
respondents (n=5 sites, for consumer questions) and at least 15 health care professional
respondents (n=5 sites, for health care professional questions).
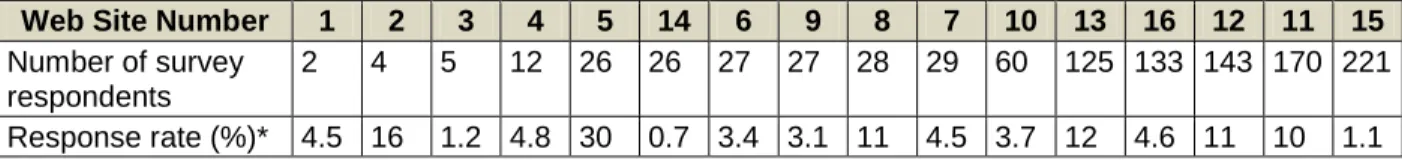
Survey Responses and Response Rates.
The total number of respondents to the survey for all
Web sites was 1,034. The number of respondents and response rates varied considerably across
the participating sites.
Table 2. Absolute number of survey respondents and response rate among visitors who viewed more than one page on the Web site
Web Site Number 1 2 3 4 5 14 6 9 8 7 10 13 16 12 11 15
Number of survey respondents
2 4 5 12 26 26 27 27 28 29 60 125 133 143 170 221
Response rate (%)* 4.5 16 1.2 4.8 30 0.7 3.4 3.1 11 4.5 3.7 12 4.6 11 10 1.1
* Response rate defined as number of surveys/number of visitors to the Web site that viewed more than one page.
Expert Review of Web Sites
Sponsors of public reporting Web sites make two basic decisions that determine how users
experience their data. First, they determine the path or paths available (the “clicks” that must be
made) to navigate to performance information. In addition, they choose how to display the
information once a visitor arrives at a page reporting quality data. There can be tremendous
variation in the decisions Web site sponsors make, and that variation may drive how easy it is to
use the Web sites to evaluate hospitals and identify the best.
In order to better understand the differences among participating Web sites, the investigators did
an indepth review of each Web site, assessing two groups of characteristics—straightforward
characteristics, such as whether visitors have to scroll down to get to quality information; and
characteristics that were subject to differences in judgment, such as whether the visual display of
performance metrics was inherently meaningful. The choice of characteristics to evaluate was
based on the available literature and investigator experience with public reporting.
The characteristics evaluated were defined as follows:
Can one select the hospitals for performance display? (yes/no)
Can one compare hospitals on one page? (yes/no)
Can one compare hospital performance to a benchmark? (yes/no)
Can one sort performance results by different criteria (e.g., sorting by hospital name and
also sorting by performance on a specific metric such as C-section rate)?
Are the metrics shown visually? (yes/no)
Is the visual display inherently meaningful? (1=inherently meaningful/very easy to
understand; 5=cannot be understood without a legend)
Is a composite measure used on the top page of quality information? (yes/no)
Are the performance metrics displayed using interpretive labels (e.g., “better,” “average,”
“worse”)? (yes/no)
Does the Web site use a framework to convey the elements of quality? (investigators
defined a framework as a conceptual grouping of measures in a way that helps visitors
understand what quality is, identifying the key elements of quality and then using those
elements as headings in the display; for example, “patient safety,” “effective care,”
“patient experience”) (yes/no)
Overall rating of the site‟s hospital quality information for evaluability (how easily and
quickly one can see better and worse options)? (1=very easy to evaluate; 5=very hard to
evaluate)
For all 1-5 scale questions, two investigators rated each Web site separately and then reconciled
any discrepant answers to arrive at a final score.
Section 2. Who Is Coming to the Web Sites?
Web site sponsors want to know who is visiting their Web site for a number of reasons. This
information identifies the current, de facto audience for a site. It also can help the sponsor assess
how well the Web site is attracting its target audiences. The information presented in this section
comes from the survey data.
Key Findings
There was a very wide range in number of visitors coming to the Web sites during the 3-month
period
. In population-adjusted terms, Web sites had from 1 to 507 unique visitors per 100,000
Internet-using households in their geographic area.
The Web sites seem to be reaching at least a portion of their primary target audiences
. The
participating CVEs all believe they are targeting consumers, health care professionals, or both,
and the survey data suggest that the large majority of visits come from these audiences. As
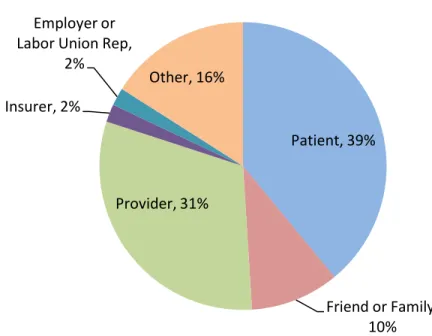
shown in Figure 1, almost half of survey respondents were consumers (49%). Almost a third of
respondents (31%) were health care professionals.
Figure 1. Respondents’ answers to the question, “What best describes you?”
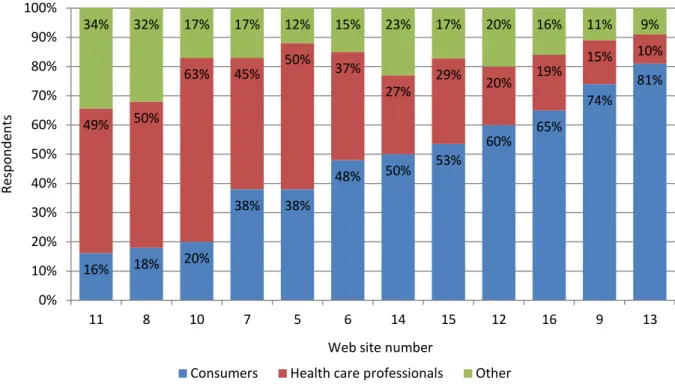
Sites vary dramatically in the extent to which they primarily attract consumers versus health
care professionals
. As shown in Figure 2, consumers as a percentage of all survey respondents
ranged from a low of 16 percent to a high of 81 percent. Health care professionals as a
percentage of all survey respondents ranged from a low of 10 percent to a high of 63 percent.
Patient, 39%
Friend or Family,
10%
Provider, 31%
Insurer, 2%
Employer or
Labor Union Rep,
2%
Other, 16%
Figure 2. Percentage of consumers, health care professionals, and others among Web site visitors
Note: The figure includes data only from the 12 Web sites with >25 survey responses. Individual site number corresponds to the site number from Table 1. Percentages may not add to 100 due to rounding.
The volume of traffic appears unrelated to whether the site is attracting primarily consumers or
health care professionals. For example, sites with a high proportion of consumer responses
included both high- and low-traffic Web sites.
There is a “most common user” profile among current consumer visitors.
Consumer respondents
were mostly 45-64 years old (57%) or 65 years old and over (26%) and most were women
(61%). The vast majority were white (90%), and most were well educated (64% with at least a 4
year college degree) and privately insured (67%).
Among health care professional respondents, there were approximately twice as many nurses or
nurse practitioners as physicians
. While the reasons for this pattern cannot be discerned from
our data, we hypothesize that physicians visit the sites more often than was captured in the
surveys. Physicians, as a group, may have a lower response rate to the survey than other visitors
to the sites. Table 3 shows the number of physician, nurse practitioner, and nurse respondents to
the survey at participating Web sites.
Table 3. Physician, nurse practitioner, and nurse respondents to the survey at participating Web sites Web Site Number 1 2 3 4 5 6 7 9 14 16 13 8 15 12 11 10 Physicians (n) 0 0 0 0 0 0 0 0 1 1 2 2 5 5 9 9 16% 18% 20% 38% 38% 48% 50% 53% 60% 65% 74% 81% 49% 50% 63% 45% 50% 37% 27% 29% 20% 19% 15% 10% 34% 32% 17% 17% 12% 15% 23% 17% 20% 16% 11% 9% 0% 10% 20% 30% 40% 50% 60% 70% 80% 90% 100% 11 8 10 7 5 6 14 15 12 16 9 13 Re sp o n d en ts
Web site number
There are very few Medicaid recipients among the survey respondents
. Only two participating
Web sites had any Medicaid recipients respond to the survey (Table 4). While we do not know
the reason, it could be in part that Medicaid recipients taking the survey did not recognize
“Medicaid” as their insurer since States often give Medicaid programs other names (e.g.,
Wisconsin Medicaid is called “BadgerCare”).
Table 4. Medicaid recipient respondents to the survey at participating Web sites
Web Site Number 1 2 3 4 5 6 7 8 9 10 11 12 13 14 16 15
Number of Medicaid-insured respondents
0 0 0 0 0 0 0 0 0 0 0 0 0 0 1 2
The number of consumer respondents who were age 65 or older varied among the sites
. Table 5
shows the variation among the sites in the number of consumer respondents who were 65 or
older. Only a random subset of consumers received the demographic questions, so the number of
responses here is low and the variation may not be statistically significant.
Table 5. Consumer respondents to the survey who were age 65 or older
Web Site Number 1 2 7 13 8 6 4 5 3 10 14 9 16 12 11 15
Number of respondents age 65 or older
0 0 1 1 1 1 2 2 3 3 3 5 8 9 12 19
Implications
Sites may wish to target, both through marketing and report design, a consumer audience
that they currently are not reaching. Potential audiences for further marketing include
younger adults (25-45 years of age), including women of childbearing age, friends or
family members of older adults, and minority groups. Medicaid clients are another key
audience that seems not to be using public reports currently. Persons with less education
were not well represented in the survey responses, and sites may wish to market to them
specifically.
Sites may wish to target and further engage the population segment that currently visits
Web sites: individuals 45 years of age or older who have a college education.
Section 3. How Do Visitors Arrive at the Web Sites and Who Stays?
Knowing more about how visitors arrive at the Web sites can guide efforts to increase Web site
traffic. Two useful traffic metrics from Web analytics are: overall traffic, represented by number
of unique visitors; and bounce rate, the percentage of visitors that view only one page before
leaving the Web site. Lower bounce rates indicate a more engaged audience. Overall traffic can
be tracked over time to assess how marketing or Web site changes affect traffic, and bounce rate
can be tracked to gauge fluctuations in visitor engagement.
Sources of overall Web site traffic fall into three broad categories: search (traffic from search
engines), referrals from a link on another Web site, or direct entries of the Web site URL into the
Internet browser bar or clicks on a direct link in an email or word processed document. Traffic
can be increased from each of these sources, but the methods of achieving those increases vary
by source.
Key Findings
There was wide variation in the proportion of traffic types for each Web site and in the numbers
of visitors arriving from each source. Table 6 shows the variation among the sites in traffic from
each source. Percentage of traffic arriving from searches ranged from 3 percent to 89 percent
among the sites, while percentage of traffic arriving via referrals ranged from 4 percent to 84
percent, and percentage of direct traffic ranged from 6 percent to 61 percent.
Sites with a higher percentage of search traffic also had higher total traffic. In large part, this is
because the maximum traffic generated through search (two sites had over 400 visitors per
100,000 Internet households from search) is much greater than the maximum traffic generated
through either referrals (maximum 122 visitors per 100,000 Internet households from referrals)
or direct access (maximum 80 visitors per 100,000 Internet households from direct).
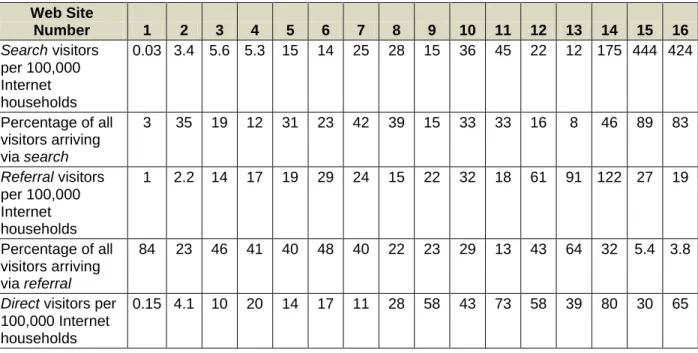
Table 6. Number and percentage of visitors from search, referral, or direct* sources Web Site Number 1 2 3 4 5 6 7 8 9 10 11 12 13 14 15 16 Search visitors per 100,000 Internet households 0.03 3.4 5.6 5.3 15 14 25 28 15 36 45 22 12 175 444 424 Percentage of all visitors arriving via search 3 35 19 12 31 23 42 39 15 33 33 16 8 46 89 83 Referral visitors per 100,000 Internet households 1 2.2 14 17 19 29 24 15 22 32 18 61 91 122 27 19 Percentage of all visitors arriving via referral 84 23 46 41 40 48 40 22 23 29 13 43 64 32 5.4 3.8
Web Site Number 1 2 3 4 5 6 7 8 9 10 11 12 13 14 15 16 Percentage of all visitors arriving directly 13 42 35 47 29 29 19 39 61 39 53 41 27 21 6 13
Note: Search is defined as traffic arriving from Web search engines (e.g., Google, Yahoo, Bing); referral is defined
as traffic arriving from a link on another Web site; and direct is defined as traffic arriving either by direct entry of
the Web site URL into a Web browser bar or clicks on a direct link to the Web site URL in an email or word processed document. Percentages may not add to 100 due to rounding.
Only half of the Web sites are structured to allow search engines or Web analytics programs to
identify hospital quality pages separately from the home page or other general pages. Web pages
are programmed with “meta tags.” These are not something visitors are likely to notice but are
used by search engines and Web analytics programs to identify page content. However, it is
possible to create a Web page in which the content can change (for example, from what looks
like a page about one hospital‟s quality to a page of another hospital‟s quality) without the meta
tag changing. If pages are created this way, search engines will not be able to find the content on
these pages, including any hospital or performance metric specific information.
If meta tags stay the same while content changes, the Web site sponsor will have negative
consequences. The search engine will not show the Web sites in the search results for any
specific content that has not been tagged, and the sponsor cannot use Web analytics to determine
which pages are most popular with visitors (that is, are viewed most often). In addition, higher
traffic Web sites were structured to change meta tags between separate content pages, suggesting
that doing so increases traffic in practice, not just in theory.
Most visitors using a search engine were searching for the Web site name itself or for a hospital
.
For most Web sites, the name of the Web site was the most common search by which visitors
arrived. Very few visitors arrived through a search for a medical condition (this figure varied
from 0% to 9% among the Web sites). In addition, few arrived through a search for “high quality
hospitals” or “hospital performance.”
Some site sponsors have successful partnerships that drive referral traffic
. For example, the Web
site that had the largest proportion of consumers (81% of survey respondents) also had a large
percentage of traffic (64%) from referral sources. The two top referral sources for the site were a
county government (“.gov”) Web site and the affiliate CVE Web site. This Web site also had a
few write-in comments about a health incentives program offered by one of its partners that
rewarded employees who visited the site. Not surprisingly, this site also had high overall traffic.
Implications
Many sites excel at garnering traffic from one source (search, referral, or direct), but no
site is at the top in all three sources. Therefore, all sites have opportunities to improve.
To date, improving search traffic has been the most effective method of increasing
overall traffic. Thus, search engine optimization is a critical activity for all Web site
sponsors.
It seems that there is limited competition for individual hospital names in search engines,
compared to medical condition searches. Making hospital names easy for search engines
to find through effective use of meta tags may be a good way to increase visits to a site.
Our findings suggest that focused marketing can increase traffic. Since many of the top
keyword searches are for the name of a specific site, it seems likely that many people
who search already know the site for which they are searching and are responding to
some form of marketing or advertising. This was true for sites that had high percentages
of consumers and for sites that had high percentages of health care professionals,
implying that marketing can increase traffic from either group. For consumers, this is
likely to be general marketing (such as radio campaigns, in which the consumer learns
the site name and types it into a search engine or browser bar). For health care
professionals, direct traffic can be increased through list serves or other electronic means
of sharing the link to the site, or through distribution of documents that contain the link.
Conversely, our findings suggest that content about specific diseases (medical terms and
conditions) does not generate much search engine traffic on these Web sites.
o
This could be because people are not searching online for information about diseases
very often. Much more likely, vigorous online competition for the market segment of
consumers with specific diseases means that public reports of quality do poorly
compared to other sites on searches for these terms.
o
It remains to be seen whether public reporting Web sites could compete more
effectively for these searches if they improved search engine optimization.
Collaborative work with other organizations can increase a Web site‟s traffic and help
gain footing in a targeted market.
There is evidence from one Web site that incentives work to get individuals to view
hospital quality information.
Section 4. Visitors’ Overall Ratings of the Web Sites
To determine how satisfied consumers and health care professionals are with the Web sites, we
analyzed the bounce rate from Web analytics along with results of the following five survey
questions:
How would you rate your
experience
using the Web site? (0=Poor; 10=Excellent)
How easy was it to
use
the Web site? (for example, not too many clicks, easy to search
the Web site) (0=Very difficult; 10=Very easy)
What was the
primary purpose
of your visit to the Web site today?
Were you
able to accomplish the primary purpose
of your visit? (Definitely, Mostly,
Only partially, Not at all)
How likely are you to
use the Web site information
now to choose a hospital or change
hospitals? (Definitely, Mostly, Only partially, Not at all).
One key indicator was the average rating for overall satisfaction, as measured in the
“Experience” question above. A second indicator was the average rating for overall usability, as
measured in the “Usability” question above. The third indicator combined the next two
questions. It was calculated as the percentage of respondents able to accomplish their primary
purpose, among those whose primary purpose was to choose or compare hospitals or see the
performance of a specific hospital.
Last, the likelihood of using the information to choose a hospital or change hospitals is an
indicator of consumer engagement with site content. For exact text of the survey questions,
response options, and data about answers by respondent type (patient, friend or family member,
or health care professional), see Appendix B.
Key Findings
Overall satisfaction varied considerably among the sites.
Among the 1,034 respondents from all
Web sites, the mean overall satisfaction score, rated on a scale of 0-10, was 6.84 (the median was
7). Overall scores for individual Web sites (among those with at least 25 survey responses)
ranged from a mean of 4.8 to 7.43.
Satisfaction was lower among consumer visitors than among health care professionals
. The
mean satisfaction score among consumers (n=438) was 6.38, with a range among individual Web
sites with at least 20 consumer respondents of 5.67 to 7.36. The mean for health care
professionals (n=294) was 7.35, with a range for individual Web sites with at least 15 health care
professional respondents of 7.23 to 8.5.
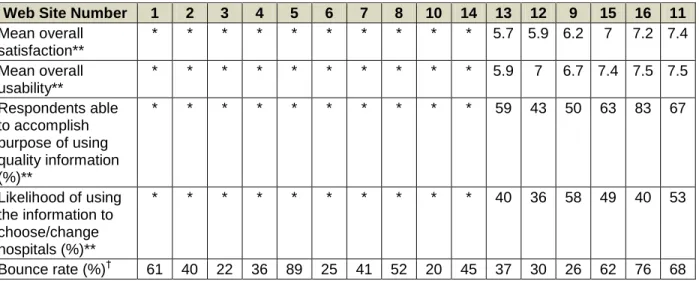
Overall usability scores varied considerably among the sites.
On a scale of 0-10, all respondents
across all Web sites (n=1,034) gave the sites a mean usability score (that is, how easy it was to
use the Web site) of 7.21 (the median was 8). Mean overall ratings for individual Web sites
ranged from 5.24 to 8.0 among Web sites with at least 25 survey responses.
Usability scores were lower among consumer visitors than among health care professionals
.
Consumers gave lower usability scores (mean of 6.83; range among sites with at least 20
consumer respondents: 5.9-7.5; see Table 7) than health care professionals (mean of 7.67; range
among sites with at least 15 health care professional respondents: 7.4-8.6; see Table 8).
Table 7. Indicators of Web site experience for consumers from survey data and for all visitors from analytics data
Web Site Number 1 2 3 4 5 6 7 8 10 14 13 12 9 15 16 11
Mean overall satisfaction** * * * * * * * * * * 5.7 5.9 6.2 7 7.2 7.4 Mean overall usability** * * * * * * * * * * 5.9 7 6.7 7.4 7.5 7.5 Respondents able to accomplish purpose of using quality information (%)** * * * * * * * * * * 59 43 50 63 83 67 Likelihood of using the information to choose/change hospitals (%)** * * * * * * * * * * 40 36 58 49 40 53 Bounce rate (%)† 61 40 22 36 89 25 41 52 20 45 37 30 26 62 76 68
* These Web sites had fewer than 20 consumer respondents and so are not reported on.
** From survey data. Definition of “Purpose of using quality information” for consumers was choosing one of the following primary purposes: “Choose or compare hospitals” or “See how good a specific hospital is.”
† From analytics data. Bounce rate refers to the proportion of visitors to the Web site that leave after viewing a
single page. Lower numbers indicate a more engaged audience.
Table 8. Indicators of Web site experience for health care professionals from survey data and for all visitors from analytics data
Web Site Number 1 2 3 4 5 6 7 8 9 13 14 15 11 12 10 16
Mean overall satisfaction** * * * * * * * * * * * 7.2 7.3 7.3 7.6 8.5 Mean overall usability** * * * * * * * * * * * 7.8 7.4 8 8 8.6 Respondents able to accomplish purpose of using quality information (%)** * * * * * * * * * * * 75 69 75 90 86 Bounce rate† 61 40 22 36 89 25 41 51 26 37 45 62 68 30 20 76
* These Web sites had fewer than 15 health care professional respondents and so are not reported on.
** From survey data. Definition of “Purpose of using quality information” for health care professionals was having one of the following primary purposes: “Choose or compare hospitals” or “See how my hospital is performing” or “Choose a hospital for patient referral” or “Choose a hospital for myself.”
† From analytics data. Bounce rate refers to the proportion of visitors to the Web site that leave after viewing a
single page. Lower numbers indicate a more engaged audience.
Some consumers are using the data for hospital selection
. Although the satisfaction and usability
scores suggest that consumers can find the data hard to use, 44 percent of consumers (n=128)
reported that they were “likely” or “very likely” to use the data to choose a hospital or change
hospital or change hospitals (n=36), 75 percent reported that they were likely or very likely to do
so.
Implications
Web sites are currently serving health care professional respondents better than consumer
respondents on several key metrics: overall satisfaction ratings, usability ratings, and
ability to accomplish the primary purpose of a visit among those whose primary purpose
was to choose a hospital, compare hospitals, or see the performance of a specific hospital.
The wide range of consumer and health care professional satisfaction and usability scores
indicates that these groups find some Web sites easier to use than others, implying that
Web sites with lower scores may be able to improve.
Section 7
includes further
discussion of how to potentially improve the Web sites for all visitors, and specifically
for consumers.
Most published research has suggested that public reports have more impact on health
care professional behavior than consumer behavior.
iHowever, our findings suggest that
the Web sites are succeeding in serving some consumers who are seeking quality
information for the purpose of hospital selection.
i Fung CH, Lim YW, Mattke S, et al. Systematic review: the evidence that publishing patient care performance data
Section 5. Consumers’ Feedback
Understanding why visitors come to the sites enables report sponsors to better meet the needs of
visitors. We report on consumers in this section and on health care professionals in
Section 6
.
Key Findings
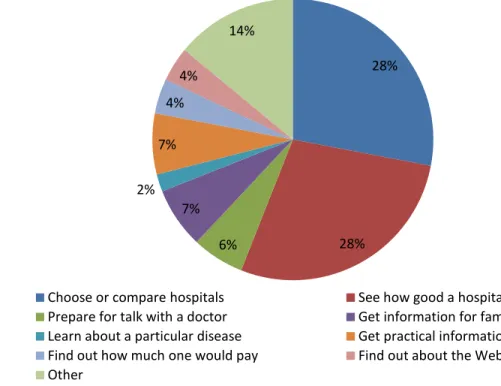
Most consumers arrive at the Web sites to look at hospital quality information
. Most consumers
(56%) arrived at the sites either to choose or compare hospitals or to see how a hospital they
were using was performing. Some consumers came for purposes such as getting practical
information about the hospital (7%) or to prepare for a talk with their doctor (6%).
Figure 3. Consumers’ primary purposes for visiting the Web sites (n=231)
Few consumers are coming to the Web sites primarily for information on cost of care or for
education about their disease
. Only 4 percent of consumers came for information about how
much one would pay and only 2 percent for information about a particular disease.
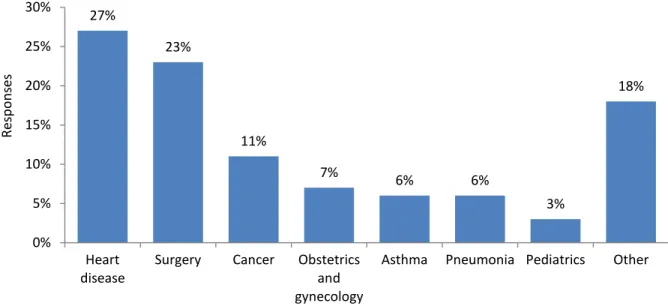
Consumers are interested in performance measures about heart disease care and surgery
. Figure
4 shows the medical conditions or procedures of interest for consumer visitors.
28% 28% 6% 7% 2% 7% 4% 4% 14%
Choose or compare hospitals See how good a hospital is
Prepare for talk with a doctor Get information for family or friends Learn about a particular disease Get practical information about a hospital Find out how much one would pay Find out about the Web site
Figure 4. Medical conditions or procedures of interest for consumers (n=260)
Consumers are interested in many types of quality information
. Consumers were interested in
patient experience (26%), complication and error rates (21%), and rates of correct care (21%).
Consumers reported less interest in survival rates (11%) than complication and error rates. This
is surprising, since the literature suggests that complications and errors can increase mortality,
and death is a severe negative consequence of an error. It may be that consumers do not realize
that hospital mistakes can have an impact on mortality rates.
Figure 5. Quality measures of interest to consumers (n=478)
27% 23% 11% 7% 6% 6% 3% 18% 0% 5% 10% 15% 20% 25% 30% Heart disease
Surgery Cancer Obstetrics and gynecology
Asthma Pneumonia Pediatrics Other
Re sp o n se s 26% 21% 21% 16% 11% 6% 0% 5% 10% 15% 20% 25% 30% Patient experience Complication and error rate
Correct care given
Infection rate Survival rate Other
Re sp o n se s
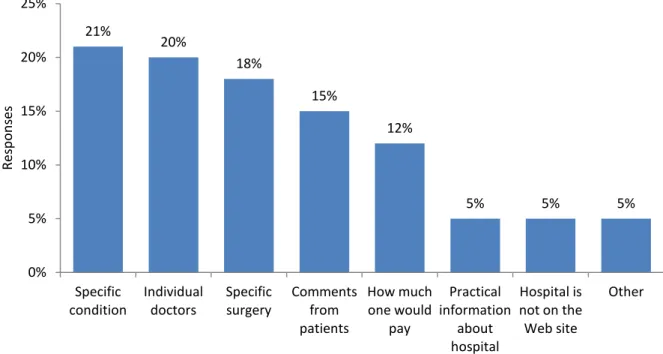
Consumers want more information about how well hospitals treat their conditions and
information about hospital doctors
. As Figure 6 shows, the top areas in which consumers would
like more information are how well hospitals treat their specific condition (21%) or perform their
specific surgery (18%) and data on individual doctors working in the hospital (20%).
Respondents also expressed interest in patient comments (15%) and how much one would pay
for care (12%).
Figure 6. Additional information consumers would like the Web sites to include (n=537)
Note: Answer option wording was as follows: How well the hospital treats my specific medical condition, How well the hospital does specific surgery or procedure, How much I would pay, Practical aspects of the hospital (for example, phone number, location), Comments from people who have been patients at the hospital, Hospitals that are not currently on the Web site, Individual doctors within a hospital, Other.
Consumers had many suggestions for how to improve the Web sites
. As Figure 7 shows,
consumers wanted the sites to provide additional ways of sorting information (23%) and to make
it easier to find the best hospital (19%). Specific comments indicated a desire to compare
hospitals side by side on one page (some Web sites only present information on one hospital at a
time). Consumers also wanted to be able to select only one or two hospitals to review at a time
(some Web sites present information on a preset group of hospitals, often all the hospitals in the
report at once).
21% 20% 18% 15% 12% 5% 5% 5% 0% 5% 10% 15% 20% 25% Specific condition Individual doctors Specific surgery Comments from patients How much one would pay Practical information about hospital Hospital is not on the Web site Other Res p o n sesFigure 7. What would make the Web sites easier to use for consumers (n=214)
Implications
A substantial proportion of consumers were looking for information that was not present,
such as information about how well hospitals treat their conditions and information about
their individual doctors or inclusion of patient comments. Including this missing
information, to the extent it is consistent with the Web site‟s overall mission, may prove
to be an important strategy for consumer engagement.
It is not clear whether Web sites could increase traffic by providing information on cost
of care.
Several categories of greatest interest to consumers (surgery, cancer, obstetric and
gynecologic care, and heart disease care) involve conditions or procedures about which
consumers would have time to think about their decision and use hospital quality data to
make a choice. Elective procedures or care may be good areas of focus for enhancing
report content and usability.
To address consumers‟ perceptions that survival rates are unimportant, it may be helpful
to restate the concept of “survival” as “avoidable deaths” or in some other way clarify
that hospital quality can affect a patient‟s risk of mortality.
Some consumers find it difficult to use the Web sites to find the best hospitals. Web sites
could adopt some specific actionable recommendations consumers made, including
allowing side-by-side comparisons of hospitals rather than showing information one
hospital at a time. They also could allow selection of individual hospitals to review rather
than showing all hospitals or a predetermined selection.
Section 7
discusses Web site
characteristics that may support consumer use of quality information.
23% 19% 17% 16% 15% 10% 0% 5% 10% 15% 20% 25% Different way of sorting Make it easier to find best hospital Make information easier to understand Different way of searching
Fewer clicks Other
Re sp o n se s
Section 6. Health Care Professionals’ Feedback
While some sites may target consumers, others may choose a primary target audience of health
care professionals. In this section, we review survey data from this group.
Key Findings
Most health care professionals arrive at the Web sites to look at hospital quality information
. As
Figure 8 shows, most health care professionals (52%) indicated that their primary purpose in
visiting the sites was either to see how their hospital was performing or to compare hospitals.
Figure 8. Health care professionals' primary purposes for visiting the Web sites (n=273)
Few health care professionals indicated they were in search of information to use in making a
referral for a patient
. Overall, only 5 percent of health care professionals indicated that this was
their primary purpose. However, on one Web site (which had 56 health care professional survey
respondents), 13 percent of health care professionals indicated they had come to make a referral.
There were few physician respondents
. As Table 9 shows, overall, only 13 percent of health care
professional respondents were physicians. There could be several reasons for this. For example,
some public reporting Web sites have a private report that is provided to hospitals, with more
technical language and patient-level detail.
20% 32% 5% 3% 6% 8% 4% 3% 19%
See how my hospital is performing Compare hospitals
Choose a hospital for patient referral Choose a hospital for myself Get practical hospital information Find out about the Web site Work on an academic project Quality improvement purpose Other
Table 9. Health care professional respondents (n=255) by type Type of health care professional Number (percent)
Physician 34 (13%) Nurse practitioner 17 (7%) Nurse 40 (16%) Executive 52 (20%) Quality manager 52 (20%) Administration 20 (8%) Other 40 (16%)
Note: This question allowed the respondent to choose more than one answer, leading to a potentially greater number of responses than respondents for this question.
Health care professionals recommend giving consumers more information about costs and
individual doctors
. As Figure 9 shows, health care professionals most frequently recommended
providing information on cost of care to patients (17%). In addition, 11 percent recommended
providing information about individual doctors.
Figure 9. Additional information health care professionals would like the Web sites to include (n=508)
Health care professionals want more quality information
. Health care professionals frequently
recommended providing more quality data than is currently available, including providing other
quality measures (15%), information about methodology (15%), and more detailed metrics
(15%).
Health care professionals had many suggestions for how to improve the Web sites
. As Figure 10
shows, health care professionals, like consumers, wanted the sites to be easier to use. Health care
professionals most frequently suggested that Web sites require fewer clicks to navigate to
performance information (24%) and provide a different way of sorting (20%).
17% 15% 15% 15% 12% 11% 6% 7% 0% 5% 10% 15% 20% Re sp o n se s
Figure 10. What would make the Web sites easier to use for health care professionals (n=216)
Implications
For report sponsors who aim to have health care professionals use their sites to make
referrals to hospitals, the consumer demographics from this survey might inform those
efforts. Health care professionals may be able to direct patients who match the “the most
common user profile” for the consumer survey respondents (e.g., college educated,
privately insured) to the reports to review hospitals. However, health care professionals
may need to access and interpret the reports for other patients who do not match this
demographic, including more vulnerable populations.
The desire of health care professionals to have more information about methodology and
details of quality measurement may conflict with the needs of consumers for sites that are
easier to understand. Thus, although many sites seem to be trying to serve both audiences
(and many are currently drawing both audiences), Web site sponsors might consider
setting up separate Web sites for each audience.
Even for most health care professionals, the Web sites are hard to use.
Section 7
discusses Web site characteristics that may support health care professional use of the
quality information.
24% 20% 15% 14% 10% 16% 0% 5% 10% 15% 20% 25% 30%Fewer clicks Different way of sorting Make it easier to find best hospital Different way of searching Make information easier to understand Other Re sp o n se s