Proceedings of the 2011 International Conference on Industrial Engineering and Operations Management Kuala Lumpur, Malaysia, January 22 – 24, 2011
Developing Collaborative Key Performance Indicators for
Manufacturing Collaboration
JinSung Lee, Ji Whan Jung, Sang-Kuk Kim, and Jae-Yoon Jung
Department of Industrial and Management System Engineering
Kyung Hee University, Yongin-si, Gyeonggi-do, 446-701, Republic of Korea
Abstract
To effectively maintain collaboration, the development of effective performance measures is requisite to successful collaboration. In our paper, the indicators are developed to measure collaboration performance of multiple manufacturing partners on the basis of the Supply Chain Operations Reference (SCOR) model. The partners who participate in collaboration can arrange and compromise with the collaborative key performance indicators, called cKPI. Also, a modified sigmoid function is proposed as a desirability function to reflect characteristics of Service Level Agreement (SLA) contracted between the partners. The performance indicators and the desirability function can provide a way to the quantitative measurement of collaboration performance.
Keywords
Manufacturing collaboration, performance measure, collaborative key performance indicators, desirability function
1. Introduction
One of the important changes in the manufacturing industry is that competition between individual companies has been expanded to competition between the networks surrounding the companies [1]. The reason is that the comparative advantage of a modern manufacturing company is decided by the results of manufacturing collaboration in the virtual enterprise network such as supply chain. Most existing performance measures however were developed to evaluate performance of internal activities or outsourcing in perspective of a single company. Moreover, certain performance indicators like trading costs sometimes come into conflict between two partners. As a result, it is necessary to develop new performance measures that collaboration partners can arrange and compromise with each other to reflect their common interests.
In this paper, we first proposed collaborative Key Performance Indicators (cKPIs) which could be used to measure collaboration of multiple manufacturing partners based on the SCOR standard model. cKPIs were developed to consolidate important KPIs of individual partners. They were calculated from the values of KPIs leveraging the collaborative processes. The SCOR model provides several levels of performance metrics in supply chain, which are good candidates for collaboration performance indicators. Also, we developed a modified sigmoid function to reflect and check the characteristics of Service Level Agreements (SLA), which are often contracted between participating companies. To achieve the synthetic satisfaction of collaboration results, the modified sigmoid function can partially overcome the limits of the desirability functions which are used to combine multiple responses into one response from 0 to 1.
This paper is organized as follows. We first introduce the background of our research in Section 2. The framework of manufacturing collaboration performance management is explained based on SCOR model and cKPI in Section 3. Subsequently, how to measure the performance indicators of manufacturing collaboration and how to integrate them into the synthetic satisfaction are described in Section 4. Section 5 conclusions the paper.
2. Background
2.1 i-manufacturing Project for Manufacturing Innovation
The i-manufacturing is the innovative project of supporting collaboration network for manufacturing partners from product planning to development, design, purchase, production, and service. The project has been performed since 2005, and about 400 small and medium manufacturing companies are currently using the i-manufacturing systems. So they have an effect on cost reduction and productivity increase [2]. The project has four kinds of key challenges:
information innovation, manufacturing process innovation, manufacturing system innovation, and new product development innovation [3].
KITEC is recently building Collaboration Hub 2.0 by adding process design and management functions for improvement of the system. This research was performed to suggest performance measurement and analysis in manufacturing collaboration.
Mfg. S ys tem Th eory Mfg. S ys tem Op era tion Mfg. S ys In n o vatio n & IT C on v.
•M fg. System M odeling & Analysis •M fg. System Cont rol M onitoring. HM I •Product ion Planning and Scheduling •M fg. System Optimizat ion. etc.
•IT/UT/N T/BT Applicat ion and Innovat ion Technology In M fg. System •M et hodology and Str at egic Planning •N ovel M fg. tech. In the N ear Future •Theory on N ormal M fg. Sys. M odels
•CIM , FM S, Agile M fg. System. IM S. HM S. BM S. Et c.
•Fractal M anufact ur ing Syst em (FrM S) Research on Fract al M anufacturing System
•Fr actal/Holonic/Biological M fg. System
•Architecture of next-gener ation M fg. Systems
•M fg. System Oper ation Srategies
Self-reconfigurable M fg. System (FrM S)
Innovation on M fg Processes and Systems
•Technologies for M anufactur ing Pr ocesses
•Technologies for M anufacturing Systems In Cyber manufactur ing environment
•Applying IT in M fg. and Spreading Strategies
M anufacturing System Innovation (i-M anufacturing)
Development of N ext-generation M anufacturing Systems and Technologies for manufacturing Innovation
Academic Research Projects Practical Application
Figure 1: Outline of the i-manufacturing project [2]
2.2 Collaboration Performance Indicators
Wheelwright and Bowen presented SCM performance indicators including cost, quality, delivery period, and flexibility [4]. Gill and Abend proposed distribution efficiency, cost reduction of supply chain, reduction of inventory, and reduction of lead time [5]. Guinipero insisted that the evaluation criteria for service providers is changing from traditional indicators such as on-time delivery rate, error rate, cost reduction rate, and cycle time into extended indicators aspect such as new part development rate, total cost reduction, and total processing time reduction [6]. Shin et al. suggested that measures of provider performance include lead time, timely delivery, reliability of delivery, quality, and cost. They also suggested that measures of buyer performance include quality, delivery, cost, and flexibility [7]. Peter and Thomas combined main goals of SCM with BSC (Balanced Scorecard) for performance evaluation of supply chain [8]. Min and Park introduced performance measurement of supply chain and systemized the measures by using the SCOR model [9].
2.3 Desirability Function
Desirability functions convert satisfaction of measured values into values of 0 to 1. Kim and Lin proposed a non-linear desirability function based on an exponential function [10]. The desirability can be calculated from response variables as follows:
0
|,
|
1
0
,
)
(
1 | |t
if
z
t
if
z
d
t z t t e e e (1)It is assumed that the response variables are classified into LTB (Lager-The-Better), STB (Small-The-Better), and NTB (Normal-The-Best). To measure desirability of three types of response variables, zvalue is first calculated by using the response value Y with the maximum, minimum, and target response values, noted Ymax, Ymax, and T,
respectively [10].
max max min
min max min
max max
(
) /(
)
(
) /(
)
(
) /(
) (
) /(
)
Y
Y
Y
Y
if Y is LTB
z
Y Y
Y
Y
if Y is STB
Y T
Y
T
Y T
Y
T if Y is NTB
(2)Unfortunately, it has difficulty in adopting the desirability function as a performance measure of supply chain due to two reasons. First, typical performance indicators do not have Ymax, Ymin, and Tvalues, or the values are not nearly
meaningful. Second, the desirability function cannot reflect the criteria of performance indicators, which are often used in contracts with partners, so-called SLA. From the reasons, we devised a new desirability function for the collaboration in Section 4.
3. Collaborative Process Performance Management
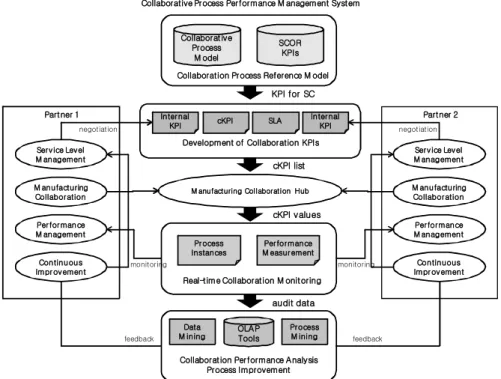
3.1 FrameworkThe framework of collaborative process performance management includes development of cKPIs, real-time collaboration process monitoring and reporting, and collaborative process performance analysis. cKPI is the performance indicator that combines KPIs of individual companies.
(1) Development of cKPIs: The product data is often shared in collaborative manufacturing environment. However, performance indicators and their improvement are generally managed only within individual companies. To overcome the limits, we propose the notion of cKPIs for collaboration performance management. If all parties in the collaboration effectively measure and manage the shared cKPIs in their manufacturing collaboration, they can continuously improve and strengthen competitiveness of their collaboration for their common goals.
(2) Real-time collaboration process monitoring and reporting: Based on the derived cKPIs, real-time collaboration can be monitored and reported to maintain their ongoing collaboration processes.
(3) Collaborative process performance analysis: It provides functions of process analysis to mutually improve the performances of the partners in collaboration by analyzing the measured values of cKPIs.
Collaborative Process
M odel
SCOR KPIs Collaboration Process Reference M odel
Inter nal
KPI cKPI SLA
Inter nal KPI Development of Collaboration KPIs
M anufacturing Collaboration Hub
Real-time Collaboration M onitoring Pr ocess
Instances
Performance M easur ement
Collaboration Performance Analysis Process Improvement Data M ining Process M ining OLA P Tools Ser vice Level
M anagement M anufacturing Collaboration Perfor mance M anagement Continuous Impr ovement Partner 1 KPI for SC cKPI list cKPI values audit data
Ser vice Level M anagement M anufacturing Collaboration Performance M anagement Continuous Impr ovement Partner 2 negotiation monitoring negotiation monitoring feedback feedback
Collaborative Process Performance M anagement System
Figure 2: Collaboration process performance management framework
3.2 Supply Chain Performance Management
SCOR model provides a reference of supply chain processes and the metrics. It contains five generic processes for supply chain (plan, source, make, deliver and return), and it also provides structured performance indicators for each process. In the model, supply chain performances are measured to balance a high level of performance indicators, which include reliability, flexibility and responsiveness, cost, and asset. SCOR model designs the supply chain by adjusting overall goals of supply chain and measures performance [11].
SCOR model suggests the process reference model hierarchically Level 1 to 3. For example, Level 2 includes forty performance indicators. In this research, we derived cKPIs of manufacturing collaboration processes from the performance indicators of Level 2 in SCOR model version 8.
Table 1: Example of cKPIs derived from metrics in SCOR model
Process of SCOR Level 2 Metric of SCOR Level 2 Derived cKPI ER.2. Manage performance of
return processes
Manage performance of return Processes cycle time
Part design change cycle time SR.3. Source return excess product Total excess material return Numbers of design change requests R.1. Return defective product % Return Rate of change request approval DR.1. Deliver return defective
product
Cost to authorize defective Product return
Loss cost by design change
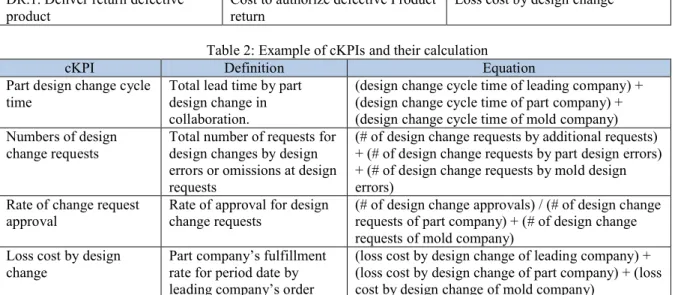
Table 2: Example of cKPIs and their calculation
cKPI Definition Equation
Part design change cycle time
Total lead time by part design change in collaboration.
(design change cycle time of leading company) + (design change cycle time of part company) + (design change cycle time of mold company) Numbers of design
change requests
Total number of requests for design changes by design errors or omissions at design requests
(# of design change requests by additional requests) + (# of design change requests by part design errors) + (# of design change requests by mold design errors)
Rate of change request approval
Rate of approval for design change requests
(# of design change approvals) / (# of design change requests of part company) + (# of design change requests of mold company)
Loss cost by design change
Part company’s fulfillment rate for period date by leading company’s order
(loss cost by design change of leading company) + (loss cost by design change of part company) + (loss cost by design change of mold company)
4. Performance Measurement of Manufacturing Collaboration
In this section, we explain how to measure the performance of manufacturing collaboration and satisfaction measurement. cKPIs which are described in Section 2 are used for the performance indicators. Figure 3 shows an example of manufacturing collaboration processes in the i-manufacturing project, which represents a collaborative process for design changes of car parts.
Figure 3: An example of manufacturing collaboration process and cKPIs
4.1 Desirability Function of cKPI
SLA describes the level of service quality. If the service provider does not satisfy the agreement, penalty is imposed to the provider on the basis of SLA. In this research, a modified sigmoid function is introduced to reflect sensitivity around critical value s, which is the criterion of service level described in the agreement. Logistic or Gompertz function is generally used to represent the sigmoid function as follows:
( 5)
1
( )
1
t xd x
e
(5)( )
bectd x
ae
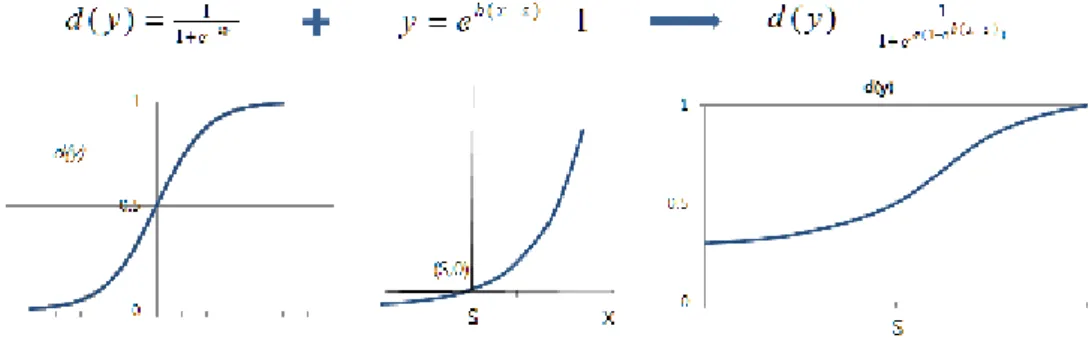
(6) In this research, we adopted the logistic function because the function does not require Ymaxand Yminvalues and itcan also transform the desirability to the values from 0 to 1. Focusing on critical value sof SLA, we developed a new desirability function to differentiate affection when is the criteria over and criteria down.
As shown in Figure 4, as coefficient aof the logistic function increases, the slope gets stiff. It means that penalty rate of the contract becomes bigger. Also, as coefficient b increases, the slope of the exponential function turns stiffer. It means that the difference between the less and greater parts than s goes bigger. Figure 4 depicts the desirability functiond(y) that combines two functions around critical value s.
Figure 4: Desirability function that combined logistic function with exponential function
4.2 Total Performance Satisfaction Measure
Figure 3 is the example of collaborative design change process. cKPIs were derived from the example, and they include LTB and STB. The example of LTB is the rate of change request approval. The example of STB is the cycle time of design change. To measure performance of collaboration from the proposed cKPI, we gathered parameters of performance indicators and the measured values of each partner. Table 3 shows the values of KPIs, which are used to calculate cKPI.
Table 3: KPIs and their values of partners in example collaboration
Partner KPI Type Measured value
Leading company
design change cycle time of leading company STB 2 # of design change requests by additional requests STB 1
# of design change approvals LTB 3
loss cost by design change of leading company STB 100 Part company
design change cycle time of part company STB 5 # of design change requests by part design errors STB 2 # of design change requests of part company STB 2 loss cost by design change of part company STB 200 Mold company
design change cycle time of mold company STB 2 # of design change requests by mold design errors STB 1 # of design change requests of mold company STB 1 loss cost by design change of mold company STB 200
Table 4: cKPIs and the satisfaction of example collaboration
cKPI Value Parameters Interview Satisfaction
x Type s a b d(y) w
Part design change cycle time 9 STB 10 days 2 1 0.78 0.3 Numbers of design change requests 4 STB 5 1 1 0.65 0.2 Rate of change request approval 1 LTB 0.8 1 1 0.46 0.2 Loss cost by Design change 500 STB \ 800 2 1 0.88 0.3
Table 4 shows the progress of calculating the values of cKPIs and measuring the satisfaction of the example collaborative process illustrated in Figure 3. The values of cKPIs are calculated from those of KPIs in Table 3 by using the equations in Table 2.
about total performance satisfaction of manufacturing collaboration using desirability function derived from section 4.1.
Feature values a and b of desirability functions can be derived through interviews to experts. The values of satisfaction functions d(y) are calculated by the modified sigmoid desirability function. Finally, the values of satisfaction functions of cKPIs are calculated to obtain the synthetic satisfaction of the collaboration D by considering weights wi. The values weights can be acquired by interviews to the experts.
wd w d wkdk wj D ( 1 1 2 2 ... ) / (7) For the example process, the satisfaction of manufacturing collaboration is calculated to 0.720.5. Conclusion
The existing studies on performance management mainly focus on tasks of a single company or outsourcing in viewpoint of a client company. Such performance measures cannot be adopted for the collaborative work since performance indicators often have conflicts between service providers and clients. As a result, we proposed a methodology of measuring the collaborative performance and the synthetic satisfaction of manufacturing collaboration.
In our research, the SCOR model is used to derive cKPIs, which are calculated from the KPIs of each partner. And, the desirability function of measuring satisfactions of cKPIs is devised by combining the logistic function and the exponential function so thatYmaxor Yminof cKPI do not need to be considered. Finally, a method of obtaining the
synthetic satisfaction of collaboration is proposed from the values of cKPIs. The proposed methodology of calculating the collaborative performances and the synthetic satisfaction of collaboration can be utilized for the purpose of maintaining and improving the collaboration which is performed by multiple partners.
Acknowledgements
This work was supported by the i-manufacturing program funded by the Ministry of Knowledge Economy (MKE, Korea).
References
1. National Information Society Agency, 2001, “A Study on the e-Collaboration in Value Chain, ” NISA report.
2. i-Manufacturing portal site, Korea Institute of Industrial Technology, http://www.i-mfg.com/.
3. Lee, S. W., 2007, “Manufacturing collaboration hub: i-manufacturing project,” Journal of the KSME, 47(4), 45-51.
4. Koppelmann, U., 1996, Grundsatzliche Uberlegugen zum Outsourcing, Stuttgart: Schaeffer-Poeschel, 1-9. 5. Gill, P., and Abend, J., 1997, “Wal-Mart: The supply chain heavyweight champ,” Supply Chain
Management Review, 1(1), 8-16.
6. Guinipero, L. 1995, “Purchasing’s Perception of Supply chain Management’s Benefits,” CAPS Report, NAPM.
7. Shin, H., Collier, D. A., and Wilson, D. D., 2000m, “Supply management orientation and supplier/buyer performance,” Journal of Operations Management, 18(3), 317-333.
8. Peter, C. B., and Thomas, W. S., 2000, “Using the balanced scorecard to measure supply chain performance,” Journal of Business Logistics, 21(1), 467-483.
9. Min, D.G., and Park, J. D., 2003, “Development of a Performance-Based Supply Chain Management System,” IE Interface, 16(3), 167-173.
10. Kim, K. J., and Dennis K. J. Lin, 2000, “Simultaneous optimization of mechanical properties of steel by maximizing exponential desirability functions,” Applied Statistics, 49(3), 211-325.
![Figure 1: Outline of the i-manufacturing project [2]](https://thumb-us.123doks.com/thumbv2/123dok_us/8731642.2365357/2.892.213.673.267.535/figure-outline-of-the-i-manufacturing-project.webp)