UNJP/VIE/037/UNJ
“Strengthening Capacities to Enhance Coordinated and Integrated
Disaster Risk Reduction Actions and Adaptation to Climate Change in
Agriculture in the Northern Mountain Regions of Viet Nam”
Climate Change Impacts on Agriculture in Vietnam
1
The designations employed and the presentation of material in this
information product do not imply the expression of any opinion whatsoever
on the part of the Food and Agriculture Organization of the United Nations
(FAO) concerning the legal or development status of any country, territory,
city or area or of its authorities, or concerning the delimitation of its frontiers
or boundaries. The mention of specific companies or products of
manufacturers, whether or not these have been patented, does not imply that
these have been endorsed or recommended by FAO in preference to others of
a similar nature that are not mentioned. The views expressed in this
information product are those of the author(s) and do not necessarily reflect
the views of FAO.
2
Table of Contents
1. Climate change manifestation and climate change scenarios for Viet Nam………..1
1.1. Climate change manifestation 1.2. Climate change scenarios
1.2.1. Temperature 1.2.2. Rainfall 1.2.3. Sea-level rise
2. Possible impacts of climate change on agriculture………..7
2.1. Impacts on agrometeorology 2.2. Impacts on crop growth rate 2.3. Impacts on crop water demand
2.4. Impacts on growth and spread of detrimental pests 2.5. Impacts on growing seasons
2.6. Impacts on crop geographic distribution 2.7. Impacts of sea-level rise
2.8. Impacts on rice and maize output 2.9. Impacts on animal husbandry
3. Adaptation Measures………..………..10
3.1. Short-term measures 3.2. Long-term measures
1
1. Climate change manifestation and climate change scenarios for
Viet Nam
1.1. Climate change manifestation
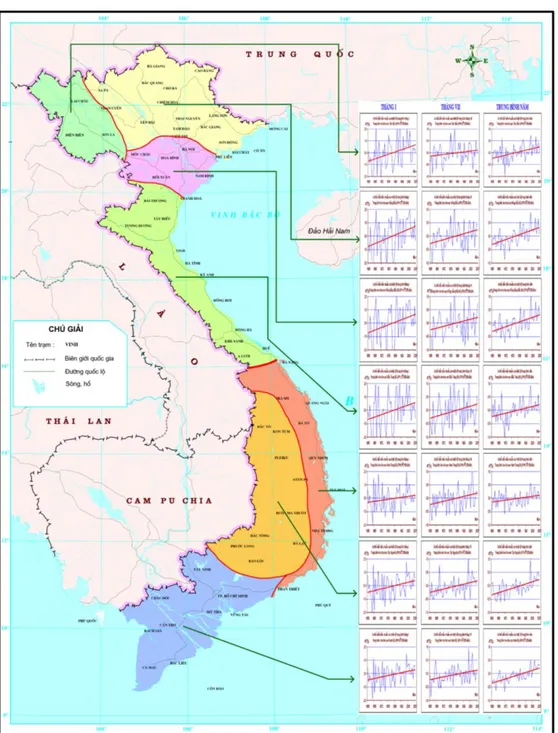
Temperature: Over the past 50 years, (1958-2007), annual average temperatures increased by about 0.5 to 0.7oC. Temperatures for winters and northern climate zones increased at faster rates compared to summer and southern climate zones, respectively (Figure 1)
UNJP/VIE/037/UNJ
“Strengthening Capacities to Enhance Coordinated and Integrated Disaster Risk Reduction Actions and Adaptation to Climate Change in Agriculture in the Northern Mountain Regions of Viet Nam”
2
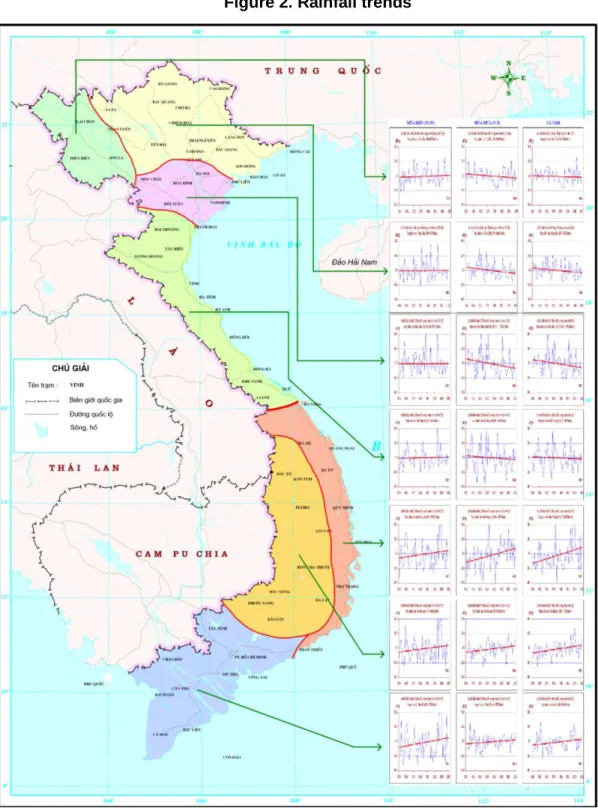
Rainfall: Annual average precipitation over the last nine decades (1911-2000) does not show a clear trend across regions and time periods. Instead, both upward and downward trends can be seen. Northern climate zones have seen a decrease in annual rainfall, in contrast to southern zones (Figure 2). On a country wide basis, average precipitation fell by 2% during the last fifty-year period (1958-2007).3
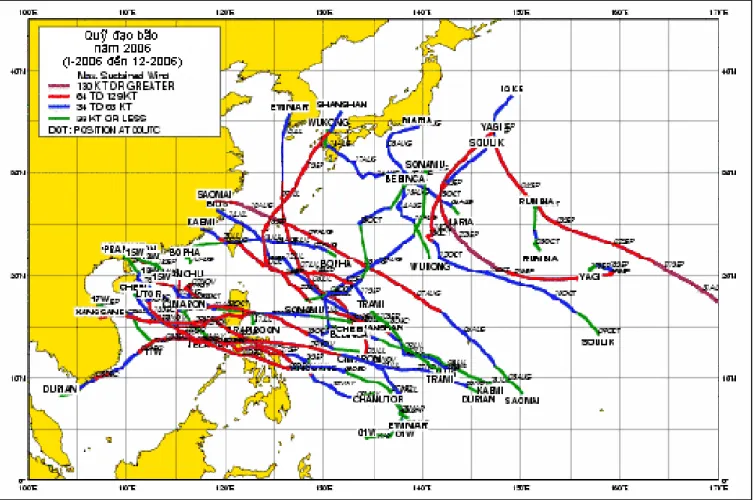
Cold fronts: Thenumber of cold fronts affecting Viet Nam has decreased significantly over the last two decades. However, anomalous events have occurred more frequently recently, with most notably the damaging cold surge which lasted for 38 days in the Red River Delta during January and February 2008Typhoons: In recent years, typhoons with higher intensity tend to occur more frequently. Typhoon tracks show signs of moving southwards, with abnormal movements while storm seasons tend to end later (Figure 3).
Figure 3. West Pacific Ocean typhoon tracks
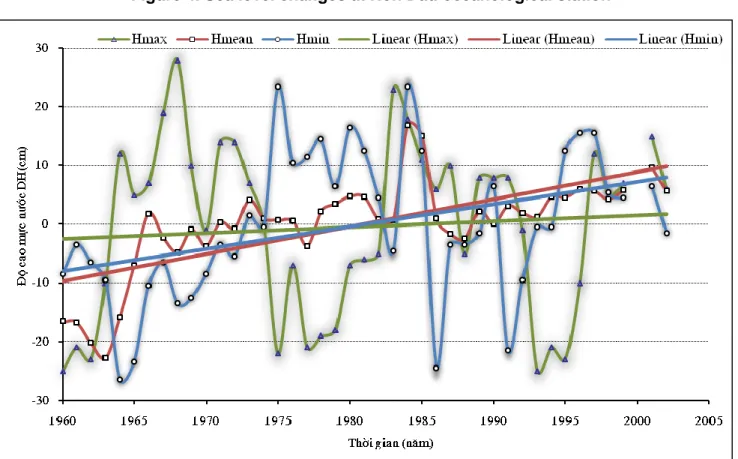
Sea level: Observations by tidal gauges in marine hydro-meteorological stations along the coastline of Viet Nam show that the mean sea level rose at a rate of 3 mm per year (during 1993-2008). Over the past fifty years, sea level at Hon Dau Marine oceanographical station has increased by about 20 cm (Figure 4).
UNJP/VIE/037/UNJ
“Strengthening Capacities to Enhance Coordinated and Integrated Disaster Risk Reduction Actions and Adaptation to Climate Change in Agriculture in the Northern Mountain Regions of Viet Nam”
4
Figure 4. Sea level changes at Hon Dau oceanological station
1.2. Climate change scenarios
Climate change scenarios for Viet Nam were developed using the coupled method (MAGICC/SCENGEN 5.3) as well as the statistical downscaling method, and are based on emission scenarios in IPCC’s Fourth Assessment Report. Scenarios used are the medium-high emission (A21), low emission (B12) and medium-medium emission scenario (B23).
The scenarios, which focus on temperature and rainfall changes, were developed for Viet Nam’s seven climate zones: Northwest, Northeast, Northern Delta (Red River
1
A2 family scenario: A very heterogeneous world; self reliance and preservation of nations; continuously increasing population in the 21st century; regionally-oriented economic development; technological change and per capita economic growth are more fragmented and slow (medium-high emission scenario). 2
Rapid economic growth as in A1, but with rapid changes towards a service and information economy; global population reaches the peak in 2050 and declines thereafter; reductions in material intensity and the introduction of clean and resource-efficient technologies; emphasis on global solutions to economic, social and environmental sustainability (low emission scenario).
3
Continuously increasing population, but at a rate lower than A2; the emphasis is on local rather global solutions to economic, social and environmental sustainability; intermediate levels of economic development; less rapid and more diverse technological change than in B1 families (medium-medium emission scenario).
5
Delta), North Central Coast, South Central Coast, Central Highlands and the Southern Delta (Mekong Delta). The baseline period is 1980-1999. However, the application of the MAGICC/SCENGEN 5.3 model in the development of climate change scenarios, which produces array files on a standard 2.5x2.5 degree latitude/longitude grid (300 by 300 km) displayed as maps, has a number of limitations as it is unable to accurately reflect the intra-regional nuances of climate change in Viet Nam.Viet Nam’s Climate Change, Sea Level Rise Scenarios, with temperature, rainfall and sea level projections for the 21st century, was published in 2009.
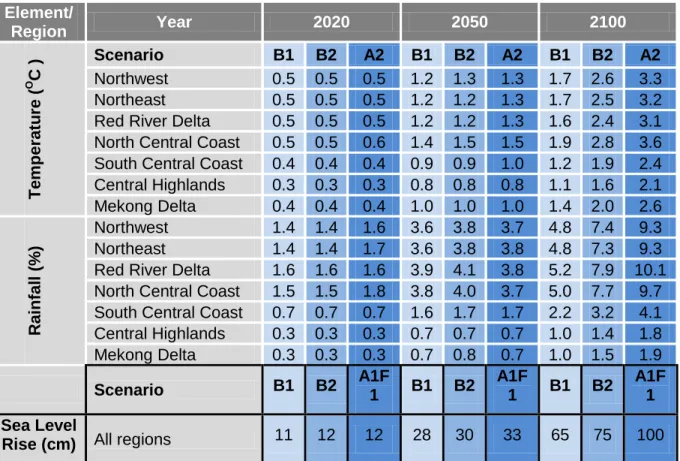
Increases in temperature, rainfall and sea-level rise relative to the 1980-1999 baselines for the three climate change scenarios are presented in Table 3.1.
1.2.1. Temperature
Winter temperatures are likely to increase faster than summer in all climate regions. Temperatures in northern regions are projected to rise at a faster rate than southern ones.
By 2020, according to the three low, medium and high climate change scenarios, annual mean temperatures for northern climate zones (north of the North Central Coast) is projected to increase by 0.5oC relative to the 1980-1999 level by 2020. Climate zones south of the South Central Coast are set to experience a smaller increase of 0.3 to 0.4oC.
By 2050, annual mean temperatures for northern climate zones are projected to increase by 1.2oC to 1.3oC, with the exception of the North Central Coast where temperatures may rise by 1.4oC-1.5oC. In contrast, climate zones south of the South Central Coast are likely to experience a smaller increase in temperature of about 0.8-1.0oC.
By the end of the 21st century, differences in temperatures between regions and scenarios are set to be much more pronounced (Table 3.1). Indeed, in northern climate zones, according to the low scenario, annual mean temperature will be 1.6 to 1.9oC higher than in 1980-1999. In the medium scenario, temperatures are projected to increase by 2.4 to 2.6oC, except for the North Central Coast with 2.8oC. In the high scenario, temperature increases are between 3.1 and 3.3oC in most regions, but up to 3.6oC for the North Central Coast (Table 3.1).
From the South Central Coast to the South, the low scenario estimates that the increase in annual mean temperatures will be 1.2 to 1.4oC over 1980-1999 levels. The medium scenario projects a rise of 1.9 to 2.0oC while, in the high scenario, the increase is from 2.4 to 2.6oC (Table 3.1).
1.2.2. Rainfall
By 2020, all three scenarios project increases in total annual rainfall of 1.4 to 1.8% for northern climate zones and 0.3 to 0.7% for southern climate zones over 1980-1999 levels.
UNJP/VIE/037/UNJ
“Strengthening Capacities to Enhance Coordinated and Integrated Disaster Risk Reduction Actions and Adaptation to Climate Change in Agriculture in the Northern Mountain Regions of Viet Nam”
6
Table 1. Increases in temperature, rainfall and sea level
according to the three climate change scenarios, compared to 1980-19994
Element/ Region Year 2020 2050 2100 Te mperatu re ( O C ) Scenario B1 B2 A2 B1 B2 A2 B1 B2 A2 Northwest 0.5 0.5 0.5 1.2 1.3 1.3 1.7 2.6 3.3 Northeast 0.5 0.5 0.5 1.2 1.2 1.3 1.7 2.5 3.2 Red River Delta 0.5 0.5 0.5 1.2 1.2 1.3 1.6 2.4 3.1 North Central Coast 0.5 0.5 0.6 1.4 1.5 1.5 1.9 2.8 3.6 South Central Coast 0.4 0.4 0.4 0.9 0.9 1.0 1.2 1.9 2.4 Central Highlands 0.3 0.3 0.3 0.8 0.8 0.8 1.1 1.6 2.1 Mekong Delta 0.4 0.4 0.4 1.0 1.0 1.0 1.4 2.0 2.6 R ainf al l (% ) Northwest 1.4 1.4 1.6 3.6 3.8 3.7 4.8 7.4 9.3 Northeast 1.4 1.4 1.7 3.6 3.8 3.8 4.8 7.3 9.3 Red River Delta 1.6 1.6 1.6 3.9 4.1 3.8 5.2 7.9 10.1 North Central Coast 1.5 1.5 1.8 3.8 4.0 3.7 5.0 7.7 9.7 South Central Coast 0.7 0.7 0.7 1.6 1.7 1.7 2.2 3.2 4.1 Central Highlands 0.3 0.3 0.3 0.7 0.7 0.7 1.0 1.4 1.8 Mekong Delta 0.3 0.3 0.3 0.7 0.8 0.7 1.0 1.5 1.9
Scenario B1 B2 A1F1 B1 B2 A1F1 B1 B2 A1F1 Sea Level
Rise (cm) All regions 11 12 12 28 30 33 65 75 100
By 2050, rainfall will have increased by 3.8 to 4.1% in northern climate zones, but only by 0.7%-1.7% in the South Central Coast and further south.
By 2100, annual rainfall in northern climate zones is projected to increase by 4.8 to 5.2% in the low scenario, 7.3 to 7.9% in the medium scenario and 9.3% to 10.1% in the high scenario. From the South Central Coast southwards, the increase will be smaller, averaging 1.0 to 3.2% in the low and medium scenarios and 1.8 to 4.1% in the high scenario (Table 1).
Rainfall is projected to decrease during the dry season in almost every region, most markedly in the south. In the rainy season, rainfall is likely to increase in all regions. Overall, total annual rainfall is set to increase throughout the country.
1.2.3. Sea-level rise
According to the low, medium and high (A1F1) scenarios, sea level will rise 28 to 33 cm by the mid-21st century, and 65 to 100 cm by the end of the 21st century with respect to 1980-1999 levels (Table 1).
4
7
2. Possible impacts of climate change on agriculture
Methods used in the assessment of impacts on production include the dynamic ecosystem simulation model (DESM) and statistical analysis of agrometeorological data.
2.1 Impacts on agrometeorology
Climate change is set to raise annual total active temperature (above 0oC), with a declining number of days below 20oC, and an increasing number of days above 25oC (Table 2).
Table 2. Annual total active temperature and number of days above 25ºC5
Annual total active temperature
(oC) Number of days above 25
oC
Region Base
year 2020 2050 2100 Base year 2020 2050 2100 Northwest 8,136 8,285 8,636 9,036 124 143 176 207
Northeast 8,360 8,550 8,845 9,310 164 173 190 212
Red River Delta 8,525 8,686 8,943 9,410 166 172 189 209
North Central Coast 9,101 9,274 9,605 10,040 192 203 223 251 South Central Coast 9,704 9,820 10,085 10,417 275 290 337 365 Central Highlands 8,664 8,774 8,985 9,266 79 94 134 230 Mekong Delta 9,737 9,864 10,123 10,424 365 365 365 365
Annual total active temperature of all regions is projected to increase by 1 to 2% by 2020, 4 to 5% by 2050 and 8 to 11% by 2100. In terms of geographical distribution, the area with total temperature above 10,000oC will extend northwards by 2020, 2050 and 2100. The northernmost point of the area, situated at latitude 14o in 2000, may be displaced to latitude 18.5o by 2100.
The numbers of days when average daily temperature falls below 20oC in the Red River Delta could drop to 90 by 2050 and 40 by 2100. In Northeast, these numbers are expected to be 86 and 46 days, and 74 and 30 days in Northwest, in the respective years.
By 2050 and 2100, the number of days where average daily temperature exceeds 25oC will have markedly increased in the Red River Delta. In the Northwest, this number may rise from 124 days (2000) to 176 days (2050) and 207 days (2100). For the South Central Coast, this number would increase from 275 days (2000) to 337 days in 2050 and 365 days in 2100.
As the number of cooler days below 20oC decreases, winter crop patterns in northern regions may have to change in terms of growing season, seed and crop types. On the other hand, the extension of warmer days above 25oC will benefit tropical crops. To take
5
UNJP/VIE/037/UNJ
“Strengthening Capacities to Enhance Coordinated and Integrated Disaster Risk Reduction Actions and Adaptation to Climate Change in Agriculture in the Northern Mountain Regions of Viet Nam”
8
adavantage of this condition, it is necessary to make cropping pattern adjustments and begin developing a suitable crop-rotation system for heat-tolerant crops.2.2 Impacts on crop growth rate
Rising temperatures would increase the crop growth rate, and thereby shorten plants’ growth cycle. A 1oC increase in temperature would correspond to a shortening of the growth cycle by 5 to 8 days for rice, or 3 to 5 days for potatoes and soybean.
2.3 Impacts on crop water demand
Water demand for agriculture may double or triple by 2100 compared to 2000. At the same time, there are constantly growing risks of severe droughts and water shortage for irrigation.
2.4 Impacts on growth and spread of detrimental pests
There is potential for a significant increase in the reproduction and spread of harmful pests such as the rice-feeding ear-cutting caterpillars, black cutworms, bark-boring beetles, fungi, amongst others, which thrive at higher temperatures and in changing rainfall patterns .
2.5 Impacts on growing seasons
According to the medium climate change scenario, spring crops in the Red River Delta may be sown earlier by 5 to 20 days on average. For seasonal crops, however, the sowing season may be delayed by 20 to 25 days.
2.6 Impacts on crop geographic distribution
Regions where tropical crops grow will tend to shift to higher elevations in the mountains and northwards. By 2100, tropical crops may be found at elevations of 100 to 550 m and move 100 to 200 km northward. In contrast, subtropical crops’ cultivation area may decline.
The distribution of hygrophytes may be altered by changes in rainfall, rainfall intensity and more frequent floods and droughts.
The potential intensification of water shortage for agriculture and increased evapotranspiration would decrease the cover area of hygrophytes.
2.7 Impacts of sea-level rise
Due to rising sea levels, arable land across the country will be significantly reduced. Annual rice output may drop by several million tonnes. Millions of people living in low-lying areas would be forced to either elevate or abandon their homes, causing significant damage to the local and national economies.
2.8 Impacts on rice and maize output
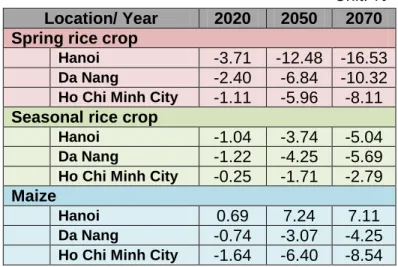
Climate change impact assessments for rice and maize outputs in Ha Noi (representing the Red River Delta), Da Nang (for the Central region) and Ho Chi Minh City (for the South) shows that (Table 3):
Outputs for both spring and seasonal crops tend to fall, most markedly in the Red River Delta. Spring crop output for the region may drop by 12.5% by 2050 and 16.5% by 2070, while in the Central and Southern regions, output may fall by 10 and 8% by the respective years. Across the country, seasonal crop output will decrease albeit at a lower rate of around 2 to 4% by 2050, and 3 to 6% by 2070.
Winter maize output is affected differently by climate change for the North, Center and South. In the Red River Delta, winter maize output may increase by 7% by 2050 and 2070, while declining by 3 to 6% by 2050 and 4 to 8% by 2070 in the Central Coast and
9
the Mekong River Delta.Table 3. Percentage difference in output of spring crop,
season crop and maize outputs relative to base year6
Unit: %
Location/ Year 2020 2050 2070 Spring rice crop
Hanoi -3.71 -12.48 -16.53
Da Nang -2.40 -6.84 -10.32
Ho Chi Minh City -1.11 -5.96 -8.11
Seasonal rice crop
Hanoi -1.04 -3.74 -5.04
Da Nang -1.22 -4.25 -5.69
Ho Chi Minh City -0.25 -1.71 -2.79
Maize
Hanoi 0.69 7.24 7.11
Da Nang -0.74 -3.07 -4.25
Ho Chi Minh City -1.64 -6.40 -8.54
2.9 Impacts on animal husbandry
Reductions in feed sources will affect livestock growth and reproduction. Livestock breeds will have a hard time adapting to new, warmer conditions. In addition, global warming and the associated increase in extreme weather manifestations such as typhoons, floods, storm-induced high waters, violent winds and downpours will greatly threaten the animals’ life cycles. Climate change also raises the risk of epidemic break-outs.
6
UNJP/VIE/037/UNJ
“Strengthening Capacities to Enhance Coordinated and Integrated Disaster Risk Reduction Actions and Adaptation to Climate Change in Agriculture in the Northern Mountain Regions of Viet Nam”
10
3. Adaptation Measures
3.1 Short-term measures
Prevent soil erosion, implement soil protection, preserve soil moisture and fertility levels, plant trees and form terraced fields on steep slopes to increase vegetation cover.
Provide proactive crop irrigation by constructing water resevoirs and adopting more efficient methods such as spray and drip irrigation.
Select crops suited to climate change (short-term crops with short maturity, crops with enhanced resistance to harsh conditions of drought, high acidity, high salinity, pests and diseases, etc..).
Adjust the growing seasons and sowing times to meet the changing climate conditions.
Adopt new, more suitable cultivation practices (e.g: planting distances, fertilizer application, weed control, plowing, post-harvest straw mulching, pest control, crop rotation, etc...).
Expand fodder production and enhance storage, processing and utilization of animal feeds.
Build stables with adequate designs, proper manure and wastewater treatment systems.
3.2 Long-term measures
Adopt climate change-suited cropping patterns.
Crossbreed to create new species more adapted to the changing climate with increased tolerance for arid conditions, high salinity, flooding and pests.
Modernize cultivation and stockbreeding techniques.
Adopt scientific, efficient water management methods.
Improve land management capacity to enhance land conservation.
3.3 Management and harvesting practices
Redistribute regional crop and livestock production to better suit changing climate conditions.
Provide additional incentives for agriculture, forestry and aquafarming.
Forecast crop output, develop disaster and pest warning systems in agriculture, and improve telecommunication systems.
Encourage agricultural technology research and development.
Provide crop and livestock insurance .
Develop and implement climate change adaptation mechanisms and policies.
On the basis of the NTP-RCC, the Ministry of Agriculture and Rural Development has formulated and adopted the “Action Plan Framework for Adaptation and Mitigation of Climate Change in the Agriculture and Rural Development Sector Period 2008-2020”. The program seeks to enhance capacity in mitigation and adaptation, to ensure sustainable agricultural and rural development, stabilize agricultural production, ensure food supply security, guarantee 3.8 million ha of land for bi-annual crop harvests, safety and reliability of the dike system, public, economic and technical infrastructure and natural disaster prevention.