Calhoun: The NPS Institutional Archive
Theses and Dissertations Thesis Collection
2012-12
The potential effects of the Defense
Business Board military compensation
task groups 2011 recommendations on
active-duty service member retirement
Schneider, Jason C.
Monterey, California. Naval Postgraduate School
NAVAL
POSTGRADUATE
SCHOOL
MONTEREY, CALIFORNIA
MBA PROFESSIONAL REPORT
The Potential Effects of the Defense Business
Board Military Compensation Task Group’s
2011 Recommendations on Active-Duty Service
Member Retirement
By: Jason Schneider and
Neil Ebuen
December 2012
Advisors: Noah Myung and
Wythe Davis
i
REPORT DOCUMENTATION PAGE Form Approved OMB No. 0704–0188
Public reporting burden for this collection of information is estimated to average 1 hour per response, including the time for reviewing instruction, searching existing data sources, gathering and maintaining the data needed, and completing and reviewing the collection of information. Send comments regarding this burden estimate or any other aspect of this collection of information, including suggestions for reducing this burden, to Washington headquarters Services, Directorate for Information Operations and Reports, 1215 Jefferson Davis Highway, Suite 1204, Arlington, VA 22202–4302, and to the Office of Management and Budget, Paperwork Reduction Project (0704–0188) Washington, DC 20503.
1. AGENCY USE ONLY (Leave blank) 2. REPORT DATE December 2012
3. REPORT TYPE AND DATES COVERED
MBA Professional Report
4. TITLE AND SUBTITLE
The Potential Effects of the Defense Business Board Military Compensation Task Group’s 2011 Recommendations on Active-Duty Service Member Retirement
5. FUNDING NUMBERS
6. AUTHOR(S) Jason C. Schneider and Neil L. Ebuen
7. PERFORMING ORGANIZATION NAME(S) AND ADDRESS(ES)
Naval Postgraduate School Monterey, CA 93943–5000
8. PERFORMING ORGANIZATION REPORT NUMBER
9. SPONSORING /MONITORING AGENCY NAME(S) AND ADDRESS(ES)
N/A
10. SPONSORING/MONITORING AGENCY REPORT NUMBER
11. SUPPLEMENTARY NOTES The views expressed in this thesis are those of the author and do not reflect the official policy or position of the Department of Defense or the U.S. Government. IRB Protocol number NPS.2012.0088-IR-EM2-A.
12a. DISTRIBUTION / AVAILABILITY STATEMENT Approved for public release; distribution is unlimited
12b. DISTRIBUTION CODE 13. ABSTRACT (maximum 200 words)
In July 2011, the Defense Business Board (DBB) made recommendations to the Secretary of Defense for modernizing the military retirement system. If implemented, the plan would significantly modify military retirement as it has existed since its inception, shifting it from a defined benefit plan to a defined contribution plan.
In this study, we compared the current defined benefit retirement plan to a hypothetical, retrospective defined contribution plan using the constraints proposed by the Defense Business Board Military Compensation Task Group. We also gathered service members’ sentiments about the current military retirement system and proposed changes. This is an important topic because it revealed the potential financial effects on service members’ retirement savings, and government and departmental challenges should a new retirement system be implemented.
In this study, we created a mathematical model to simulate accumulated savings under the proposed defined contribution (DC) plan, and then compared it to the lump-sum equivalent of the existing defined benefit (DB) plan. Our model considered three investment strategies for asset allocation for active-duty personnel (i.e., officer and enlisted) spanning a 20-year career beginning in January 1, 1991, and ending in December 31, 2010. Additionally, our study surveyed active-duty service members assigned to the Naval Postgraduate School and personnel assigned to the II Marines Expeditionary Force. Through the survey, we gathered feedback on service members’ attitudes toward military retirement, in general, and proposed changes to the military retirement system.
For an officer, the model showed that under a DC plan, accumulated savings were only 37.5% of the lump-sum equivalent of total annuities received under the current DB plan. Likewise, for an enlisted service member, this value was 31.9%. The survey showed that an overwhelming majority of service members are in favor of retaining the current DB retirement system, or, if the retirement system must be replaced, doing so gradually.
14. SUBJECT TERMS: military retirement, reform, Defense Business Board, retirement reform, defined benefit, defined contribution
15. NUMBER OF PAGES 93 16. PRICE CODE 17. SECURITY CLASSIFICATION OF REPORT Unclassified 18. SECURITY CLASSIFICATION OF THIS PAGE Unclassified 19. SECURITY CLASSIFICATION OF ABSTRACT Unclassified 20. LIMITATION OF ABSTRACT UU
NSN 7540–01–280–5500 Standard Form 298 (Rev. 2–89)
ii
iii
Approved for public release; distribution is unlimited
THE POTENTIAL EFFECTS OF THE DEFENSE BUSINESS BOARD MILITARY COMPENSATION TASK GROUP’S 2011 RECOMMENDATIONS
ON ACTIVE-DUTY SERVICE MEMBER RETIREMENT
Jason C. Schneider, Captain, United States Marine Corps Neil L. Ebuen, Lieutenant, United States Navy
Submitted in partial fulfillment of the requirements for the degree of
MASTER OF BUSINESS ADMINISTRATION
from the
NAVAL POSTGRADUATE SCHOOL December 2012 Authors: __________________________________ Jason C. Schneider __________________________________ Neil L. Ebuen Approved by: __________________________________ Noah Myung Lead Advisor __________________________________ Wythe Davis Support Advisor __________________________________ William R. Gates, Dean
iv
v
THE POTENTIAL EFFECTS OF THE DEFENSE BUSINESS BOARD
MILITARY COMPENSATION TASK GROUP’S 2011
RECOMMENDATIONS ON ACTIVE-DUTY SERVICE MEMBER
RETIREMENT
ABSTRACT
In July 2011, the Defense Business Board (DBB) made recommendations to the Secretary of Defense for modernizing the military retirement system. If implemented, the plan would significantly modify military retirement as it has existed since its inception, shifting it from a defined benefit plan to a defined contribution plan.
In this study, we compared the current defined benefit retirement plan to a hypothetical, retrospective defined contribution plan using the constraints proposed by the Defense Business Board Military Compensation Task Group. We also gathered service members’ sentiments about the current military retirement system and proposed changes. This is an important topic because it revealed the potential financial effects on service members’ retirement savings, and government and departmental challenges should a new retirement system be implemented.
In this study, we created a mathematical model to simulate accumulated savings under the proposed defined contribution (DC) plan, and then compared it to the lump-sum equivalent of the existing defined benefit (DB) plan. Our model considered three investment strategies for asset allocation for active-duty personnel (i.e., officer and enlisted) spanning a 20-year career beginning in January 1, 1991, and ending in December 31, 2010. Additionally, our study surveyed active-duty service members assigned to the Naval Postgraduate School and personnel assigned to the II Marines Expeditionary Force. Through the survey, we gathered feedback on service members’ attitudes toward military retirement, in general, and proposed changes to the military retirement system.
For an officer, the model showed that under a DC plan, accumulated savings were only 37.5% of the lump-sum equivalent of total annuities received under the current DB
vi
plan. Likewise, for an enlisted service member, this value was 31.9%. The survey showed that an overwhelming majority of service members are in favor of retaining the current DB retirement system, or, if the retirement system must be replaced, doing so gradually.
vii
TABLE OF CONTENTS
I. INTRODUCTION...1
A. BACKGROUND ...2
B. METHODOLOGY ...3
C. SCOPE AND LIMITATIONS ...3
II. LITERATURE REVIEW ...7
A. HISTORICAL COMMISSIONS AND LEGISLATION SHAPING MILITARY RETIREMENT (1800S TO 1986) ...7
1. Advisory Commission on Service Pay (1948) ...8
2. First Quadrennial Review of Military Compensation (1969) ...8
3. Interagency Committee on Uniformed Services Retirement and Survivor Benefits (1971) ...9
4. Defense Manpower Commission (1976) ...9
5. The President’s Commission on Military Compensation and the Uniformed Services Retirement Benefits Act (USRBA) of 1979...10
6. National Defense Authorization Act of 1981 ...11
7. The Fifth Quadrennial Review of Military Compensation (QRMC) and the National Defense Authorization Act of 1984 ...11
8. Military Retirement Reform Act of 1986 ...12
B. RECENT PROPOSALS TO MODIFY MILITARY RETIREMENT ...12
1. Defense Advisory Committee on Military Compensation (2006) ..13
2. 10th Quadrennial Review of Military Compensation (2008) ...14
3. Defense Business Board Military Compensation Task Group (2011) ...15
C. RECENT STUDIES OF MILITARY RETIREMENT REFORM ...16
1. Alternative Military Retirement Proposals ...17
2. Surveys Regarding Retirement Reform and the DBB’s Recommendations ...18
III. MODEL DESCRIPTION ...21
A. HISTORICAL DATA ...21
1. Pay Contributions ...21
2. TSP Funds...22
B. INVESTMENT TIME HORIZON ...24
C. PORTFOLIO DIVERSIFICATION ...25
D. CAREER PROGRESSION...26
E. LIFE EXPECTANCY ...28
F. LUMP-SUM EQUIVALENT VALUE OF NON-DISABILITY RETIREMENT PAY AT TIME OF RETIREMENT FOR PERSONS RETIRING IN 2012 ...29
IV. MODEL OUTPUTS...31
viii
1. 90/10 Model...31
2. SmartMoney Model ...33
3. Sharpe Ratio Model ...35
B. ENLISTED MODEL OUTPUTS ...36
1. 90/10 Model...36
2. SmartMoney Model ...37
3. Sharpe Ratio Model ...39
C. MODEL SUMMARY ...40
V. SURVEY ANALYSIS ...43
A. INTRODUCTION...43
B. U.S. MILITARY DEMOGRAPHICS ...43
C. NPS RESPONDENT DEMOGRAPHICS ...43
D. II MEF RESPONDENT DEMOGRAPHICS ...45
E. DESCRIPTIVE ANALYSIS ...46
1. Responses to General Retirement Questions ...46
2. Responses to Proposed Changes to the Military Retirement System Questions ...47
3. Responses to Fairness Questions ...47
4. Responses to Thrift Savings Plan Questions ...47
F. SELECTED IN-DEPTH ANALYSIS ...48
1. Influence of Stressors and DC Retirement Plan on Likelihood to Leave the Service ...48
2. Responses Considering DBB Specific Recommendations ...49
3. Combination of Defined Contribution and Defined Benefit Retirement Plan ...52
VI. CONCLUSION ...55
A. SUMMARY ...55
B. RECOMMENDATIONS FOR FURTHER STUDY ...56
APPENDIX A. DEFENSE BUSINESS BOARD: MODERNIZING THE MILITARY COMPENSATION SYSTEM RECOMMENDATIONS ...59
APPENDIX B. MILITARY RETIREMENT SURVEY ...61
BIBLIOGRAPHY ...71
ix
LIST OF FIGURES
Figure 1. Proposed DC Plan Versus Current DB Plan ...4 Figure 2. Military Retirement Trust Fund Expenditures by Fiscal Year (From
Defense Business Board, 2011, p. 10) ...10 Figure 3. Annual Returns for TSP G, F, C, S, and I Investment Funds (1998–2011) ....24 Figure 4. Service Branches of Respondents ...44
x
xi
LIST OF TABLES
Table 1. Initial Pay Contributions ...22
Table 2. Annual Returns With Standard Deviations for TSP G, F, C, S, and I Funds ..23
Table 3. Correlation Matrix for TSP Funds (1991–2010) ...24
Table 4. Enlisted Personnel Career Progression ...27
Table 5. Officer Career Progression ...28
Table 6. Life Expectancy for Military Retirees [Yrs] ...28
Table 7. Lump-Sum Equivalent of Retirement Pension Calculated Immediately at Retirement [20 Years Active Duty] ...29
Table 8. Military Officer – 90% Stock Funds/10% Bond Funds ...32
Table 9. Military Officer – SmartMoney Portfolio ...34
Table 10. Military Officer – Sharpe Ratio Portfolio ...35
Table 11. Enlisted Service Member—90% Stock Funds/10% Bond Funds ...37
Table 12. Enlisted Service Member—SmartMoney Portfolio ...38
Table 13. Enlisted Service Member—Sharpe Ratio Portfolio ...40
Table 14. Comparison Between Defined Contribution and Defined Benefit Retirement ...41
Table 15. Modified Officer Portfolio Scenarios ...42
Table 16. NPS Rank Distribution ...44
Table 17. II MEF Rank Category Distribution ...45
Table 18. Correlation of Stressors to Other Variables ...49
Table 19. Question 15 Correlation ...51
Table 20. Question 16 Correlation ...51
Table 21. Officer and Enlisted Preferences Under a Hybrid Plan ...52
xii
xiii
LIST OF ACRONYMS AND ABBREVIATIONS
CAP CAN
Center for American Progress Center for Naval Analysis
COLA Cost of Living Adjustment
CPI Consumer Price Index
CSB Career Status Bonus
CSRS Civil Service Retirement System
DACMC Defense Advisory Committee on Military Compensation
DBB Defense Business Board
DB Defined Benefit
DC DFAS
Defined Contribution
Defense Financial and Accounting Service
DMC Defense Manpower Commission
DoD Department of Defense
DSB Defense Science Board
FERS Federal Employee Retirement System
GAO General Accounting Office (prior to July 7, 2004)
Government Accountability Office (effective July 7, 2004)
IAC Interagency Commission (on Retirement and Survivor Benefits)
MEF Marine Expeditionary Force
MRRA Military Retirement Reform Act
NPV Net Present Value
OPTEMPO Operation Tempo
OSD Office of the Secretary of Defense
PCMC President’s Commission on Military Compensation
QRMC Quadrennial Review of Military Compensation
RMA ROTC S&P 500
Retirement Modernization Act Reserve Officers’ Training Corps Standard & Poor’s 500
SECDEF Secretary of Defense
TSP Thrift Savings Plan
USRBA Uniformed Services Retirement Benefits Act
xiv
xv
ACKNOWLEDGMENTS
We would like to thank our advisors, Professor Noah Myung and Mr. Wythe Davis, for sharing their knowledge, expertise, and insights into our research. Their advice and guidance was paramount during our research and analysis. We would also like to Captain Karen Alderman for her assistance in the administration of our survey to II MEF and LTC Brent Ruhlen for providing us with a copy of his survey analysis. We thank our wives (Allison and Milagros) and our children (Jace, Sydney, Lydia, and Matthew) for their love and support during our time at NPS. Finally, we want to thank all those serving in the United States military and hope that this report will help provide a better understanding of and insight into current military retirement reform proposals and will be a useful tool in their retirement planning should they decide to make military service a career.
xvi
1
I.
INTRODUCTION
This MBA professional report addresses two key points. First, assuming that the recommendations from the July 2011 Defense Business Board (DBB) Military Compensation Task Group were implemented 20-years ago (i.e., 1991), how would retirement savings change compared between the DBB’s proposed retirement plan and the High-3 version of the current retirement plan? Second, we conducted a survey of active-duty service members to ascertain their knowledge of and preferences for the current military retirement system and proposed changes to the military retirement system. Comparing the two plans allows service members entering the military today to compare their cumulative retirement savings under a defined contribution (DC) plan1 with the defined benefit (DB) plan2 used today. The survey responses can be used by military leadership and policy makers to make more informed decisions when it comes to determining changes to the military retirement system. We discovered two other surveys during our research that solicited feedback on the current retirement system and the DBB recommendations. These survey populations differed in that they included former members of the military and cadets serving in Reserve Officers’ Training Corps (ROTC) programs. One of the survey questionnaires was not released to the public. The other survey questionnaire was used as a baseline to develop demographic, military retirement compensation, military retirement proposed changes, and fairness questions for this study’s survey.
Three tasks were performed in order to address this report’s key points. First, a model based on the parameters provided within the DBB’s recommendations was created to calculate the net present value (NPV) of a service member’s retirement savings after
1 A plan in which it is the responsibility of the employer to contribute a specified amount each year, based on a formula established in the plan, to the employee’s retirement account. The plan defines only the contributions to the plan, and does not specify how much an employee will ultimately receive (Ortega, 2007, pp. 458–467).
2 A plan which specifically defines the benefits to be received by the employee. A formula, which takes into consideration an employee’s age, compensation, and length of service, determines the amount of pension benefits an employee will receive (Ortega, 2007, pp. 458–467).
2
20 years of service (YOS). Three investment strategy scenarios were applied to the retirement savings of an active-duty officer and an enlisted service member throughout their 20-year careers. Second, the final values from the hypothetical scenarios mentioned previously were compared with the NPV of retirement savings under the current military retirement system (High-3 version) at the 20 YOS mark. Finally, a survey was conducted of active-duty officers enrolled at the Naval Postgraduate School and personnel serving with the II Marine Expeditionary Force (MEF) to solicit their perceptions and opinions about the current military retirement plan and the DBB’s recommended changes.
A. BACKGROUND
On July 21, 2011, the DBB released its initial findings and recommendations after conducting an eight-month study tasked by the Secretary of Defense (SECDEF). The SECDEF’s mandate for the task group was “to provide recommendations that will enable the system to be fiscally sustainable and recruit and retain the highest personnel required for our nation’s defense” (DBB, 2011, p. 11). A summary of the DBB’s recommendations is provided in Appendix A. The DBB primarily recommended that the Department of Defense (DoD) transition from the current DB plan to a DC plan similar to the 401(k) plans offered by civilian employers. To accomplish this, the Thrift Savings Plan (TSP) would become the primary source of retirement income, with the DoD providing a contribution match “comparable to the highest end of a private sector pension plan” (DBB, 2011, p. 31). Under such a system, service members would become vested after three to five years. Under the current system, service members do not qualify for military retirement unless they serve 20 years, a retirement scenario known as “cliff vesting.”
Should the DBB’s recommendations be adopted, “the new retirement plan would mark the biggest change in military retirement in more than 60 years and require approval from Congress” (Joyner, 2011). It should not come as a surprise that the DoD is considering a shift to a DC plan. According to Ortega, there has been a “noticeable shift” by employers from DB plans to DC plans since the 1980s. “In 1980, 84% of workers at medium and large private-sector employers were covered by DB plans; by 2003 the
3
percentage had dropped to 33%. Similarly, the number of DB plans offered at companies has decreased from 112,200 in 1985 to 29,700 in 2005” (Ortega, 2007). Adopting a DC plan is not a new topic of discussion in the halls of the Pentagon; however, with the 2008 recession and a lumbering recovery, it has reemerged as a potential austerity measure within the U.S. government.
B. METHODOLOGY
We created a mathematical model of the DBB’s recommendations to simulate the accumulated retirement savings using historical data for military basic pay and TSP investment fund return rates from 1991–2011; this interval corresponds to the 20 years that military personnel must serve in order to qualify for a retirement pension. This amount of savings was then compared to the lump-sum equivalent, or NPV, of all retirement annuities received from retirement until the average age of death as specified by the DoD Office of the Actuary. The DBB recommended several parameters including a 3- to 5-year vesting period, pension withdrawal age ranging from 60 to 65, and a variable percentage match based on the higher end of a private sector plan, which could be adjusted in certain scenarios such as combat and/or arduous duties. Our model assumes a fixed contribution match with no consideration for vesting period or pension withdrawal age. Historical TSP investment fund return rates were the basis for determining the annual returns for the service member in the DBB scenario. Portfolios were diversified, favoring a higher stock asset allocation versus bond allocations, and included considerations for a higher risk tolerance.
C. SCOPE AND LIMITATIONS
Our research provides service members a comparison between the accumulated retirement savings under a DBB proposed DC retirement system, and the single lump-sum equivalent value of the retirement pay under the current (High-3 version) of the DB plan. This research also provides survey findings regarding service members’ knowledge, awareness, and attitudes towards the current retirement system and any proposed changes.
4
This is not a manpower study. Our findings do not include effects on retention, policy, or taxation issues. This is not a portfolio optimization study. As mentioned previously, investment best practices are utilized to determine portfolio diversification throughout the service member’s career. Our study only considered non-disability retirement. Other benefits such as health care, G.I. Bill, exchange/PX and commissary privileges, and so forth, are not considered in the study.
The subjects of the study included active-duty officers and enlisted personnel only; service branch and gender were not taken into consideration. Historical data were used for pay tables, TSP fund return rates, and life expectancy rates. NPV at 20 YOS was the value compared for each plan. For the DBB plan, NPV is the accumulation of retirement savings over 20 YOS. Retirement savings were calculated by taking 8% (assumed) of the service member’s base pay (with government match; total contribution equals 16%) and investing it into two TSP funds (one bond fund, and one stock fund) each month. The final value at 20 years is the sum of all contributions compounded over that time period. For the High-3 version of the current plan, NPV is defined as the lump-sum equivalent of the total pension annuities paid from the time of retirement to death (DoD Office of the Actuary life expectancy rate used). Social Security is not included in retirement savings for either the DBB recommended plan or the High-3 plan. See Figure 1 for a visual representation of the plan comparison.
5
The military did not begin participating in the TSP until 2001. Although this is the case, the TSP has been in existence since 1986 when it was first offered to civil servants participating in the Civil Service Retirement System (CSRS) and Federal Employees Retirement System (FERS). Because the range of our counterfactual model begins in 1991, we assumed military personnel were eligible to participate.
6
7
II.
LITERATURE REVIEW
This literature review provides an overview of commissions, task forces, legislation, and so forth, which shaped military retirement reform from the 1800s to the present day. With an understanding of the historical milestones, reforms, and recommendations which contributed to the evolution of the military retirement system, we gain insight into contemporary challenges and recommendations. Following the review of historical military retirement reforms, overviews of recent studies that promote specific changes to the military retirement system and surveys are provided. While the recommendations included here are not exhaustive, they represent some of the most prominent reforms recommended to date. This section relies heavily upon John Christian’s (2006) RAND technical report entitled An Overview of Past Proposals for Military Retirement Reform.
A. HISTORICAL COMMISSIONS AND LEGISLATION SHAPING MILITARY RETIREMENT (1800S TO 1986)
Early historical records show that the American colonial governments compensated men who became disabled from territorial disputes with Native Americans. Similarly, this type of financial backing was expanded to include militia members during the Revolutionary War and, once the Continental Congress was formally organized, this pension system was adopted for its fledgling army and naval forces. These measures represented early attempts, on behalf of the general population and the government, to provide some sort of pension-type payment for those who served to protect the nation (Clark, Craig, & Wilson, 2003).
In 1855, the Secretary of the Navy authorized, “with the recommendation of an examination board, to involuntarily terminate officers who were deemed incapable or unfit for duty” (Christian, 2006, p. 2). Six years later, voluntary retirement was authorized for service members who attained 40 YOS. Furthermore, in 1870, Army and Marine Corps officers became eligible for voluntary retirement after only 30 YOS. However, this entitlement was not made available to Navy officers until 1908. The
8
current vesting requirement of 20 YOS was established in 1946 for Navy and Marine Corps officers and likewise established for Army and Air Force officers in 1948 (Christian, 2006).
1. Advisory Commission on Service Pay (1948)
Shortly after adopting the 20 YOS vesting requirements in 1946 and 1948, concerns arose regarding the high costs projected to sustain military pensions. The Advisory Commission on Service Pay, also known as the Hook Commission, recommended that retirement be pushed to 30 YOS from 20 YOS due to the fact that service members could retire at around age 42, while still earning 50% of their basic pay throughout their lifetime (Christian, 2006). Almost 65 years later, the DBB made similar observations, stating, “the DoD pays retirees 40 years of retirement benefits for 20 years of service” (DBB, 2011). In 1948, the Joint Army–Navy Pay Board generally agreed with the Hook Commission, suggesting that the payment of the retirement annuity should begin at age 62, but the recommendations were not instituted and pension benefits continued to be collected immediately at retirement (Christian, 2006).
2. First Quadrennial Review of Military Compensation (1969)
In 1969, the Quadrennial Review of Military Compensation (QRMC) was tasked “to lower the cost of the retirement” (Christian, 2006, p. 4). With this very broad goal, the QRMC offered several recommendations which have remained prevalent, in some variation, in subsequent recommendations. Their most prominent recommendation was the establishment of “life phases,” which were spans of time following a service member’s military retirement. For a service member retiring at age 42, the next 20 years constituted the first phase, or “second-career phase,” and from age 62 to death constituted a second phase, the “old age phase.” The QRMC recommended that the payouts for each phase be different to reflect the reality that most service members would have a second career after retiring from the military in their 40s. Depending on YOS at retirement (i.e., 20 years or beyond), the annuity amount for each phase would vary. In the second-career phase, the QRMC proposed 24% of final salary for 20 YOS, and up to 51% with 30 YOS.
9
In the old age phase, the annuity ranged from 33% of final salary at 20 YOS to 75% at 40 YOS (Christian, 2006).
3. Interagency Committee on Uniformed Services Retirement and Survivor Benefits (1971)
In 1971, a new committee called the Interagency Committee on Uniformed Services Retirement and Survivor Benefits (IAC) further refined the recommendations originally proposed by the first QRMC. The IAC advocated a more detailed phase reduction of the retirement annuity based on the QRMC’s second-career and old-age phase approach. Most notably, the IAC recommended using the average of a service member’s highest three years of basic pay, as opposed to final basic pay, as a basis for determining the retirement annuity amount. As a result of the IAC’s recommendations, and in conjunction with the DoD Retirement Study Group, the Uniformed Services Retirement Modernization Act (RMA) of 1974, H.R. 12505, was introduced in the House of Representatives. The RMA contained three major recommendations: (1) a High-one pay base (the average basic pay during the service member’s final year in service) for calculating retirement annuity; (2) a flat reduction of 15% for service members in the second-career phase of retirement until they would have reached 30 YOS; and (3) an offset of military retirement benefits by 50% of Social Security benefits (Christian, 2006). The House Armed Services Committee considered the RMA, but it failed to garner the required support to reach the House floor (Uniformed Services RMA, 1974).
4. Defense Manpower Commission (1976)
The Defense Manpower Commission (DMC) sought once again to institute the IAC’s High-3 recommendation in 1976. Additionally, the DMC proposed that the age of annuity payouts begin at age 65 instead of immediately at retirement. After attempting to model the RMA’s Social Security offset proposal, however, they determined that “there was an insoluble attribution problem with the RMA’s proposal; in other words, there was no way of unambiguously apportioning an individual’s Social Security benefit to military
10
service and to civilian employers.” As a result, the DMC did not support the Social Security offset feature of the RMA and opposed its passage (Christian, 2006).
5. The President’s Commission on Military Compensation and the Uniformed Services Retirement Benefits Act (USRBA) of 1979
In April 1978, the President’s Commission on Military Compensation (PCMC), also known as the Zwick Commission, suggested that military compensation be “more cost-effective, flexible, and fair” (Christian, 2006, p. 6). From 1964 to 1978, military retirement costs rose from 2% to 8% of the Pentagon’s budget, a trend that would continue to present day (see Figure 2).
Figure 2. Military Retirement Trust Fund Expenditures by Fiscal Year (From Defense Business Board, 2011, p. 10)
Furthermore, the PCMC noted that compensation for service members was closer to being on equal footing with civilian compensation, leading them to recommend that the military retirement annuity be made comparable to that of civil servants. They also renewed the notion of a Social Security offset, originally proposed in the RMA. The PCMC’s recommendations were captured in the Uniformed Services Retirement Benefits Act (USRBA) of 1979 (Christian, 2006). However, the fate of the USRBA was much like
11
its RMA predecessor. According to the Congressional Budget Office (1984), “the cost savings would not have been realized for 20 or more years owing to the grandfathering of the entire active-duty force,” which made it politically unattractive; plus, the Services were not supportive (p. 36).
6. National Defense Authorization Act of 1981
The passage of the National Defense Authorization Act of 1981 brought about the demise of final pay as a basis for determining a service member’s retirement annuity payment. In its place, the authorization provided the new High-3 method for determining the military retirement annuity. The cost savings reasons for instituting this change were two-fold: (1) It would reduce the annuity by taking an average of the service member’s pay from the highest three YOS (generally the last three years), versus the final base pay, to calculate the base pay rate from which the 50% annuity would be determined; and (2) it “would mitigate certain windfall benefits” incurred, such as when a service member was promoted or accumulated another year of service. This change represented the most significant in military retirement since World War II (Christian, 2006).
7. The Fifth Quadrennial Review of Military Compensation (QRMC) and the National Defense Authorization Act of 1984
In January 1984, the fifth QRMC proposed several new reforms that had never been considered. The first recommendation was to reduce the multiplier rate used to determine the percentage at which retirement annuities were paid. At the time, that multiplier was 2.5%, so service members with 20 YOS would get 50% of their final pay/High-3 (and an additional 2.5% for every year of service thereafter). The fifth QRMC advocated a rate of 2.0%. A second proposal by the fifth QRMC was a reduction in the cost of living adjustment (COLA; Christian, 2006).
Portions of the fifth QRMC’s recommendations were included in the National Defense Authorization Act of 1984; however, the QRMC’s proposal for adjusting the multiplier was not included. Their recommendations included a repeal of the “one-year look-back provision,” which gave retiring service members the option of basing their
12
annuities on the greater of either the previous year’s pay scale or the one in effect at the time of retirement (Christian, 2006). Other changes seemed minor, but led to significant cost savings for the DoD. Similar to civil servant retirement annuities, military annuities were then required to be rounded down to the next dollar, and fractional YOS were also required to be rounded down to the “next lowest whole month” (Christian, 2006).
8. Military Retirement Reform Act of 1986
On July 31, 1986, Congress passed the Military Retirement Reform Act (MRRA) of 1986. Commonly referred to as “Redux,” this legislation used the fifth QRMC’s recommendation to adjust the retirement multiplier from 2.5% to 2.0%. Under the new design, a service member serving for 20 years would receive 40% (2.0% * 20 YOS) of their High-3 basic pay and 3.5% for every year after 20 YOS, up to 30 YOS. COLAs were also targeted in the MRRA. During a retiree’s second-career phase, COLAs were to be reduced by the Consumer Price Index (CPI) minus 1%. At age 62, the service member would receive a “one time restoration of purchasing power followed by CPI minus 1% again” (Christian, 2006).
In 2000, the Defense Science Board (DSB) Task Force on Human Resource Strategy did not recommend cuts in military compensation due to the unfairness of the MRRA. Taking the lead from the DSB, Congress included language in the 2000 Defense Authorization Act which granted service members who entered under the Redux policy the option of returning back to the pre-Redux retirement system, or remaining in the Redux system and receiving a $30,000 Career Status Bonus (CSB) at 15 YOS with a commitment to stay in until at least 20 YOS (Christian, 2006).
B. RECENT PROPOSALS TO MODIFY MILITARY RETIREMENT
For the purposes of this report, recent proposals include those major recommendations made since the 2000 Defense Authorization Act was passed. Because the DBB’s recommendations represent the most recent proposals, and are the focus of this report, a more thorough overview of their recommendations is included. This section
13
relies heavily upon Charles A. Henning’s (2011) Congressional Research Service report entitled Military Retirement Reform: A Review of Proposals and Options for Congress.
1. Defense Advisory Committee on Military Compensation (2006)
In 2005, the SECDEF, Donald H. Rumsfeld, tasked the Defense Advisory Committee on Military Compensation (DACMC) to “identify approaches to balance military pay and benefits in sustaining recruitment and retention of high quality people, as well as a cost-effective and ready military force.” In addition to military retirement, the six-member committee, chaired by Admiral D. L. Pilling, U.S. Navy (Ret.), considered several other compensation sources, including basic pay, special and incentive pays, military healthcare, quality of life compensation, and reserve component compensation. The major findings in their analysis of the current retirement plan were threefold: (1) It defers too much compensation, making it appear to be inefficient; (2) it does not promote management of the force; and (3) it is not equitable because an overwhelming majority of the force does not meet the 20-year vesting requirement. As a result of their observations, the committee recommended extending military careers, allowing for earlier vesting, and introducing a program similar to the TSP in which the government matches service member contributions up to a certain percentage. In their final recommendations for cost savings, the DACMC constructed a three-tiered system consisting of a retirement annuity beginning at age 60, vesting at 10 YOS with a government match of 5% of base pay, and “gate pay,”3 separation pay or transition pay to
produce required retention. Service branches would use tier three for Service-specific force management issues, while tiers one and two would be reserved for all Services (Henning, 2011).
Concerning the DACMC’s recommendations, Philpott stated that “the April report from outside experts would not be the final word. Instead, the findings informed a
3 Gate pay is a form of additional pay or a bonus that is a multiple of basic pay and is payable at key years of service such as 10, 15, 20, 25, and 30 years. It can vary from service member to service member in order to shape their career length in different specialties or for the force in general (Henning, 2011).
14
more extensive pay study about to get underway by the 10th Quadrennial Review of Military Compensation” (2006).
2. 10th Quadrennial Review of Military Compensation (2008)
In 2005, the 10th QRMC was tasked to undergo “a complete review of the principles and concepts of the compensation system for members of the uniformed Services.” Concerning military retirement, the 10th QRMC took the recommendations (i.e., early vesting, age eligibility for retired pay, etc.) and modeled them based on survey feedback the committee received from actual service members. As a result of this approach, the QRMC developed a new proposal, slightly modified from the DACMC’s proposal (Henning, 2011).
In their new proposal, service members would become vested in the DB and DC portions of the retirement system after 10 YOS. For the DB portion, a penalty would be given for retiring with less than 20 YOS. The penalty would delay a service member’s pension to age 60 versus age 57 for those who served more than 20 years. Those serving more than 20 years would have the option of receiving their pension sooner by accepting a 5% reduction for each year below age 57. The government-match percentage for the DC portion would be based on time in service. For less than a year of service, there would be a 0% match, a 2% match for two YOS, a 3% match for two to four YOS, a 4% match for four to five YOS, and a 5% for five or more YOS. As prescribed by the DACMC, the individual Services would control the conditions under which gate pay and separation pay were determined; however, predetermined milestones (e.g., 10 years, 15 years, 20 years) would not be required, giving more flexibility to the Services based on their specific needs (Henning, 2011).
In addition to the requirements described in this section, the QRMC advised the same retirement system for both active and reserves components, and a five year “demonstration project with a limited population to test and refine the proposal” (Henning, 2011, p. 12).
15
3. Defense Business Board Military Compensation Task Group (2011)
In May 2010, SECDEF, Robert Gates, tasked the DBB to “review current Department policies and practices and identify options to materially reduce overhead and increase the efficiency of the Department’s business operations.” A task force was formed by Michael J. Bayer, Chairman of the DBB, who named Richard Spencer as the Military Retirement–Alternative Plans Task Group chair. The task group included six members and a staff analyst. During their research, the task group interviewed “the Department’s current senior leaders, former DoD and other government officials, several defense attachés from foreign ministries, and officials from institutes and government agencies” (DBB, 2011, p. 3). They considered both public and private analyses regarding military retirement over the past three decades. On July 21, 2011, the task group presented its findings to the full board (DBB, 2011).
The task group’s findings, and subsequent recommendations, were a conglomeration of historical recommendations. The task group concluded that “the [current] system was designed in an era when life spans were shorter, draft era pay was substantially less than civilian sector pay, second careers were less common, and skills acquired during military service were not transferable to the private sector.” The steady increase in retirement liability, particularly over the past 10 years, was due to the fact that retirement pay is connected directly to basic pay. “As a result of these increases, today’s regular military compensation is higher than that of average civilians with the same level of education.” Furthermore, where civilian sector 401(k) retirement contributions range from 4–12% per year, military retirement benefits equate to approximately 75% of annual pay per year (Henning, 2011).
The task group drew three main conclusions from their study. First, the system is unfair because, due to the 20-year service requirement, only 17% of service members qualify for the lifetime retirement windfall. Second, force shaping is inflexible due to the design of the current military retirement system. According to the DoD Office of the Actuary, 75% of service members exit the service between 20 and 25 YOS due to cliff vesting. This design makes it “difficult for the DoD to release personnel with 15 years or
16
more of service.” Finally, the military retirement system is unaffordable. “In fiscal year 2011, the retirement plan will accrue 33 cents for each dollar of current pay, for a total of $24 billion” (Henning, 2011, p. 5).
The primary recommendation made by the task group was to transition from a DB plan to a DC plan. In addition to the service member’s own contributions, an unspecified government-match percentage would be invested into the service member’s TSP account. According to the task group’s final report, the match percentage would be “funded at a percentage level comparable to the highest end of a private sector pension plan.” Furthermore, “DoD contributions could vary depending on MOS, circumstances, such as larger contributions for personnel at risk or on hardship tours, needs of the service such as retention pay, or other force shaping purposes.” Regarding vesting, a range of three to five years is offered, and the retirement account would be payable between “ages 60 to 65 or the Social Security age.” Like private sector 401(k) plans, there would be rights for survivorship and allowances for withdrawals under certain circumstances (e.g., education, healthcare, etc.). Reserve and active-duty personnel would qualify for the plan; retired and disabled personnel would not be affected. While the task group did not offer a specific recommendation on the implementation of their plan, their report includes two modeled scenarios: (1) all current military personnel grandfathered into the existing system; and (2) all military personnel immediately transitioned into new plan (Henning, 2011).
C. RECENT STUDIES OF MILITARY RETIREMENT REFORM
As shown in the previous section, military retirement reform has been the subject of numerous studies, commissions, and legislation. In some cases, recommendations survive long enough to be sponsored by a Member of Congress and added into legislation. However, in most cases, they remain only as recommendations. Even for those recommendations surviving debate in Congress, most are stricken down in committee or on the floor. The following section provides an overview into recent studies and surveys concerning military retirement reform and DBB recommendations.
17
1. Alternative Military Retirement Proposals
In her thesis entitled Alternative Active Duty Retirement Plans, Schmidt (2011) combined elements of a DC plan and a DB plan using a Monte Carlo simulation and historical data to propose an alternative retirement plan. The primary alternative feature of this plan is a government contribution into the member’s TSP account in exchange for a reduction in retirement annuity upon retirement. A sensitivity analysis considered various independent factors on retirement such as career length and inflation. Results showed that the alternative plan provided both retiree benefits and cost savings to the government (Schmidt, 2011).
In May 2012, The Center for American Progress (CAP) proposed a three-pronged approach to reducing the costs of military retirement. The CAP agreed with most critics of the current plan saying it was inequitable, inflexible, and unsustainable. A new retirement system would be based on a 401(k)-type plan used in the civilian sector. Those entering the Service at a designated date would be automatically enrolled in the new system. Service members with 10 or more years would have the option of being grandfathered into the current system or transitioning to the new system, while those with less than 10 years could transition into the new 401(k) plan or enroll in a hybrid of the current plan. Under the hybrid plan, service members would be vested at 10 years, but their retirement annuity percentage would be reduced from 50% to 40%, and benefits would not be payable until age 60 (Korb, Rothman, & Hoffman, 2012).
The CAP report concluded that the DBB proposal contained legitimate recommendations for transitioning the military retirement system. The CAP also agreed that the government should follow the growing trend in the private sector and shift to a 401(k) plan in order to cut increasing personnel costs (Korb, Rothman, & Hoffman, 2012).
In June 2012, the Center for Naval Analysis (CNA) released a report entitled
Military Retirement Reform: Effects on Navy’s Personnel Structure and Costs. The purpose of the CNA report was to “study the retirement reform proposals developed by the Office of the Secretary of Defense (OSD) and examine how potential changes to the
18
military retirement system could affect Navy costs and personnel.” By modeling short- and long-run effects on Navy personnel and costs based on proposed reforms, the CNA estimated the dynamic effects of various reform scenarios and the effects of military retirement reform on the federal deficit (Grefer & Phillips, 2012).
The CNA report concluded that by cutting Navy retirement by 20%, the potential annual savings was approximately $1.17 billion per year. However, savings would come at the price of a more junior Navy force in the officer and enlisted ranks. Additionally, anticipating that current service members would be grandfathered into the current retirement system, savings would be reduced incrementally until all new officer and enlisted accessions were under the new plan, estimated to be 30 years (Grefer & Phillips, 2012).
2. Surveys Regarding Retirement Reform and the DBB’s Recommendations
During our research, two surveys were identified that solicited feedback from service members specifically regarding DBB recommendations. The first was conducted by the Fleet Reserve Association (FRA). According to the FRA website, “FRA is a congressionally chartered, non-profit organization that represents the interests of the Sea Service community before the U.S. Congress. Membership is comprised of current and former enlisted members of the U.S. Navy, Marine Corps, and Coast Guard.” A press release issued October 24, 2011, by the FRA said that the online survey had over 1,700 respondents comprised of current and former military service members. The survey was not released to the public, but several statistics from the survey were included in the press release, as follows (n.d.):
• More than 80% of active-duty and reserve component respondents said that they would shorten their term of service if the retirement benefit were changed to reflect the DBB’s recommendations.
• Respondents from the active-duty,reserve, retiree, and veteran communities overwhelmingly predicted that the DBB proposals would be bad for military.
• More than 83% of participants believed fewer people would join the military and serve shorter terms if a 401(k)-type benefit were instituted.
19
In summary, any attempt to “civilianize” military retirement was considered not favorable to respondents of the FRA survey (“FRA Survey Reveals,” n.d.).
The second DBB-related survey was conducted by Lieutenant Colonel Brent Ruhlen (Army; 2012), a student at the Joint Forces Staff College. Included as part of his thesis entitled, Leading While Blindfolded: Examining the Defense Business Board’s Recommendations to Reform the Military Retirement System, Ruhlen’s (2012) online survey was open to active-duty service members and cadets/midshipmen from the service academies and ROTC programs; 114 active-duty service members and nine cadets participated. The author’s goal of the survey was to gain insight into three areas related to the respondents’ attitudes about the DBB proposals. First was the influence of the current military retirement system on the individual’s decision to join the military. The second area was the individual’s military tenure intentions should Congress reform the military retirement system based on the DBB recommendations. Finally, the survey was expected to gauge the respondent’s opinion regarding the fairness of the current system and the fairness of the system proposed in the DBB plan (Ruhlen, 2012). The following statistics highlight some of the notable responses in the survey:
• 61% of respondents responded negatively towards a shift to a defined contribution plan from a defined benefit plan.
• 45% of mid-career respondents (8 to 12 YOS) said that they were less likely to continue serving until retirement under a defined contribution plan; 27% said they would definitely not serve until retirement.
• 78% of respondents who are currently eligible for retirement said that they would leave at the earliest opportunity rather than remain in the military should the DBB proposal be implemented.
• 73% support a gradual transition to a defined contribution plan should it be implemented (Ruhlen, 2012).
While none of our survey questions were identical to Ruhlen’s, other than demographic, his survey questionnaire provided a starting point in the development of this study’s survey.
20
21
III.
MODEL DESCRIPTION
Our model simulated the potential wealth accumulation for an active-duty military officer and an enlisted service member hypothetically participating within the defined contribution retirement plan advocated by the 2011 DBB Military Compensation Task Group. The counterfactual model used historical data for military salaries and TSP fund return rates that coincided with the time period from January 1, 1991, through December 31, 2010. This model gave service members insights about the prospective earnings of an alternative non-disability defined contribution retirement system compared to the current DB plan. For each representative service member, the results were compared to the single lump-sum equivalent, or NPV, of all retirement annuity payments that he or she would receive under the existing High-3 DB retirement system, based on the average age of death, as specified in the DoD Office of the Actuary Statistical Report on the Military Retirement System Fiscal Year 2010. Note that this report was used because it specified the lump-sum equivalent, or NPV, of the retirement annuities for service members retiring December 31, 2010.
A. HISTORICAL DATA 1. Pay Contributions
The Defense Financial and Accounting Service (DFAS) website provided historical salary data for military personnel and was used to calculate the total TSP contributions per month (http://www.dfas.mil/militarymembers/payentitlements /militarypaytables.html). We used the pay data for two categories of active-duty military personnel: (1) a military officer and (2) an enlisted service member. The TSP contributions were derived only from basic pay, exclusive of any other special pay or entitlements.
In our model, we assumed a dollar-for-dollar government-matching contribution rate up to 8% of salary. This rate was selected because it represented the median value of the DBB’s recommendation matching range of 4% to 12%. Therefore, service members
22
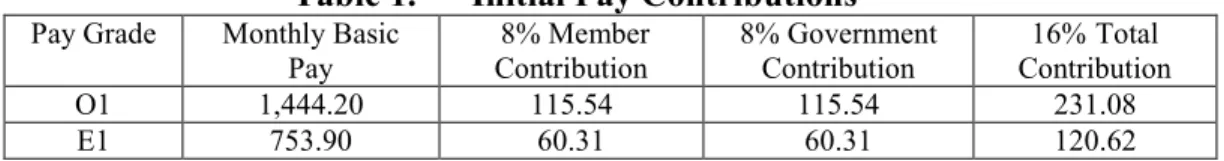
allotting 8% of their income towards the TSP received an additional 8% from the government for a combined total of 16% in TSP contributions per month. We also assumed that the monthly contribution rate remained constant through both service members’ careers. The initial contributions at 16% for officer and enlisted personnel, starting on January 1, 1991, are shown in Table 1.
Table 1. Initial Pay Contributions
The salary data from January 1, 1991, through December 31, 2010, was used because they represent a service member’s career progression through 20 years of active-duty service.
2. TSP Funds
The TSP funds represent investments in the following categories:
• The Common Stock Index Investment Fund (C Fund) invests in stocks that comprise the Standard & Poor’s 500 (S&P 500). As of December 31, 2011, the C Fund earned a return rate of 9.23% since its inception on January 29, 1988, compared to the S&P 500 Index of 9.45% for the same period (Federal Retirement Thrift Investment Board, 2011a).
• The Fixed Income Index Investment Fund (F Fund), as the name implies, invests in fixed-income securities. The Federal Retirement Thrift Investment Board invests in an index fund that tracks the Barclays Capital U.S. Aggregate Bond Index, which was formerly known as the Lehman Brothers U.S. Aggregate Index. As of December 31, 2011, the F Fund, earned 7.12% in returns since its inception on January 29, 1988, compared to the Barclays U.S. Aggregate Index of 7.37% for the same period (Federal Retirement Thrift Investment Board, 2011b).
• The Government Securities Investment Fund (G Fund) invests in short-term non-marketable U.S. Treasury securities that are specifically issued to the TSP. The U.S. government guarantees the payment of the principle and interest. As of December 31, 2011, the G Fund earned a return rate of 5.86% since its inception on April 1, 1987 (Federal Retirement Thrift Investment Board, 2011c).
Pay Grade Monthly Basic Pay 8% Member Contribution 8% Government Contribution 16%Total Contribution O1 1,444.20 115.54 115.54 231.08 E1 753.90 60.31 60.31 120.62
23
• The International Stock Index Investment Fund (I Fund) invests in international stocks traded in the European, Australian, and Asian stock markets. The benchmark index is the Morgan Stanley Capital International EAFE (Europe, Australasia, Far East) Index. As of December 31, 2011, the I Fund earned 2.79% since its inception on May 1, 2001, compared to its benchmark index of 2.80% (Federal Retirement Thrift Investment Board, 2011d).
• The Small Capitalization Stock Index Investment Fund (S Fund) invests in an index of U.S. common stocks excluding those that are held in the C Fund. The S Fund tracks the Dow Jones U.S. Completion TSM Index which represents approximately 25% of the market value of the U.S. Stock Market. As of December 31, 2011, the S Fund earned a return rate of 6.11% since its inception on May 1, 2001, compared to the Dow Jones U.S. Completion TSM Index of 6.14% (Federal Retirement Thrift Investment Board, 2011e).
The historical monthly and annual return rates for these funds were found on the TSP website. For brevity, the annual return rates are shown in Table 2. However, for this model, we used monthly compounding and used the actual historical return rates to calculate the gains or losses for each service members’ investment portfolio.
Table 2. Annual Returns With Standard Deviations for TSP G, F, C, S, and I Funds G Fund F Fund C Fund S Fund I Fund
1991 8.15% 15.74% 30.76% 1992 7.24% 7.21% 7.71% 1993 6.13% 9.52% 10.12% 1994 7.22% -2.97% 1.33% 1995 7.03% 18.30% 37.39% 1996 6.76% 3.66% 22.85% 1997 6.76% 9.61% 33.17% 1998 5.76% 8.74% 28.44% 1999 5.99% -0.86% 20.95% 2000 6.42% 11.65% -9.14% 2001 5.39% 8.57% -11.95% -9.03% -21.94% 2002 4.99% 10.27% -22.04% -18.14% -15.96% 2003 4.14% 4.10% 28.52% 42.91% 37.92% 2004 4.29% 4.30% 10.79% 18.03% 20.01% 2005 4.49% 2.41% 4.96% 10.48% 13.63% 2006 4.94% 4.39% 15.80% 15.32% 26.31% 2007 4.87% 7.08% 5.55% 5.50% 11.44% 2008 3.73% 5.46% -37.00% -38.32% -42.43% 2009 3.00% 6.00% 26.68% 34.83% 30.04% 2010 2.81% 6.71% 15.06% 29.08% 7.94% 2011 2.46% 7.89% 2.12% -3.40% -11.81% St. Dev .15% 1.09% 4.30% 5.72% 5.48%
24
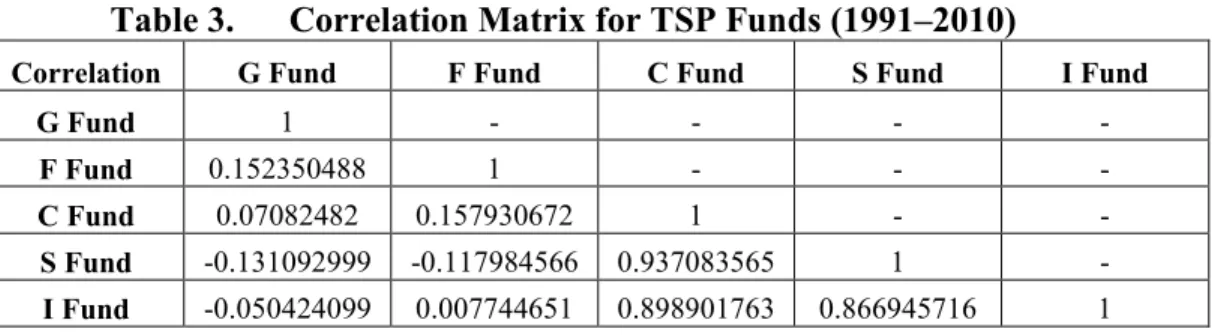
Additionally, from these historical values, we calculated the standard deviations and correlations. The correlation matrix is shown in Table 3. and depicts the degree of relationship between any two funds. Values closer to +1 or -1 denote a strong linear relationship; values close to 0 denote no relationship (Brealey, Myers, & Allen, 2011). For example, the S Fund and the C Fund showed a high degree of correlation (0.937), whereas the I Fund and F Fund showed no correlation (0.00774). The annual return rates and the degrees of correlation are shown in Figure 3
Table 3. Correlation Matrix for TSP Funds (1991–2010)
Correlation G Fund F Fund C Fund S Fund I Fund
G Fund 1 - - - -
F Fund 0.152350488 1 - - -
C Fund 0.07082482 0.157930672 1 - -
S Fund -0.131092999 -0.117984566 0.937083565 1 -
I Fund -0.050424099 0.007744651 0.898901763 0.866945716 1
Figure 3. Annual Returns for TSP G, F, C, S, and I Investment Funds (1998–2011)
B. INVESTMENT TIME HORIZON
Other important considerations for retirement savings are an investor’s time horizon and risk tolerance. The time horizon represents the duration in which an individual invests in order to achieve their financial goals. Risk tolerance is an
25
individual’s willingness to lose a portion or all of their investments in exchange for greater future returns (Securities Exchange Commission [SEC], 2009). Generally, both considerations are complimentary; investors with longer time horizons are more likely to be risk tolerant, whereas investors with shorter time horizons are less risk tolerant. For our model, we assumed an investment time horizon of 20 years and a high degree of risk tolerance because of the investor’s age.
C. PORTFOLIO DIVERSIFICATION
There are various opinions about how to diversify investment fund portfolios. For aggressive investors, Investopedia.com advocates a portfolio comprised of 80% to 100% stocks, 0% to 10% bonds, and 0% to 10% cash and equivalents. Conversely, for conservative investors, Investopedia advocates a portfolio comprised of 70% to 75% bonds, 15% to 20% stocks, and/or 5% to 15% cash and equivalents (Carther, 2009). Similarly, SmartMoney.com advocates that an investor’s age represent the percentage allocation for bond funds with the remaining difference allocated to stock funds (SmartMoney, 2011). For example, a 23-year-old investor would have a portfolio comprised of 77% stock funds and 23% bonds funds. Applying both principles, an extremely aggressive portfolio would consist entirely of stock funds, whereas an extremely conservative portfolio would consist entirely of bond funds. Of course, there are more complicated techniques that an investor can use to obtain higher returns. But, given the limitations of staying within TSP, we focused on the following three investment portfolio scenarios:
• a retirement portfolio advocated by Investopedia and consisting of 90% stock assets and 10% bond assets;
• a retirement portfolio similar to what SmartMoney.com advocates in which the investor’s age corresponds to the percentage allocated to bond funds and the remainder to stock funds per year; and
• a retirement portfolio that maximizes the return to risk ratio, that is, the Sharpe Ratio.
26
For these various portfolios, we assumed all gains or losses were carried forward throughout the entire investment period; there were no withdrawals. Additionally, for each year, we also assumed that only two TSP investment funds were considered: one stock fund and one bond fund.
D. CAREER PROGRESSION
For our model, we only considered two categories of active-duty personnel: (1) a military officer and (2) an enlisted service member; no warrant officers and no prior-enlisted members receiving an officer commission were considered. For simplicity, the model only required that the personnel satisfied the minimum time requirements in each pay grade before advancing to their next respective pay grades. There was no consideration for factors such as promotion board results, performance evaluations, and duty assignments. We assumed that both categories of personnel entered military service on January 1, 1991, and retired on December 31, 2010. We also assumed that promotions for both categories of personnel occurred on January 1 of each year.
We assumed that enlisted personnel entered military service at 20 years old and at the E1 pay grade. Since the average time in grade varied amongst the Services, this model assumed the career progression shown in Table 4. (Powers, 2012). For example, an enlisted service member advancing from E1 to E2 accumulated approximately nine months in service; an enlisted member advancing from E7 to E8 served 12 years of active duty, and so forth. For simplicity, any time in grade that was less than a year was rounded up. Conceivably, an enlisted service member can retire at age 40 and at the E8 pay grade.
27
Table 4. Enlisted Personnel Career Progression Pay
Grade
Minimum Time in Rate [months] Cumulative Time [years] E1 9 .75 E2 9 1.5 E3 6 2 E4 12 3 E5 36 6 E6 36 9 E7 36 12 E8 36 15 E9 36 18
Likewise, we also assumed that an officer followed a career progression that fulfilled the minimum time requirements for each pay grade, as shown in Table 5. We assumed that the officer was commissioned as an O1 at age 23. By the time an officer advanced from O1 to O2, then the officer would have accumulated two years of active-duty service. Similarly, by the time that the officer attained the O5 pay grade, then the officer would have served at least 16 years of active-duty service. Conceivably, an officer could retire at age 43 and at the rank of O5.
28
Table 5. Officer Career Progression
(Office of the Under Secretary of Defense for Personnel and Readiness [OUSD(P&R)], 2009)
Pay Grade Minimum Time in Grade
[years] Cumulative Time [years] O1 2 2 O2 2 4 O3 4 8 O4 3 10 +/- 1 year O5 3 16 +/- 1 year O6 3 22 +/- 1 year E. LIFE EXPECTANCY
The DoD Office of the Actuary’s Statistical Report on the Military Retirement System Fiscal Year 2010, specified the life expectancies for military retirees, as shown in Table 6. For example, a male enlisted retiree is expected to live another 39 years before dying at age 79. Male officers lived slightly longer, but female officers lived the most years after retirement (DoD Office of the Actuary, 2011).
Table 6. Life Expectancy for Military Retirees [Yrs]
Category Age at
Retirement
Male Avg Age at
Death
Female Avg Age at
Death
Enlisted 40 38.8 79 41.6 82


![Table 6. Life Expectancy for Military Retirees [Yrs]](https://thumb-us.123doks.com/thumbv2/123dok_us/10706322.2958922/47.918.154.772.745.902/table-life-expectancy-military-retirees-yrs.webp)


