U.S. Department of Education Institute of Education Sciences NCES 2003–036
Young Children’s Access
to Computers in the
Home and at School
in 1999 and 2000
Amy H. Rathbun Education Statistics Services Institute Jerry West National Center for Education Statistics Elvira Germino Hausken
Project Officer National Center for Education Statistics U.S. Department of Education
Institute of Education Sciences NCES 2003–036
Young Children’s Access
to Computers in the
Home and at School
in 1999 and 2000
U.S. Department of Education Rod Paige
Secretary
Institute of Education Sciences Grover J. Whitehurst
Director
National Center for Education Statistics Val Plisko
Associate Commissioner
The National Center for Education Statistics (NCES) is the primary federal entity for collecting, analyzing, and reporting data related to education in the United States and other nations. It fulfills a congressional mandate to collect, collate, analyze, and report full and complete statistics on the condition of education in the United States; conduct and publish reports and specialized analyses of the meaning and significance of such statistics; assist state and local education agencies in improving their statistical systems; and review and report on education activities in foreign countries.
NCES activities are designed to address high priority education data needs; provide consistent, reliable, complete, and accurate indicators of education status and trends; and report timely, useful, and high quality data to the U.S. Department of Education, the Congress, the states, other education policymakers, practitioners, data users, and the general public.
We strive to make our products available in a variety of formats and in language that is appropriate to a variety of audiences. You, as our customer, are the best judge of our success in communicating information effectively. If you have any comments or suggestions about this or any other NCES product or report, we would like to hear from you. Please direct your comments to:
National Center for Education Statistics Institute of Education Sciences
U.S. Department of Education 1990 K Street NW
Washington, DC 20006–5651 March 2003
The NCES World Wide Web Home Page address is http://nces.ed.gov
The NCES World Wide Web Electronic Catalog is: http://nces.ed.gov/pubsearch
Suggested Citation
U.S. Department of Education, National Center for Education Statistics. Young Children’s Access to Computers in the Home and at School in 1999 and 2000, NCES 2003–036, by Amy H. Rathbun and Jerry West. Project Officer: Elvira Germino Hausken. Washington, DC: 2003.
For ordering information on this report, write: U.S. Department of Education
ED Pubs P.O. Box 1398
Jessup, MD 20794–1398 Or call toll free 1–877–4ED–Pubs Content Contact:
Jerry West (202) 502–7335
iii
Acknowledgments
We wish to recognize the 20,000 parents and the more than 8,000 kindergarten teachers and first-grade teachers who participated during the first 2 years of the study. We would like to thank the administrators of the more than 1,200 schools we visited across the United States for
allowing us to work with their children, teachers and parents, and for providing us with
information about their schools. We are especially appreciative of the assistance we received from the Chief State School Officers, district superintendents and staff, and private school officials.
We would like to thank John Bailey at the U.S. Department of Education’s Office of Educational Technology for his support during the planning and preparation of this report. Special thanks go to Sarah Kaffenberger of the Education Statistics Services Institute (ESSI) and Thea Kruger (formerly with ESSI) for their review of the existing literature on children’s computer access, and to Andrea Timashenka of Pennsylvania State University at University Park for her quality control review of the report. We also thank Elvie Germino Hausken of the National Center for Education Statistics (NCES); Jonaki Bose, Bureau of Transportation Statistics, U.S. Department of
Transportation (formerly with NCES); Kristin Denton, Jill Walston, Lizabeth Reaney, Emily Rosenthal, Nikkita Willis, and DeeAnn Brimhall of ESSI; and Naomi Prakash (formerly with ESSI) for their hard work and dedication in supporting all aspects of the Early Childhood Longitudinal Study, Kindergarten Class of 1998–99 (ECLS-K) program. We appreciate the technical review comments provided by Bill Hussar (NCES) and David Miller, Emily Dill, Jason Sellers, and Linda Shafer (ESSI). We would also like to recognize the input we received from NCES staff members Chris Chapman, Barbara Holton, Andrew Malizio, and Laurence Ogle, and from outside reviewers Margaret Burchinal, Frank Porter Graham Child Development Institute, University of North Carolina; Eric C. Newburger, Census Bureau; and Jean Osborn, Education Consultant, Champaign, Illinois.
Westat, Incorporated—in affiliation with the Institute for Social Research and the School of Education at the University of Michigan, and the Educational Testing Service, under the direction of NCES—conducted the base-year and first-grade study. We would like to express our appreciation for the efforts of the staff from each of these organizations, and especially to the more than 400 field staff who conducted the child assessments and parent interviews in Fall 1998, Spring 1999, Fall 1999, and Spring 2000.
We wish to acknowledge the support that we have received from the Head Start Bureau of the Administration on Children and Families of the U.S. Department of Health and Human Services; the Economic Research Service of the U.S. Department of Agriculture; the National Institute for Child Health and Human Development; and the U.S. Department of Education’s Office of Special Education Programs, Office of English Language Acquisition, and Planning and Evaluation Service.
A special thank you to Kendra Chandler Webb, age 9 (1994), for designing the ECLS logo, and to Westat for aiding in the design of the cover.
v
Executive Summary
Over the past decade, technology has changed at such a rapid pace that computers and Internet access are fast becoming indispensable features of modern life. Computer literacy and skills are increasingly necessary in a knowledge-based economy. More children are being introduced to computers than ever before, evidenced by the fact that in 2000 65 percent of children had access to a home computer, compared with 32 percent in 1993 (Newburger 1999; 2001). Students’ use of computers at school also increased from 61 percent in 1993 to 71 percent in 1997 (Newburger 1999).
As part of the No Child Left BehindAct of 2001 (NCLB, P.L. 107-110), the Enhancing Education Through Technology (ED Tech) program seeks to improve achievement in elementary and secondary schools through the use of technology, to assist students to become technically literate by the eighth grade, and to ensure that teachers integrate technology into the curriculum to improve student achievement. There are also provisions in the act to provide funding for schools to purchase technology resources to further the program’s goals.
As computers become more prevalent and computer skills more necessary, there continues to be a “digital divide” between those with computer access and skills and those without. Already, gaps exist across racial/ethnic groups and family income levels with respect to computer
ownership and Internet usage (Economics and Statistics Administration 2000). For instance, a lower percentage of Black and Hispanic households have Internet access in their homes,
compared to the national average (Newburger 2001). These differences are less pronounced in schools, where children’s access to computers and the Internet are more prevalent. In a 1999 U.S. Department of Education study, almost all public school teachers (99 percent) indicated that computers were available in their schools, and the nationwide ratio of students to
instructional computers was about 6 to 1 (Smerdon et al. 2000). The Department also reported that 95 percent of all public schools had access to the Internet in 1999, compared with only 35 percent in 1994 (Snyder and Hoffman 2002).
vi
Few studies have focused exclusively on kindergartners’ and first-graders’ access to and use of computers in different settings. Reports that exist on students’ computer access and use either focus on upper elementary and high school students (Becker 2000), or combine prekindergarten and kindergarten children into one category and elementary school children (grades 1–8) into a second category (Snyder and Hoffman 2002) when reporting information.
The Early Childhood Longitudinal Study, Kindergarten Class of 1998–99 (ECLS-K) provides a unique opportunity to describe children’s access to and use of computers in their schools, classrooms, and homes as they begin formal schooling. The computer resources identified in this report include access in schools to computer labs, CD-ROMs, local area networks (LAN), and wide area networks (WAN)/Internet; access in classrooms to computer areas and teachers trained in using computers and technology; and access in homes to computers and the Internet. The report also looks at the ways in which young children use computers at home and school. For example, information is provided on children’s frequency and types of home computer use, and on the frequency with which children use computers in their classrooms for different instructional purposes. In addition, the report examines changes in computer resources and use from kindergarten to first grade and looks at the relationship between computer resources and computer use.
Children’s access to and use of computers in their schools, classrooms, and homes are
examined overall and in relation to children’s sex, race/ethnicity, socioeconomic status (SES)1, and disability status. In addition, children’s use of computers for various instructional purposes is compared by several characteristics of their teachers and classrooms.
1This composite in the ECLS-K database is derived from the following variables: mother/female guardian’s
education level, father/male guardian’s education level, mother/female guardian’s occupation, father/male guardian’s occupation, and household income.
vii
Research Questions
Data from the ECLS-K are used to examine 10 questions related to young children’s access to and use of computers.
Access to Computer Resources
1. What computer resources are available in the schools, classrooms, and homes of kindergartners?
2. Are these resources equally available to girls and boys, economically disadvantaged and advantaged students, and minority and nonminority children?
3. What school and classroom computer resources are available to children from homes with various computer resources?
4. Does the level of computer resources that are available in the schools, classrooms, and homes of young children change from kindergarten to first grade?
Use of Computer Resources
5. How frequently do kindergartners use computers in their classrooms and homes, and for what purposes?
6. Do certain groups of children use computers more often than others in each of these learning environments?
7. Does the frequency of children’s use of computers in their homes, classrooms, and schools change from kindergarten to first grade?
8. How frequently do young children use computers over summer vacation?
9. What opportunities do children with and without home computer resources have to use computers in their classrooms?
10. Do children who use computers more often at home also use them more often in their classrooms?
viii
Data Source
The ECLS-K, sponsored by the U.S. Department of Education’s National Center for Education Statistics (NCES), is a multisource, multimethod study that focuses on children’s early
education, beginning with a nationally representative sample of kindergartners in the fall of 1998 and following them through the spring of fifth grade. The ECLS-K includes measures of
children’s health and socioemotional status, academic achievement, and their family,
classroom, school, and community environments. The study collects information directly from the children and their families, teachers, and schools. The full ECLS-K base-year sample is comprised of approximately 22,000 public and private school children who attended over 1,200 kindergarten programs during the 1998–99 school year.
Data for this report are from the kindergarten and first-grade waves of data collection.2 The first set of results on computer resources (i.e., tables 3, B-1, B-2, and B-3) showed significant differences in kindergartners’ computer access by school control (public vs. private). Thus, the majority of the report presents results for public school children so that any variations found in computer access and use related to child and classroom characteristics would not be
confounded by school control. The majority of this report is based on 14,666 public school kindergartners and 11,456 public school first-grade children.3
Findings
Findings in this report are organized into the two sections identified by the research questions. Part one describes parents, teachers, and school administrators’ reports of young children’s access to computer resources in their schools, classrooms, and homes. Results are presented for the population of kindergarten and first-grade children and in relation to child and family characteristics. Part two describes ways in which young children were reported to use computers in their classrooms and homes. Results in this section are presented for the
2Data for kindergarten children are weighted by the round 2 parent cross-sectional weight, C2PW0; data for summer
computer use prior to first grade are weighted by the round 3 parent cross-sectional weight, C3PW0; and first-grade data are weighted by the round 4 cross-sectional parent weight, C4PW0.
3Children who repeated kindergarten while in the study were not included in the analysis of first-grade data.
Approximately 5 percent of kindergartners were not promoted to first grade by the second year of the ECLS-K data collection.
ix
population of kindergarten and first-grade children and in relation to child, family, teacher, and classroom characteristics. All comparisons made in the text were tested for statistical
significance to ensure that differences are larger than might be expected, due to sampling variation. All differences reported were significant at the .05 level.4
Young Children’s Access to Computers
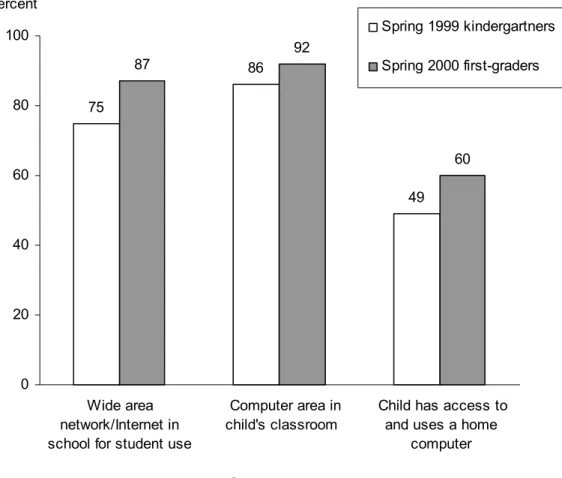
Almost all young children had access to computers, either at home or in their classrooms and schools. However, kindergartners’ access to computer resources differed by the type of school they attended (tables 3, B-1, and B-2). Public school kindergartners had greater access to school and classroom resources, whereas private school children had greater access to home computer resources. Focusing on public school children, the findings showed that children’s access to most computer resources at school and home increased from kindergarten to first grade (figure A, table 5). Changes in children’s access to computer resources may be due not only to the change in grade level but also to the general growth in computer resources from the Spring of 1999 to the Spring of 2000.
School computer resources. For the most part, young children’s access to school computer
resources did not differ greatly by child and family characteristics (tables B-4, B-6, B-7, B-8, and B-9). However, in kindergarten some minority children and those from lower-SES families were less likely to attend schools that provided Internet access to students than other children. In first grade, children from the lowest SES group continued to have less student access to the Internet in comparison to first-graders in the highest SES group.
Classroom computer resources. Kindergarten and first-grade children in the lowest SES
group were less likely to have a computer area in their classroom than children in the highest SES group (tables B-7 and B-11).In kindergarten, access to computer areas in the classroom and to teachers who had attended computer/technology workshops did not differ by children’s race/ethnicity. In contrast, Hispanic first-graders were less likely than White first-graders to have a computer area in their classroom, and were less likely than White and Black first-graders to have teachers who had attended a computer/technology workshop during the school year.
4Not all statistically significant differences are discussed in this report. Due to the large sample size, many
differences (no matter how substantively minor) are statistically significant. Thus, only differences of 5 percent or more between groups are reported, unless an activity is very infrequent (e.g., Internet use) or a resource is rarely available (e.g., Internet access).
x
Figure A. Percent of public school children who had access to various computer resources in their schools, classrooms, and homes: Kindergarten of spring 1999 and first grade of spring 2000
SOURCE: U.S. Department of Education, National Center for Education Statistics, Early Childhood Longitudinal Study, Kindergarten Class of 1998–99 (ECLS-K), Spring 1999 and Spring 2000.
Home computer resources. In kindergarten and first grade, children from low-SES families
were least likely to have access to home computers. Black and Hispanic kindergartners and first-graders were less likely to have home computer access than White and Asian/Pacific Islander children (tables 4 and 6). The same patterns were detected for kindergartners’ home access to the Internet. Also, in first grade, children with disabilities were less likely to have access to home computers than children without disabilities.
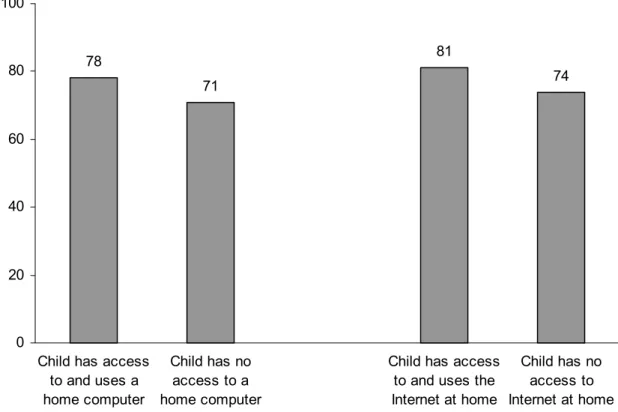
Relationship between home and school computer resources. For the most part, young
children’s access to school and classroom computer resources did not differ by their level of home computer resources. However, a higher percentage of kindergartners who had access to
75 86 49 87 92 60 0 20 40 60 80 100 Wide area network/Internet in school for student use
Computer area in child's classroom
Child has access to and uses a home
computer Computer resources Percent Spring 1999 kindergartners Spring 2000 first-graders Computer resources
xi
and used computers and the Internet at home attended schools that provided Internet access for students, compared to kindergartners without home computer resources (figure 3, table B-8).
Young Children’s Use of Computers
Classroom computer use. The majority of young children in public schools were in classrooms
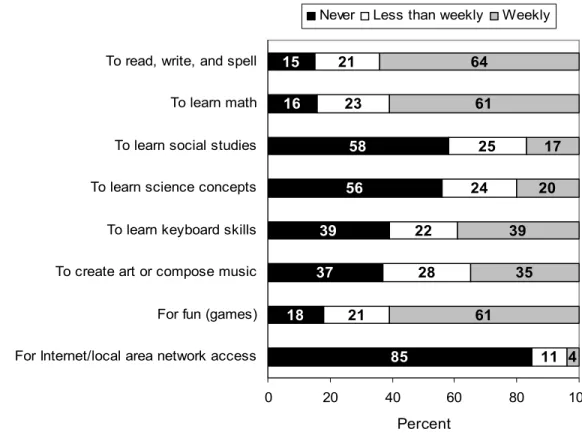
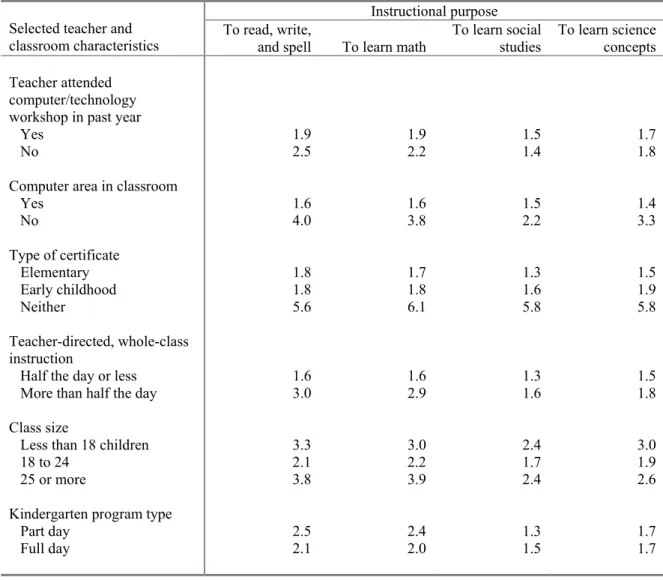
where computers were used for instructional purposes on a weekly basis. The most frequent classroom uses for computers were to learn reading, writing, and spelling; to learn math; and for fun (figure B). Classroom Internet use for young children was not prevalent; 4 percent of public school kindergartners and 9 percent of public school first-graders accessed the Internet on a weekly basis in their classes. Young children’s use of computers in the classroom for different instructional purposes tended to vary by teacher and classroom characteristics (tables 8, B-13, and B-14). For instance, kindergartners participating in full-day kindergarten programs and those with computer areas in their classrooms were more likely to be in classes that used the computer on a weekly basis for reading, writing, and spelling; mathematics; social studies; keyboarding instruction; art creation or music composition; and fun than children in part-day kindergarten programs and those without computer areas in their classrooms. Also,
kindergartners whose teachers participated in computer/technology workshops and those whose teachers did not spend more than half of the instructional day in teacher-directed, whole-class activities were more likely to be in whole-classes that used the computer on a weekly basis for these purposes than kindergartners whose teachers had not attended computer/technology workshops during the school year or those whose teachers spent more than half of the
instructional day in teacher-directed, whole-class activities. These patterns were consistent for first-grade children as well.
Home computer use. Public school children who had access to home computers used them an
average of 3 to 4 days a week (tables 9 and 11). Over 85 percent of young children with home computers used them for educational purposes. The frequency with which kindergarten and first-grade children used home computers did not tend to differ by child or family characteristics; however, the purposes for which young children used computers at home varied by children’s sex, race/ethnicity, and SES. For example, family SES was positively related to children’s use of home computers for educational purposes overall and for those children who had access to home computers. In kindergarten, girls who had access to home computers used them more often for art or drawing programs than boys did. Also, White kindergartners with home computer
xii
access were more likely than Hispanic and Asian/Pacific Islander kindergartners to use them to play with educational programs, and more likely than Black or Hispanic kindergartners to use them for art or drawing programs.
Figure B. Percentage distribution of the frequency that public school kindergartners used computers in their classrooms for different instructional purposes: Spring 1999
SOURCE: U.S. Department of Education, National Center for Education Statistics, Early Childhood Longitudinal Study, Kindergarten Class of 1998–99 (ECLS-K), Spring 1999.
In the summer prior to first grade, few public school children used computers in structured summer programs (table 12). However, almost three-quarters of children used home computers in the summer on a weekly basis to play games5 or for educational purposes (table 14). The percentage of public school children using computers for different purposes in the summer also
5Parents were asked how often their child used the computer for games like Nintendo or Sega over a 1-week time
period. No definition of “computer” was provided to respondents; thus, it is possible that some parents may have included other noncomputer game devices (e.g., handheld or TV game systems) when responding to the item.
85 18 37 39 56 58 16 11 21 28 22 24 25 23 21 4 61 35 39 20 17 61 64 15 0 20 40 60 80 100
For Internet/local area network access For fun (games) To create art or compose music To learn keyboard skills To learn science concepts To learn social studies To learn math To read, write, and spell
In st ru ct io na l p ur pos e f or c las sr oo m c om put er us e Percent
xiii
varied by children’s sex, race/ethnicity, and SES. In the summer, a higher percentage of boys than girls, and a higher percentage of White than Hispanic children used home computers. Family SES was also positively related to children’s summer computer use.
Relationship between home and classroom computer use. Young children’s classroom
computer use in public schools did not differ based on whether children had home access to computers or the Internet (table 15). In addition, there was no significant relationship between the frequency of home computer use and the frequency of classroom computer use for different instructional purposes for young children attending public schools (tables B-16 and B-17).
Conclusion
Although almost all young children had access to computers, at home or in their classrooms and schools, the differences in the amount of access varied according to children’s school type, race/ethnicity, and family SES. Public school kindergartners tended to have greater access to school and classroom computer resources, whereas private school kindergartners had greater access to home computer resources. Young children’s access to most computer resources in public schools did not differ greatly by child and family characteristics; however, in kindergarten some minority children, those from lower SES families, and those without home computer resources were less likely to attend schools that provide student access to the Internet. In terms of classroom computer resources, kindergartners and first-graders from the lowest SES group were less likely to have a computer area in their classroom than children in the highest SES group. In first grade, public school Hispanic children were less likely to have access to
computers in their classrooms than White children, and Hispanic first-graders were less likely to have teachers who had attended a computer/technology workshop than White and Black first-graders—findings that did not occur in kindergarten. In terms of home computer resources, public school children’s access varied by race/ethnicity and family SES, with minority and disadvantaged children being less likely to have home access to computer resources in kindergarten and first grade. Public school children’s access to computer resources at school and home tended to increase as they moved from kindergarten to first grade.
Over half of all public school children attended classrooms where computers were used for various instructional purposes at least once a week. Young children’s use of computers in their classrooms differed, however, by several classroom characteristics, including kindergarten
xiv
program type (part day vs. full day), teachers’ attendance at computer/technology workshops during the school year, presence of a computer area in the classroom, and the proportion of time classes spent in teacher-directed, whole-class instruction.
For those public school young children with access to home computers, all children used their home computers an average of about 3 to 4 days each week. However, the purposes for which young children used home computers during the school year and over summer vacation (e.g., to access the Internet, play educational games) varied by children’s sex, race/ethnicity, and SES. The ECLS-K provides a wealth of information on children’s cognitive, socioemotional, and physical development from kindergarten through fifth grade across multiple contexts, including the home, classroom, school, and community. Since this report shows differences in computer access and use between public and private school children, additional analyses could focus on child and family characteristic differences within private school settings. Based on the findings from this report, future research could also examine the relationships between children’s access to and use of computers in different settings with their academic achievement over time. Also, information on computer resources and use could be further explored at the school and classroom level to identify differences based on characteristics of the schools that young children attend. For example, children’s access to school computer resources could be examined in terms of school size, grade range, federal program participation, urbanicity, and region.
xv
Table of Contents
Acknowledgments ...iii
Executive Summary ... v
I. Introduction ... 1
Research Questions... 3
Data Source ... 4
Measures ... 8
Limitations ... 11
II. Access to Computer Resources... 13
III. Use of Computer Resources ... 25
IV. Conclusion ... 41
V. Methodology and Technical Notes... 45
VI. References ... 55
Appendix A—Standard Error Tables for Main Text ...A-1
Appendix B—Supplementary Tables and Standard Errors ...B-1
xvi
List of Figures
Executive Summary Figures
Figure A.
Percent of public school children who had access to various computer
resources in their schools, classrooms, and homes: Kindergarten of spring
1999 and first grade of spring 2000 ... x
Figure B.
Percentage distribution of the frequency that public school kindergartners
used computers in their classrooms for different instructional purposes:
Spring 1999 ...xii
Text Figures
Figure 1.
Percent of public school kindergartners attending schools with Internet
access for students, by child's race/ethnicity: Spring 1999 ... 17
Figure 2. Percent of public school kindergartners who had access to and used
computers and the Internet in their homes, by family socioeconomic status
(SES): Spring 1999... 19
Figure 3.
Percent of public school kindergartners who had student access to
Internet/wide area networks (WAN) in their schools, by level of access to
home computer resources: Spring 1999 ... 20
Figure 4.
Percentage distribution of the frequency that public school kindergartners
used computers in their classrooms for different instructional purposes:
Spring 1999 ... 26
xvii
List of Text Tables
Table 1.
Sample size, population size, and percent of kindergarten children by
school control and by selected school, classroom, and child
characteristics: Spring 1999... 6
Table 2.
Sample size, population size, and percent of first-grade children by school
control and by selected school, classroom, and child characteristics:
Spring 2000 ... 7
Table 3.
Percent of kindergartners who had access to various computer resources
in their schools, classrooms, and homes, by school control: Spring 199914
Table 4.
Percent of public school kindergartners who had access to and used
computers and the Internet in their homes, by selected child and family
characteristics: Spring 1999... 18
Table 5.
Percent of public school kindergarten and first-grade children who had
access to various computer resources in their schools, classrooms, and
homes: Spring 1999 and spring 2000 ... 21
Table 6.
Percent of public school first-graders who had access to and used a home
computer, by selected child and family characteristics: Spring 2000 ... 23
Table 7.
Percent of public school kindergartners who used home computers for
various purposes, overall and for those with access to a home computer:
Spring 1999 ... 27
Table 8.
Percent of public school kindergartners in classrooms that used
computers on a weekly basis for various instructional purposes, by
selected teacher and classroom characteristics: Spring 1999 ... 29
Table 9.
Among public school kindergartners with access to and who used a home
computer, mean number of days per week they used home computers,
and percent that used home computers for various purposes, by selected
child and family characteristics: Spring 1999 ... 32
Table 10.
Percent of public school kindergarten and first-grade children that used
computers on a weekly basis in their classrooms for various instructional
purposes: Spring 1999 and spring 2000 ... 33
xviii
Table 11.
Among public school first-graders with access to and who used a home
computer, mean number of days per week they used computers in their
homes, and the percent who used them for educational purposes, by
selected child and family characteristics: Spring 2000... 35
Table 12.
Percent of public school children who attended summer school or summer
camp programs in the summer prior to first grade and who used
computers in the summer programs: Fall 1999... 36
Table 13.
Percentage distribution of the frequency that public school first-graders
used computers in their homes for different purposes in the summer prior
to first grade: Fall 1999 ... 37
Table 14.
Percent of public school first-graders who used a home computer in the
past summer for various purposes, by selected child and family
characteristics: Fall 1999 ... 38
Table 15.
Percent of public school kindergartners that used computers in their
classrooms on a weekly basis for various instructional purposes, by level
of home computer and Internet access: Spring 1999 ... 39
1
I. Introduction
Over the past decade, technology has changed at such a rapid pace that computers and Internet access are becoming indispensable features of modern life. In September of 2001, over half of U.S. households owned a computer and half of all Americans were using the Internet (Economics and Statistics Administration 2002). Computer literacy and skills are increasingly necessary in a knowledge-based economy. More children are being introduced to computers than ever before, evidenced by the fact that in 2000 65 percent of children had access to a home computer, compared with 32 percent in 1993 (Newburger 1999; Newburger 2001). Students’ use of computers at school also
increased from 61 percent in 1993 to 71 percent in 1997 (Newburger 1999).
In addition, more children are being introduced to computers at a young age than ever before. For instance, prekindergarten and kindergarten children’s use of home
computers nearly doubled from 16 percent in 1993 to 30 percent in 1997, and school computer use for this age group increased from 26 percent to 36 percent in the same time period (Snyder and Hoffman 2002).
As computers become more prevalent and computer skills more necessary, there continues to be a “digital divide” between those with computer access and skills and those without. Already, gaps exist across racial/ethnic groups and family income levels with respect to computer ownership and Internet usage (Economics and Statistics Administration 2000). In 2000, 43 percent of Black, non-Hispanic children (ages 3–17) and 37 percent of Hispanic children had a computer in their home, compared to 77 percent of White, non-Hispanic children. In terms of Internet usage in the same year, there was a 21 percentage point difference between Internet access rates for both Blacks and Hispanics compared to the nationwide average (Newburger 2001).
Such differences are less pronounced in schools, where children’s access to computers and the Internet are more prevalent. In a 1999 U.S. Department of Education study, almost all public school teachers (99 percent) indicated that computers were available in their schools, and the nationwide ratio of students to instructional computers was about 6 to 1 (Smerdon et al. 2000). The Department also reported that 95 percent of all public
2
schools had access to the Internet in 1999, compared with only 35 percent in 1994 (Snyder and Hoffman 2002).
The No Child Left BehindAct of 2001 (NCLB, P.L. 107-110) contains provisions for increasing technology use in schools. The new Enhancing Education Through
Technology (ED Tech) program seeks to improve student achievement through the use of technology. The goals of this program are to improve achievement in elementary and secondary schools through the use of technology, to assist students to become
technically literate by the eighth grade, and to ensure that teachers integrate technology into the curriculum to improve student achievement. There are also provisions in the act to provide funding for schools to purchase technology resources to further the program’s goal.
Few studies have focused exclusively on kindergartners’ and first-graders’ access to and use of computers in different settings. Reports that exist on students’ computer access and use either focus on upper elementary and high school students (Becker 2000), or combine prekindergarten and kindergarten children into one category and elementary school children (grades 1–8) into a second category (Snyder and Hoffman 2002) when reporting information. The Early Childhood Longitudinal Study, Kindergarten Class of 1998–99 (ECLS-K) provides a unique opportunity to examine children’s access to and use of computers in their schools, classrooms, and homes as they are starting formal schooling. Sponsored by the U.S. Department of Education’s National Center for Education Statistics (NCES), the ECLS-K is a multisource, multimethod study that focuses on children’s early education, beginning with kindergarten. The ECLS-K includes measures of children’s health and socioemotional status, cognitive achievement, and their family, classroom, school, and community environments. This report describes the computer resources available to children as they begin formal schooling. The computer resources identified in this report include access in schools to computer labs, CD-ROMs, local area networks (LAN), and wide area networks
(WAN)/Internet; access in classrooms to computer areas and teachers trained in using computers and technology; and access in homes to computers and the Internet. The report also looks at the ways in which young children use computers at home and school. For example, information is provided on children’s frequency and types of home
3
computer use, and on the frequency with which children use computers in their classrooms for different instructional purposes. Children’s access to and use of
computers in their schools, classrooms, and homes are examined overall and in relation to certain child and family characteristics. In addition, children’s use of computers for various instructional purposes is compared by several characteristics of their teachers and classrooms. Details on the child, family, teacher, and classroom characteristics used in this report are included in the Measures section of the Introduction.
Research Questions
Data from the ECLS-K are used to examine 10 questions related to young children’s access to and use of computers.
Access to Computer Resources
1. What computer resources are available in the schools, classrooms, and homes of kindergartners?
2. Are these resources equally available to girls and boys, economically disadvantaged and advantaged students, and minority and nonminority children?
3. What school and classroom computer resources are available to children from homes with various computer resources?
4. Does the level of computer resources that are available in the schools, classrooms, and homes of young children change from kindergarten to first grade?
Use of Computer Resources
5. How frequently do kindergartners use computers in their classrooms and homes, and for what purposes?
6. Do certain groups of children use computers more often than others in each of these learning environments?
7. Does the frequency of children’s use of computers in their homes, classrooms, and schools change from kindergarten to first grade?
8. How frequently do young children use computers use computers over summer vacation?
4
9. What opportunities do children with and without home computer resources have to use computers in their classrooms?
10. Do children who use computers more often at home also use them more often in their classrooms?
Data Source
The ECLS-K selected a nationally representative sample of kindergartners in the Fall of 1998 and is following these children through the spring of fifth grade. The study collects information directly from the children and their families, teachers, and schools. The full ECLS-K base-year sample is comprised of approximately 22,000 public and private school children who attended over 1,200 kindergarten programs during the 1998–99 school year. Data for this report are from the ECLS-K kindergarten and first-grade waves of data collection.6 Tables 1 and 2 show the sample sizes and population counts for the children included in this report.
Tables 1, 2, 3, B-17, B-2, and B-3 present data for children attending public and private schools. The data in these tables show significant differences in the computer resources available in the two school sectors, as well as differences in the characteristics of
children who attend each type of school. For example, almost three-quarters (74
percent) of public schools with kindergartens had Internet access for students, compared with 41 percent of private schools with kindergartens (table B-1). Also, a higher
proportion of Black and Hispanic kindergartners attended public schools than private schools (table 1). As a result, it was decided to only report findings for public schools in the remainder of the report, so that any variations found in computer access and use related to child and classroom characteristics would not be confounded by school sector. Thus, the majority of this report is based on 14,666 Spring 1999 public school
kindergartners and 11,456 Spring 2000 public school first-grade children.8
6Data for kindergarten children are weighted by the round 2 parent cross-sectional weight, C2PW0; data for
summer computer use prior to first grade are weighted by the round 3 parent cross-sectional weight, C3PW0; and first-grade data are weighted by the round 4 cross-sectional parent weight, C4PW0.
7Tables beginning with a B are located in Appendix B.
8Children who repeated kindergarten while in the study were not included in the analysis of first-grade data.
Approximately 5 percent of kindergartners were not promoted to first grade by the second year of the ECLS-K data collection.
5
For the most part, the findings in the report use the child as the unit of analysis. This was done to provide information on the percentage of kindergartners who had opportunities to use different computer resources, as opposed to information on the percentage of schools or teachers that made such resources available for their students. In the first part of Section II of the report, summary information is provided on the percentage of schools and teachers that provide various computer resources to kindergartners (tables B-1 and B-2). These results were consistent with the child-level findings (table 3), so tables at the school and teacher level of analysis are not included elsewhere in the report.
The findings of this report are organized into the two sections identified by the research questions. Part one describes parents, teachers, and school administrators’ reports of young children’s access to computer resources in their schools, classrooms, and homes. Results are presented for the population of kindergarten and first-grade children, and in relation to child and family characteristics. Part two describes ways in which young children were reported to use computers in their classrooms and homes, and also examines the frequency of classroom computer use for different instructional purposes. Results in this section are presented for the population of kindergarten and first-grade children, and in relation to child, family, teacher, and classroom characteristics. All comparisons made in the text were tested for statistical significance to ensure that differences are larger than might be expected, due to sampling variation. All differences reported were significant at the .05 level.9
9Not all statistically significant differences are discussed in this report. Due to the large sample size, many
differences (no matter how substantively minor) are statistically significant. Thus, only differences of 5 percent or more between groups are reported, unless an activity is very infrequent (e.g., Internet use) or resource is rarely available (e.g., Internet access).
6
Table 1. Sample size, population size, and percent of kindergarten children by school control and by selected school, classroom, and child characteristics: Spring 1999
Percent Selected school, classroom, and
child characteristics Sample size Population size kindergartnersAll kindergartners Public school kindergartnersPrivate school
All kindergartners 19,000 3,864,000 100 100 100
School control
Public 14,700 3,289,000 85 100 0
Private 4,300 575,000 15 0 100
School low-income level1
Less than 50% low-income
students 7,100 1,535,000 54 54 †
50% or more low-income
students 5,500 1,286,000 46 46 †
Class size
Less than 18 children 3,800 700,000 21 18 40
18 to 24 9,100 1,945,000 60 63 38 25 or more 3,100 618,000 19 19 21 Child’s sex Male 9,700 1,996,000 52 52 49 Female 9,300 1,868,000 48 48 51 Child’s race/ethnicity White, non-Hispanic 10,900 2,220,000 58 55 72 Black, non-Hispanic 2,700 620,000 16 17 9 Hispanic 3,300 734,000 19 20 11 Asian/Pacific Islander 1,300 132,000 3 3 4 Other, non-Hispanic 800 152,000 4 4 4
Child’s disability status2
Not disabled 2,400 2,932,000 85 85 87
Disabled 14,500 519,000 15 15 13
† Not applicable.
1School low-income level is only available for public schools and is defined by the percent of free or reduced
lunch-eligible enrollment or by receipt of schoolwide Title I assistance (if free/reduced lunch-lunch-eligible data were missing).
2Children’s disability status is derived from parent information on whether the child has been diagnosed by a
professional as having problems with attention, activity level, coordination, speech, hearing, or vision or has participated in therapy or programs for children with disabilities.
NOTE: Detail may not sum to totals due to nonresponse and rounding.
SOURCE: U.S. Department of Education, National Center for Education Statistics, Early Childhood Longitudinal Study, Kindergarten Class of 1998–99 (ECLS-K), Spring 1999.
7
Table 2. Sample size, population size, and percent of first-grade children by school control and by selected school, classroom, and child characteristics: Spring 2000
Percent Selected school, classroom, and
child characteristics Sample size Population size All first-graders Public school first-graders Private school first-graders
All first-graders 14,600 3,513,000 100 100 100
School control
Public 11,500 2,997,000 87 100 0
Private 3,000 436,000 13 0 100
School low-income level1
Less than 50% low-income
students 5,700 1,345,000 55 55 †
50% or more low-income
students 4,000 1,085,000 45 45 †
Class size
Less than 18 children 2,700 556,000 19 17 27
18 to 24 8,100 1,962,000 66 70 43 25 or more 2,300 447,000 15 13 30 Child’s sex Male 7,400 1,794,000 51 51 49 Female 7,200 1,719,000 49 49 51 Child’s race/ethnicity White, non-Hispanic 8,600 2,000,000 57 55 72 Black, non-Hispanic 1,900 582,000 17 18 10 Hispanic 2,400 673,000 19 20 12 Asian/Pacific Islander 1,000 127,000 4 4 4 Other, non-Hispanic 600 129,000 4 4 2
Child’s disability status2
Not disabled 12,200 2,896,000 82 82 86
Disabled 2,300 607,000 17 18 14
† Not applicable.
1School low-income level is only available for public schools and is defined by the percent of free or reduced
lunch-eligible enrollment or by receipt of schoolwide Title I assistance (if free/reduced lunch-lunch-eligible data were missing).
2 Children’s disability status is derived from parent information on whether the child has been diagnosed by a
professional as having problems with attention, activity level, coordination, speech, hearing, or vision or has participated in therapy or programs for children with disabilities.
NOTE: Detail may not sum to totals due to nonresponse and rounding.
SOURCE: U.S. Department of Education, National Center for Education Statistics, Early Childhood Longitudinal Study, Kindergarten Class of 1998–99 (ECLS-K), Spring 2000.
8
Measures
Information in this report was collected through parent interviews and teacher and school administrator questionnaires. Below is a brief description of the measures and
characteristics used from these information sources. More detailed information on the measures can be found in the Methodology and Technical Notes section of this report or in the Early Childhood Longitudinal Study, Kindergarten Class of 1998–99: Base-Year Public-use Data Files User’s Manual (NCES 2001) and the Early Childhood Longitudinal Study, Kindergarten Class of 1998–99: First-grade Public-use Data Files User’s Manual (NCES 2002).
Computer resources. Data were collected from school administrators, teachers, and
parents on the types of computer resources available to children. School administrators completed paper and pencil questionnaires that asked questions about the presence of a school computer lab, local area network (LAN) access, CD-ROM drives, and wide area network (WAN, Internet) access, and whether such resources were available to
students. School administrators also provided counts on the total number of computers in the school and the number of classrooms with different computer resources.
Kindergarten and first-grade teachers also completed paper and pencil questionnaires, in which they identified whether computers were used in the grade they were teaching, whether there was a computer area in their classroom, and whether they had attended a computer/ technology workshop during the school year. Parents of kindergartners and first-graders responded to telephone interviews and provided information on whether there was a home computer that their child used and whether their child accessed the Internet from home.
Computer use. Teachers and parents of the sampled children reported on young
children’s computer use at school and home. Kindergarten and first-grade teachers indicated the frequency with which children used computers in their classes for several instructional purposes, including to learn reading, writing, or spelling; to learn math; to
9
learn social studies; to learn science concepts; to learn keyboard skills; to create art or compose music10; for fun (games); and for Internet/LAN access.
In spring of 1999 and again in spring of 2000, parents indicated the frequency with which their children used a home computer on a weekly basis, for children who used a
computer in the home. In spring of 1999, parents of kindergartners who used home computers also indicated whether their children used the computer to play with
educational programs, to play with art or drawing programs, and to access the Internet. In the fall of 1999, parents identified whether their children used computers at summer camp or summer school and also the frequency with which their children used home computers to play games or for educational purposes. In spring of 2000, parents of first-graders who used home computers were asked to provide information on the frequency with which their children used computers for educational purposes. Thus, there were some differences across data collection waves as to the information collected on children’s home computer use.
Child and family characteristics. Young children’s access to and use of computers in
their schools, classrooms, and homes were compared across five child and family characteristics.11 These included:
• Child’s sex (male, female).
• Child’s race/ethnicity (White, non-Hispanic; Black, non-Hispanic; Hispanic; Asian/Pacific Islander; Other, non-Hispanic).12
• Family socioeconomic status (SES) (lowest 20 percent, middle 60 percent, highest 20 percent). This composite in the ECLS-K database is derived from the following variables: mother/female guardian’s education level, father/male guardian’s
10The original set of items on computer use for instructional purposes included separate items on using the
computer to create art or to compose music. The response pattern for these two items was consistent, so a decision was made to combine the two categories into one variable for this report. Children’s value on the composite variable was equal to the value of the variable (art or music) with the higher reported frequency.
11Many of these variables are composite variables in the ECLS-K Electronic Codebook (ECB). Information
on the creation of these composites can be found in Chapter 7 of the Early Childhood Longitudinal Study, Kindergarten Class of 1998-99: Base Year Public-use Data Files User’s Manual (NCES 2001–029) and the Early Childhood Longitudinal Study, Kindergarten Class of 1998-99: Base Year Public-use Data Files User’s Manual (NCES 2002–134).
12White refers to White, non-Hispanic, Black refers to Black, non-Hispanic children, and Other refers to
10
education level, mother/female guardian’s occupation, father/male guardian’s occupation, and household income. For this report, the family SES quintile variable was collapsed into three groups representing children in the lowest 20 percent, the middle 60 percent, and the highest 20 percent of the range of SES values. More information on this composite is included in the Methodology and Technical Notes
section of this report.
• Poverty status (below poverty level, at or above poverty level). This composite variable is derived from household income and the total number of household members. Federal poverty thresholds are used to define households below the poverty level. For instance, in 1998 if a household contained 4 members, and the household income was lower than $16,655, then the household was considered to be in poverty. In most cases, findings for children’s access and use of computers by poverty status are consistent with the patterns of significant findings for the three SES groups. Therefore, findings by SES level are reported in both the text and tables, while poverty findings are only presented in the report tables.
• Child’s disability status (not disabled, disabled). This composite on the ECLS-K database is derived from parent information on whether the child has been diagnosed by a professional as having problems with attention, activity level, coordination, speech, hearing, or vision, or has participated in therapy or programs for children with disabilities.
Teacher/classroom characteristics. Teachers in the study were asked to complete a
set of self-administered questionnaires about their background, the characteristics of the students in their classrooms, the organization of their classroom, and their instructional practices. Children’s computer use for various instructional purposes is compared by several of these teacher and classroom characteristics. For instance, this report uses teacher-level data on the number of years of teaching experience in the target grade level (kindergarten or first grade) and the teacher’s area of certification (i.e., elementary education, early childhood certification, or neither area of certification). Also included is an indicator of whether teachers had attended a computer/technology workshop during the school year. Previous research indicates that teachers’ training in technology and their experience with computers may be related to children’s opportunities to use computers in their classrooms (Smerdon et al. 2000).
11
Teachers’ use of computers with their classes may also be related to their instructional practices, such as the way they set up their classroom and the way they group children for instruction. This report looks at children’s classroom use of computers in relation to whether the teacher had a computer area set up in the classroom. Also, the emphasis teachers placed on teacher-directed, whole-class instruction (whole-class instruction for half of the day or less, whole-class instruction for more than half of the day) is included as a variable for study when examining children’s use of computers in their classes. Children’s access to computers in their classes may be limited due to characteristics of their classroom and school. Teachers’ use of computers for different instructional purposes are examined in relation to the child’s class size (up to 17 children, 18 to 24 children, 25 or more children), the percent of minority children in the child’s class (0 to 24 percent, 25 to 49 percent, 50 to 74 percent, 75 percent or more), and the school low-income level (less than 50 percent low-low-income students, 50 percent or more low-low-income students).13
Limitations
This report provides a detailed description of young children’s access and use of computers at their schools and homes. However, there are limitations of the data that the ECLS-K collected on computer resources and computer use. For instance, the school and classroom indicators do not provide direct information on whether the sampled children have access to certain computer resources at school, although they indicate the overall level of school and classroom computer resources available to students in the schools they attend. Similar to the items on computer resources, the items asked of teachers about classroom computer use do not collect data specific to the sampled children’s computer use; however, they do provide indicators of the computer use in their classrooms. In addition, the ECLS-K collects data from multiple sources on computer access and use but the survey instruments do not capture specific
13Children were identified as attending a low-income school if the percent of free or reduced price
eligible students in the school was 50 percent or more. If data on the percent of free/reduced price lunch-eligible students were missing, data on the school’s receipt of schoolwide Title I assistance were used to determine school income level. Schools receiving schoolwide Title I assistance were designated as low-income schools. This measure is applicable for public schools only.
12
information on the quality of young children’s computer use or the specific software children are using at school and in their homes.
The ECLS-K data on computer resources and use were provided by children’s school administrators, teachers, and parents. As a result, there may be possible response bias due to social desirability. For example, some respondents may indicate that young children use computers more often than they actually do if the respondents believe that frequent computer use is a desirable behavior. Since independent observation of computer resources and use was not part of the study design, it is not possible to examine whether response bias might have an effect on reported estimates.
For some of the research questions in this report, young children’s access to and use of computer resources in different settings are compared from kindergarten in the spring of 1999 to the first grade in the spring of 2000. Differences that are detected between the two grade levels may be due to children’s change in grade level. For instance, in 1997, 37 percent of prekindergarten and kindergarten children used computers in school, compared with 79 percent of first through eighth grade children (Snyder and Hoffman 2002). Differences detected across grade levels may also be attributed to the growth of computer resources from 1999 to 2000. For example, the percent of public elementary schools with Internet access increased significantly from 94 percent in 1999 to 97 percent in 2000 (Kleiner and Farris 2002).
13
II. Access to Computer Resources
Previous research found that by 1999, nearly all public schools in the United States had at least one computer (Smerdon et al. 2000). Internet access increased rapidly in public schools from 1994–99. For instance, in 1999, 94 percent of public elementary schools had Internet access, compared with only 30 percent in 1994 (Snyder and Hoffman 2002).14 In 2000, 98 percent of all public schools were connected to the Internet, as were 76 percent of elementary school classrooms (Cattagni and Farris 2001).
Differences have been found between the percent of children who have a computer in their home and the percent who actually use home computers. According to the U.S. Census Bureau’s 1997 Current Population Survey, 45 percent of prekindergarten and kindergarten children lived in a home with at least one computer, while 30 percent used a computer at home. In the same year, 51 percent of first to eighth grade children had home computer access, and 43 percent used home computers. Of prekindergarten and kindergarten children, 57 percent of White children had a computer in their home, while 38 percent used home computers. Eighteen percent of Black children and 21 percent of Hispanic children had computers in their homes, while 10 percent of Black children and 11 percent of Hispanic children used home computers (Snyder and Hoffman 2002).
What computer resources are available in the schools, classrooms, and homes of kindergartners?
In general, kindergartners in the spring of 1999 had access to a variety of computer resources in their schools, classrooms, and homes (table 3). Consistent with other findings (Becker 2000), all public school kindergartners and 96 percent of private school kindergartners attended schools that had at least one computer. Almost all
kindergartners (97 percent) had access to a computer either in their home or in their kindergarten program. Ninety-four percent of children used computers in kindergarten, and over three-quarters had computer areas in their classrooms and attended schools with student access to computer labs and CD-ROM drives. More than half attended
14Information on children’s access to the Internet in 2001 has recently been published (Kleiner and Farris
2002). However, 1999 and 2000 estimates from other studies are presented in this report because they reflect the same timeframe as the ECLS-K estimates.
14
schools that provided student access to local area networks (LANs) and the Internet, had kindergarten teachers who attended a computer/ technology workshop in the past year, and had home computers that they used.
Table 3. Percent of kindergartners who had access to various computer resources in their schools, classrooms, and homes, by school control: Spring 1999
Computer resources All kindergartners kindergartners Public school kindergartners Private school
Access to computers at school or home 97 98 96
School has at least one computer 99 100 96
School computer resources for student use
Computer lab in school 79 80 75
Local area networks (LAN) 63 67 39
CD-ROM drives 90 92 80
Wide area networks (WAN, Internet) 71 75 51
Teacher/classroom resources
Computers used in kindergarten 94 96 83
Computer area in classroom 84 86 72
Teacher attended computer/technology workshop
in past year 59 62 42
Home computer resources
Child has access to and uses a home computer 53 49 73
Child has access to and uses the Internet at home 6 6 8
SOURCE: U.S. Department of Education, National Center for Education Statistics, Early Childhood Longitudinal Study, Kindergarten Class of 1998–99 (ECLS-K), Spring 1999.
Kindergartners’ access to school, classroom, and home computer resources tended to vary by the type of school they attended. Although the apparent difference between the percentage of public and private school kindergartners with computer labs in their schools was not statistically significant, kindergartners in public schools had greater access to resources such as LANs, CD-ROM drives, and the Internet than private school kindergartners. In addition, public school kindergartners had greater access to
computers in their classrooms, and a higher percentage of their teachers had attended computer/ technology workshops during the school year than private school
15
kindergartners. However, only about half of public school kindergartners had access to computers in their home, compared with almost three-quarters of private school
kindergartners.
When the data were analyzed at the school and teacher level, the findings were consistent with child-level data (tables B-1 and B-2). At the school level, a smaller proportion of private schools with kindergartens had computer labs or student access to LANs, CD-ROM drives, and the Internet than did public schools with kindergartens (table B-1). Also, private school kindergarten teachers were less likely to use computers with their classes, to have a computer area in the classroom, and were less likely to have attended a computer or technology workshop in the past year than were public school kindergarten teachers (table B-2).
In sum, significant differences were found between public and private school kindergartners’ access to computer resources at home and school. As a result, the remainder of this report focuses on public school children’s access to and use of computers so that differences found by child, family, and school characteristics are not confounded by school control differences. Approximately 85 percent of kindergartners attended public schools in the 1998–99 academic year (table 1).
Public school kindergartners’ access to computer resources at school was also
examined in terms of the school’s child/computer ratio — that is, the number of children enrolled in the school divided by the total number of computers in the school — and the percent of classrooms in the school that had various computer resources available for student use (table B-4). On average, the public schools that kindergartners attended had one computer for every nine children in the school. Approximately half of the classrooms in children’s schools had LAN and Internet access, while 71 percent had computers with CD-ROM hardware.
Are these resources equally available to girls and boys, disadvantaged and advantaged students, and minority and nonminority children?
In this section, children’s access to computer resources in their homes and schools was examined in relation to the children’s sex, race/ethnicity, disability status, family SES,
16
and poverty status. Children’s SES level is strongly related to their racial/ethnic background (table B-5). For example, 11 percent of White kindergartners fall into the lowest SES level, compared with 20 percent of Asian/Pacific Islander, 36 percent of Black, and 45 percent of Hispanic kindergartners. In addition, the majority (71 percent) of children in the lowest SES level are also living below the poverty level (not shown in tables). Since the findings on computer access and use were consistent for the most part across the SES and poverty level variables, only SES-level differences are reported in the text.
School computer resources. In an effort to identify whether school computer
resources were equally distributed for all kindergartners, the percent of public school kindergartners with access to various resources was examined in relation to child and family characteristics (table B-6). In the spring of 1999, no difference was detected in student access to school computer labs, LANs, and CD-ROM equipment for all public school kindergartners with respect to children’s sex, race/ethnicity, SES, and disability status. However, student access to the Internet and wide area networks (WAN) in schools varied by children’s race/ethnicity and SES. A higher percentage of White children attended schools that provided student access to the Internet than did Black and Hispanic children (79 percent vs. 64 and 66 percent, respectively) (figure 1, table B-6). 15 Also, children from the highest SES group were more likely to attend schools that provide student access to the Internet than those in the lowest SES group (80 percent vs. 69 percent).
When kindergartners’ access to computer resources in public schools was examined in terms of their schools’ child/computer ratio, no significant differences were detected across child and family characteristics (table B-4). However, Hispanic kindergartners’ schools had a lower percent of classrooms with Internet access when compared to White, Asian/Pacific Islander, and other, non-Hispanic kindergartners’ schools (41 percent vs. 55, 58, and 60 percent, respectively). Kindergartners from the lowest SES group also had a lower percentage of classrooms in their schools with Internet access compared to children from the highest SES group. In addition, the average percentage
15Logistic regression was used to examine whether children’s race/ethnicity was related to the likelihood
that their school offered Internet access to students after controlling for children’s family SES. The regression results indicated that Black children were still less likely to be in schools that provide Internet access for students than White children, after controlling for family SES (not in tables).
17
of classrooms in children’s schools with LAN access was lower for Hispanic kindergartners than for Asian/Pacific Islander children (46 percent vs. 62 percent).
Figure 1. Percent of public school kindergartners attending schools with Internet access for students, by child’s race/ethnicity: Spring 1999
SOURCE: U.S. Department of Education, National Center for Education Statistics, Early Childhood Longitudinal Study, Kindergarten Class of 1998–99 (ECLS-K), Spring 1999.
Teacher/classroom computer resources. The percent of public school kindergartners
with access to various classroom computer resources was examined in relation to child and family characteristics (table B-7). Almost all public school kindergartners (96
percent) used computers during the school year. Kindergartners’ access to teachers who participated in computer/technology workshops during the school year did not show variation by children’s sex, race/ethnicity, SES, or disability status. However, a lower percentage of kindergartners in the lowest SES group had computer areas in their classrooms than kindergartners from the highest SES group (83 percent vs. 90 percent).
75 79 64 66 78 77 0 20 40 60 80 100
Total White, non-Hispanic Black, non-Hispanic Hispanic Asian/Pacific Islander Other, non-Hispanic Race/ethnicity Percent