White Rose Research Online URL for this paper:
http://eprints.whiterose.ac.uk/97518/
Version: Accepted Version
Proceedings Paper:
Zaidi, SAR, Ghogho, M orcid.org/0000-0002-0055-7867 and McLernon, DC (2015)
Information Centric Modeling for Two-tier Cache Enabled Cellular Networks. In: 2015 IEEE
International Conference on Communication Workshop, ICCW 2015. 2015 IEEE
International Conference on Communication Workshop, ICCW 2015, 08 Jul - 12 Jun 2015,
London, UK. IEEE , pp. 80-86. ISBN 9781467363051
https://doi.org/10.1109/ICCW.2015.7247159
(c) 2015 IEEE. Personal use of this material is permitted. Permission from IEEE must be
obtained for all other users, including reprinting/ republishing this material for advertising or
promotional purposes, creating new collective works for resale or redistribution to servers
or lists, or reuse of any copyrighted components of this work in other works.
[email protected] https://eprints.whiterose.ac.uk/
Reuse
Unless indicated otherwise, fulltext items are protected by copyright with all rights reserved. The copyright exception in section 29 of the Copyright, Designs and Patents Act 1988 allows the making of a single copy solely for the purpose of non-commercial research or private study within the limits of fair dealing. The publisher or other rights-holder may allow further reproduction and re-use of this version - refer to the White Rose Research Online record for this item. Where records identify the publisher as the copyright holder, users can verify any specific terms of use on the publisher’s website.
Takedown
If you consider content in White Rose Research Online to be in breach of UK law, please notify us by
Information Centric Modeling for Two-tier Cache
Enabled Cellular Networks
Syed Ali Raza Zaidi,
Member, IEEE,
Mounir Ghogho,
Senior Member,IEEE,
Desmond C. McLernon,
Member, IEEE
Abstract—In this article, we introduce a new metric called ‘infor-mation centric coverage probability’ to characterize the performance of a two-tier cache enabled cellular network. The proposed metric unifies the dynamics of in-network caching and heterogeneous networking to provide a unified performance measure. Specifically, it quantifies the probability that a mobile user (MU) is covered at a desired rate when a certain content is requested from a global content library. In other words, it quantifies the percentage of time when an MU can be served locally without paying the traffic penalties at backhaul, fronthaul and core networks. Caching dynamics are modeled by considering that the content which is least recently used (LRU) is evicted while the requested content is stored in the cache. The considered two-tier cellular model leverages coordination between the macro base-station (MBS) and the small cell base-stations (SBSs) to maximize the resource efficiency. More specifically, coordination between macro and small cells enables an arbitrary SBS to exploit the caches at other SBSs in the neigh-borhood. Thus reducing the requirement for huge and expensive memory modules at individual SBSs. The spatial dynamics of cellular network are modeled by borrowing well established tools from stochastic geometry. Propagation uncertainties are explicitly factored in characterization by considering the small scale Rayleigh fading and the large scale power-law path-loss model. It is shown that the information centric coverage probability is a function of (i) the size of caches at the SBSs and the MBS; (ii) the content eviction strategy; (iii) the underlying popularity law for referenced objects; (iv) the size of the global content library; (v) desired downlink transmission rate; (vi) the amount of spectrum allocated to each tier; (vii) path-loss exponent; and (viii) the deployment density of the SBSs and the MBSs. Our analysis reveals that significant performance gains can be harnessed with appropriate dimensioning of both cache sizes and deployment density. Finally, identification of memory limited vs. QoS limited operational regime for two-tier cellular networks is considered.
Index Terms—Cache, small cells, LRU, two-tier, Poisson process, coverage.
I. INTRODUCTION A. Motivation
I
N recent times, the demand for ubiquitous wireless connectivity has intensified. The exponential growth in capacity requirements can be attributed to the increasing popularity of multimedia in-fotainment applications and the enormous penetration of smart platforms facilitating their execution. According to recent statistics [1], by the end of year 2019 mobile broadband subscriptions are expected to reach 7.6 billion, accounting for 80% of all mobile subscriptions, compared to around just30%in2013. The demand for mobile data traffic is expected to grow at a compound annual growth rate (CAGR) of 45% between 2013-2019. Consequently, it is predicted that while the voice traffic will maintain its current trend, the data traffic will grow 10fold by the end of2019.These formidable capacity demands have lead to so called ‘1000× mobile data challenge’ introduced by Qualcomm. More S. A. R. Zaidi, M. Ghogho and Des. C. McLernon are with the School of Electronic and Electrical Engineering, University of Leeds, Leeds LS2 9JT, United Kingdom, e-mail: {s.a.zaidi,m.ghogho,d.c.mclernon}@leeds.ac.uk. M. Ghogho is also affiliated with International University of Rabat, Morocco.
specifically, the 1000× challenges dictates that fifth generation (5G) wireless networks (which are expected to roll out by early 2020) should be designed to be 1000 times more efficient than existing networks. In order to enable such a high level of efficiency, the architecture has to leverage three vital building blocks: (i) network densification; (ii) spectral agility; and (iii) higher energy efficiency. While network densification has received significant attention in the recent past, the prime objective has been to explore the design space from the quality-of-service (QoS) perspective (see [2] and references therein). An alternative yet powerful design per-spective is to employ the content centric approach towards network densification. In other words, treating networks as intelligent re-configurable platforms where proactive decision making can be employed to opportunistically enhance the quality-of-experience (QoE) with better spectral utilization and a smaller CO2footprint. It
has been predicted by Cisco that the aggregate traffic generated by all forms of video traffic, i.e., TV, video on demand (VoD), Internet, and P2P will be in the range of 80−90% of global consumer traffic by 2018. From the content/information centric perspective, intelligently designed networks can reduce this demand from such a high share of traffic by opportunistically utilizing network resources in conjunction with proactive in-network content caching.
The idea of caching in the IP networks has evolved from the underlying principles earlier exploited to empower computers with higher performance. In this context the main memory access was a key bottleneck and introduction of an intermediate on board faster memory (such as L1/L2 cache) yielded a several fold gain in computing performance. Consequently, cache memory has been central ingredient of computer architecture for several decades. The design principles of caching have evolved to a whole new level with the emerging ‘information centric networking’ paradigm. In particular, the information centric design of a network departs from the traditional end-to-end host centric architecture. The information centric design is inspired by the fact that the named informa-tion/content is the key consumable commodity from the end-user’s perspective. Making data independent from the geographical location, application, storage and means of transportation through in-network caching and cognitive replication is envisaged to bring several fold gains in terms of spectral efficiency and scalability of networks. The information centric networking paradigm has also enabled content providers (such as Akamai, Level3 Communica-tions and Limelight) to enhance QoE by reducing access delays through moving desired content closer to the user, i.e., towards the edge of the network.
B. Related Work
Investigation of cache empowered wireless networks is much more recent than the traditional computer networking paradigm. There are two key obstacles as regards exploring the design space:
• Performance of the caching algorithms on its own has been quite intricate and solution generally rely on sophisticated time consuming simulations. Thus characterizing the performance of the cache enabled cellular networks considering spatio-temporal dynamics of the cellular network is a non-trivial task
when compared to the traditional computer network with static topology, user association, etc.
• Modeling the link level performance of the cellular network itself has been quite a challenge until very recently. In the recent past [3], it has been recognized that borrowing well established mathematical tools from stochastic geometry can circumvent certain modeling issues. In particular, modeling the locations of the BSs as a Poisson point process significantly enhances the tractability while providing a lower bound on the actual performance experienced in a practical large scale deployment [3].
In the light of recent advances, the authors in [4] studied the performance of the cache-enabled small cell networks. Optimal cooperation between caching empowered device-to-device (D2D) communication nodes is investigated in [5], [6]. The authors in [5], [6], assume idealistic propagation conditions, i.e, the impact of multipath fading is completely ignored and an ideal protocol interference model is adapted. A detailed survey of the literature on cache-enabled D2D communication is beyond the scope of this current article. However, interested readers may refer to [6]–[9] and references therein. In [10], authors treated small cell base-stations (SBS) as helpers and formulated the problem of which files to cache when each user has access to multiple helpers. Since the focus in [10] is to derive an optimal caching strategy, authors do not consider the dynamics of the connectivity and the network topology. Moreover, most of the existing studies also ignore the fact that the cellular macro base-station (MBS) can also control the dynamics of information storage/retrieval in cache enabled networks.
The closest study to our work is [4], where the authors investi-gated the design space of the cache enabled small cell networks by adapting the tractable approach for characterizing coverage probability from [3]. To the best of our knowledge, it is the only study which considers both the spatial and the propagation dynamics of the cache enabled cellular network. Nevertheless, in [4] only a single tier network is considered, i.e., the existence and participation of the MBSs in both service and storage processes is completely ignored. Furthermore, the dynamics of the cache content replacement algorithm are not incorporated into the analysis. So, in this article, we consider a two-tier cache enabled small cellular network and explore its dimensioning under a well known least recently used (LRU) content eviction policy (see Section II for details).
C. Contributions & Organization
The contribution of this article is two fold:
1) We first introduce a new metric for a two-tier cache-enabled cellular network which unifies several networking aspects into a single quantitative measure. The introduced metric is termed as an ’information centric coverage probability’ (refer to Section IV) which quantifies the probability that in a two-tier network a certain requested content can be retrieved locally and can be successfully transmitted to the desired MU. In contrast to [4], we consider that both the MBS and the SBS can perform caching while operating under the LRU based content eviction policy (see Section II & III). Thus, at each request for a certain content if it is either not located at the serving SBS, the MBS can arbitrate by retrieving the content from other SBSs or from its own cache. MBS can also serve the MU if the desired QoS cannot be met by its serving SBS. Such dynamic arbitration capitalizes on the fact that memory in proximity of a serving SBS is also an exploitable resource. Optimal exploitation of such a resource may bring significant gains by reducing both (i) backhaul/core network utilization; and (ii) memory requirements at individual SBSs.
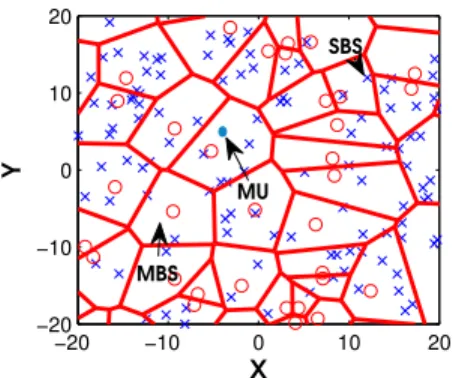
−20 −10 0 10 20 −20 −10 0 10 20 X Y SBS MU MBS
Figure 1. A realization of the proposed two-tier cellular network.
2) We characterize the information centric coverage probability by employing point process framework from stochastic geom-etry and also by using some recent results on the performance evaluation of the LRU cache hit rates. In particular, we revisit a well known “Che approximation” [11] for LRU cache hit probability, when the content is independently referenced and follows the Zipf like popularity law (details are deferred until Section III). We demonstrate how an alternative ap-proximation based on the central limit theorem (CLT), and developed in [12], can be employed to quantify the cache hit probability. We then develop an analytical framework which combines the hit probability approximation with the spatial and channel dynamics of the cellular network under the pro-posed association model (see Section II) to characterize the information centric coverage probability. Finally, the impact of various parametric variations on the coverage probability are investigated in Section V. It is shown that employing the proposed metric provides interesting insights for the design of a large scale two-tier cellular network.
To the best of our knowledge, the system architecture considered in this article and the proposed metric have not been studied in any of the existing literature.
D. Notations
Throughout the paper, a particular realization of a random variableZ is denoted by a corresponding lower-case letterzand its probability density function (PDF) by fZ(.). The boldface
lower-case letter (e.g.x) is employed to denote a vector inR2. For sake
of compactness, we employxto refer to both the vector itself and
also its location. The symbol\denotes the set subtraction andkxk
denotes the Euclidean norm of the vector x. The symbolb(x, r)
denotes a ball of radiusrcentered at pointx. The symbol∈denotes
set membership and Π is generally employed to denote the point process. The point process is also used as a counting measure by using the notationΠ(A)which returns the number of points inΠ which lie inside A ∈R2. Finally, Z ∼ E(µ)is used to represent
an exponential random variable with meanµ. II. SYSTEMMODEL A. Spatial Model
We consider a two-tier HetNet such that the first tier is formed by the macro cellular BSs. The subsequent tier is formed bySBSssuch as femto cells. The spatial configuration of the BSs in both tiers is modeled by employing two independent homogeneous Poisson point processes (HPPPs), Πm and Πs, with intensity λm and λs
respectively (see Fig. 1). Specifically, the probability of findingn∈ NBSs inside a typical area foot-printA ⊆R2follows the Poisson law with mean measureΛi(A) =λiv2(A),i∈ {s, m}. The mean
unit area (i.e.,λi) and the Lebesgue measure [13]v2(A) =RAdx
on R2, where if Ais a disc of radius rthen v2(A) =πr2 is the
area of the disc. Givenn∈N, the BSs are uniformly distributed in A ⊆R2. Notice that by virtue of superposition theorem for HPPPs (see [13]) the combined spatial distribution of BSs also forms a HPPP, i.e.,Π = Πm∪Πs.
B. Channel Model
The channel between an MU (o), located at origin and a BS x∈Πi i∈ {s, m}is modeled by the composite random variable
Ho,xl(kxk). Here Ho,x ∼ E(1) is a unit mean exponential random variable which captures the impact of the Rayleigh fading channel between a BS and a MU. The small-scale Rayleigh fading is complemented by a large-scale path-loss modeled by l(kxk) = Gkxk−α. Here kxk is distance between the BS
(x) and the MU (o); G is a frequency dependent constant and
α ≥ 2 is an environment/terrain dependent path-loss exponent. The fading channel gains are assumed to be mutually independent and identically distributed (i.i.d.).
C. Content Access & Cellular Association Model
By virtue of the stationarity of the HPPP Π, it follows that the downlink performance of a typical MU can be treated as a proxy for the attainable performance of any MU (see [14]). Without any loss of generality, we consider a typical reference MU (denoted by
o) located at the origin. The MU requests a certain contentnfrom
a global library Sof sizeN. It is assumed that each BS (x∈Π)
maintains a cache of size Cx [objects]
1 where objects are stored upon their request. Whenever object n /∈ Cx, it is then retrieved and stored in the cache while the least recently accessed object is discarded. This eviction strategy is frequently known as an LRU strategy.
In this paper, we consider that upon the MU is associated with the nearest SBS and the nearest MBS. In subsequent discussion, the nearest SBS and MBS will be frequently referred to as the serving SBS and the serving MBS respectively. The serving cell of MBS
z∈Πm is defined as: Cz=
x∈R2kz−xk ≤ ky−xk ∀y∈Πms.t.y6=z },
(1) i.e., Cz is the Voronoi cell of z. The serving region of the SBS is defined in a similar manner. The key features of the downlink service for an MU are as follows:
• The MU request for thenthitem and the nearest SBS (
x∈Πs
) first searches its cache to locate the requested content. It is assumed that depending on the type of content, it is required to be transmitted to the MU at a certain desired rateT [bps/Hz]. If the content cannot be found at the serving SBS it redirects its request to the serving MBS. The serving MBS tries to locate the requested content locally at its own cache or at the caches furnished to the SBSs which are inside its serving region. For an LTE-A cellular network, the intra-tier coordination is attained over the X2 interface.
• If the requested content is located, it is served by either the SBS or the serving MBS depending on which one out of the two can satisfy the desired rate requirement.
• In the event that content cannot be locally located, a request is forwarded to serving gateway (S-GW) which retrieves the content from the source through the core network. Notice
1In this paper, we assume that each object has same size and the cache size
is defined in terms of number of objects it can hold. Nevertheless, the analysis can be easily extended to the case where cache size is defined in bytes and each object has a different size (see [15] for details of LRU caches with variable sized objects).
that such retrieval incurs a two-level cost which is essentially due to the backhaul transmission. The cost can be modeled in terms of the shared capacity, the energy penalty or the backhaul outage. Modeling such a cost, essentially empowers designers to explore the design space of HetNets in terms cache-ability of content. Due to space restrictions, we refrain from presenting the characterization of such costs.
D. Spectrum Allocation
In this paper, we assume that the small cells are deployed with the macro cellular network in an overlay mode. The choice is inspired by the recent proposals for the LTE Release 12 (expected in March 2015) where C/U plane split has been advocated by several industrial leaders. We assume that the MU is mainly associated on C-Plane (control plane) with the serving MBS while the U-plane (user U-plane) services are rendered by the small cells. The spectrum allocation across the macro and small cell tier is non-overlapping. In other words, small cells are deployed in non co-channel mode and the available spectral resources are split between both tiers. Consequently, if a unit bandwidth is available to operator, its fractionβ is assigned to macro tier, while(1−β)is allocated to small cell tier2.
III. CACHEHITPROBABILITY UNDERLRU CONTENT EVICTIONPOLICY
In [11] Che et al. developed the fundamental design principles for the hierarchical web caching systems. The key contribution of [11] was to develop an approximation for estimating the cache hit probability under LRU content eviction policy. The “Che approx-imation” proved to be extremely accurate, even in the scenario’s where an intuitive explanation for its applicability was quite vague. In a recent article [12], Fricker et al. revisited the Che approx-imation to unveil its remarkable success through an alternative mathematical explanation for a wide spectrum of scenario, beyond the specific conditions anticipated in [11]. In this article, we expand Fricker’s alternative framework for the Che approximation for two-tier cellular networks. To this end, the key objectives of this section are:
1) To explicitly detail the traffic model, the content popularity laws and other assumptions which are central for quantifying the LRU cache hit probability by employing the Che approx-imation.
2) To recap the Che approximation and develop the Gaussian approximation for hit probability as in [12].
The developed approximations for the hit probabilities are later employed to quantify the proposed information centric coverage probability for an arbitrary MU in two tier cellular network with the limited shared backhaul.
A. The Independent Reference Model (IRM)
The independent reference model (IRM) has been frequently employed in literature (see [11], [12], [15] and references therein), to model how a particular object is referenced in an arbitrary traffic stream. Under the IRM model, requests for the objects/content occur in an infinite stream. The content/file demanded on the ith request, for i > 0, is an independent random variable on S⊂Z+with a common probability distribution. It is assumed that
users request items from a global content library of size N, i.e.,
|S| = N. The probability that the content n ∈ S is accessed is
governed by the underlying content popularity distribution p(n), wherep(n)is frequently referred to as the “popularity law” which is dependent upon the type of content, i.e., video, audio, etc.
2With the nearest neighbor association, it is straight-forward to show that equal
allocation (i.e.,β = 0.5) maximizes the performance metric considered in this paper.
VoD .65 ≤η ≤ 1.2
Websites .64 ≤η ≤ .83
P2P Files .75 ≤η ≤ .82
Table I
SUMMARY OFCONTENTPOPULARITY.
B. Content Popularity Law- A Case for Zipf Distribution
As discussed in the previous sub-section, the content popularity law governs how often a particular object is referenced in an infinite stream of the access requests. Empirical studies [15]–[17] have shown that the Zipf distribution renders itself as a most promising fit for describing the popularity of the content across various references. Under the Zipf popularity distribution p(i) < p(j) for i > j. Moreover, the probability that the nth content will be
referenced is given by p(n) =1/n η κ1 , where κ1= N X n=1 n−η. (2)
hereκ1is normalizing constant, whileη >0defines the exponent
which characterizes the distribution. The value of η is strongly coupled with the type of content. Table 1, summarizes a few reference values for the various content types.
C. Che & Gaussian Approximations for Cache Hit Probability Proposition 1 (Che Approximation). For a cache, say x of size
Cx, the probability that the object can be retrieved from a cache
without accessing the content provider library for the requestednth
object is given as
q{xH}(n) = 1−exp (−p(n)tCx), (3)
wheretCx is the characteristic time for the cache and is given by
the unique root of
Cx=
N
X
n=1
qx{H}(n). (4)
Proof:Please refer to [11].
A detailed discussion on computation of characteristic time is beyond the scope of this article. The interested reader is directed to [11] for a comprehensive analysis. As can be seen from Proposition 1, analysis of the cache hit probability requires the solution of the non-linear equation (Eq. (4)). This can be quite involved for large cache and library sizes. This limitation can be circumvented by employing the Gaussian approximation for the hit probability developed by the Fricker et al. in [12].
Proposition 2(Gaussian Approximation). The probability that the
nth requested item can be found in the cache of size C
x can be
approximated by employing the central limit theorem as follows q{xH}(n) = 1− 1 2 Z ∞ 0 erfc Cx−µ(t) p 2σ2(t) ! p(n) exp (−p(n)t)dt. (5) where µ(t) = N X n=1 (1−exp (−p(n)t)). (6) σ2(t) = N X n=1 exp (−p(n)t) (1−exp (−p(n)t)). (7)
Proof:For a detailed proof, readers may refer to [12].
Intuitively, the effectiveness of the Gaussian approximation can be understood by observing that the cache hit probability is given by
q{xH}(n) = Pr{TCx(n)> τn} (8) whereτnis the time since the last occurrence of the request for the
objectn. Notice that this time is exponentially distributed, i.e., the request arrivals are assumed to follow a Poisson point process with the rate proportional to the popularity of the content. Moreover, TCx(n) = inf
n
t >0 :PNi=1,i=6 n1{τ<} =Cx o
, i.e. the time at which cache is completely filled with the number of different objects excluding the requested object n. As TCx(n) is coupled with the sum of the exponential random variables, for a largeN then the central limit theorem can be invoked and thus the Gaussian approximation for Eq. (8) can be easily established.
Note that the evaluation of hit probability by employing the Gaussian approximation requires the solution of the integral given Eq. (5). This integral cannot be evaluated in closed-form in general. However, a numerical solution can easily be obtained via standard analysis software such as MATLAB. The computation complexity is significantly reduced when compared to the original Che approx-imation.
IV. INFORMATIONCENTRICLOCALCOVERAGEPROBABILITY FORTWO-TIERCELLULARNETWORKS
The information centric coverage probability for an arbitrary MU (o) is defined as the probability of finding the requested content
locally from the caches inside the Voronoi cell of its serving MBS. Let z ∈ Πm be the serving MBS of a typical MU o with its
corresponding cell denoted by Cz. Moreover, let n ∈ S be the requested content in the current request generated by an MU, then the information centric downlink coverage probability is given by
Pcov(n) =P{covS}(n) +1−Pcov{S}(n)P{covM}(n), (9) where
P{covM}(n) = Pr{βlog2(1 + ΓM)≥ T, n∈Cs}, (10)
P{covS}(n) = Pr{(1−β) log2(1 + ΓS)≥ T, n∈Cs}, (11) here ΓS and ΓM are the received signal-to-interference ratios
(SIRs) at an MU and the aggregate network memory in terms of caching is given by
Cs =
Caches at all SBSs inside Macro-cell zX}| { y\x∈Πs Cy + Cache at Nearest SBS z}|{ Cx (12) + Cz |{z} Cache at Nearest MBS .
Intuitively, an MU can be successfully served iff:
1) The nearest SBS which is serving the MU has a copy of the requested content in its cache and can serve MU at its desired rate;
2) Either the other SBSs or the MBS has a copy of the requested content in its cache and can transfer it to the serving SBS, which in turn can transmit content to the MU at its desired rate;
3) The content can be locally found at the SBSs managed by the serving MBS but the serving SBS cannot satisfy the desired rate requirement and thus the MU has to be served by the MBS directly.
The first two factors contribute towards the first term in Eq. (9), while the third case is captured by the second term. The information centric coverage probability unifies both the desired QoS and the cache dynamics into a single analytically tractable metric.
V. PERFORMANCEANALYSIS OFTWO-TIERCACHEENABLED CELLULARNETWORKS
In the previous section, we briefly outlined the analytical frame-work which can be employed to study the performance of an LRU cache. In this section, we build on the already developed framework to unify the hit probabilities with the link level QoS to characterize the information centric coverage probability for two tier cellular networks.
Proposition 3 (Small Cell Coverage P{covS}(n)). The probability that an MU can be served by its serving SBS in the downlink
for a certain locally accessible content n ∈ S request can be
characterized as P{S} cov(n) = Ξ(n) 1 + δγδ thsB(δ,1−δ)−2F1(1, δ; 1 +δ;−1/γths) , (13) whereγths= 2 T/(1−β) −1 and Ξ(n) = 1− m m1−q{H} z (n) λS/λMq{ H} y (n) +m m with m= 3.5. (14)
Proof:From Eq. (11), it follows that
P{covS}(n) = Pr{(1−β) log2(1 + ΓS)≥ T, n∈Cs}, = Pr log2(1 + ΓS) | {z } κ2 ≥T/(1−β) | {z } T2 n∈Cs Pr{n∈Cs}, = (a) Pr{ κ2≥T2} | {z } A1 Pr{n∈Cs} | {z } Ξ(n) , (15)
where (a)follows from the mutual independence of the QoS and the cache hit probabilities. Notice that the term A1 corresponds
to the event that the MU can be served at its desired rate by the nearest SBS and can be evaluated as
A1 = Pr{κ2≥ T2}= Pr ΓS ≥2T2−1 | {z } γths , (16) = Pr hox≥ γthsIr l(r) =ERLI r(s)|s=γthsrα . The random variable Ir = Px∈Πs\b(o,r)hxl(kxk) models the other-cell interference experienced at a typical MUo. Now,
follow-ing the steps similar to [3] with several mathematical manipulations, the Laplace transform of the aggregate interference experienced by the MU can be quantified as
LIr(γthr α) = exp −λsπδγthsδ r2(B(δ,1−δ) − δγδths −1 2F1(1, δ; 1 +δ;−1/γths) (17) where δ = 2
α , B(a, b) = Γ(a)Γ(b)/Γ(a+b) is the standard Beta
function and 2F1(a, b;c;z) =P∞n=0a
(n)b(n) c(n)
zn
n! is the Gauss
Hy-pergeometric function3. Finally employing the distance distribution for nearest SBS, Eq. (16) can be evaluated as
A1 = Z ∞ 0 2πλsrexp −λsπr2ζdr, (18) = 1 1 + δγδ thsB(δ,1−δ)−2F1(1, δ; 1 +δ;−1/γths) .
3Herea(n)=a×(a+ 1)×....(a+n−1)is the rising Pochhammer Symbol.
Now, Ξ(n) = Pr{n∈Cs} can be evaluated as follows
Ξ(n) = 1−Pr{n /∈Cs}, (19) = (b) 1−Pr| {n /{z∈Cz}} A2 Y y∈CZ∩Πs Pr{n /∈Cy} | {z } A3 ,
where (b)can be deducted from Eq. (12). Moreover, the termA2
can be computed as
A2= 1−q{zH}(n). (20) The termA3can be written as
A3 = (c) EA " ∞ X k=0 1−q{yH}(n) k (λsa)k k! × exp (−λsa)], = (d) EAhexp−λsq{H} y (n)a i , (21)
where (c) follows from the Poisson law for Πs and (d) can
be obtained by using the fact that exp(x) = P∞k=0xk /k!. The Evaluation of Eq. (21), requires the distribution for the area of a typical Voronoi cell. From [17] the distribution of the normalized area is given by fX(x) = m m Γ(m)x m−1exp( −mx), (22) wherem= 3.5andXis a random variable that denotes the size of the typical Voronoi cell normalized by the value1/λM. Employing
Eq. (22),A3 can be simplified to
A3= m m λS/λMq{H} y (n) +m m. (23)
SubstitutingA2and A3in Eq. (19), we obtain
Ξ(n) = 1− m m1−q{H} z (n) λS/λMq{ H} y (n) +m m. (24) Remarks
• From Eq. (18) it is easy to see that the coverage probability in terms of the desired QoS is a function of: (i) the fraction of spectrum (β) allocated to the small cell tier; (ii) the required rate for content transfer (T) and (iii) the path-loss exponent (α). It is independent from the density of small cells and their transmit powers. This can be credited to the fact that while increasing the density of small cells reduces average link distance byΘ(1/√λs)the distance between nearest interferer
also scales under the same law. Consequently, the gain in terms of signal power is offset with the increase in aggregate interference.
• Noting that the probability of being covered, given the fact that content can be locally retrieved is independent of the density and the transmit power, then it follows that
P{covM}(n) = Ξ(n)
1 + (δγδ
thmB(δ,1−δ)−2F1(1,δ;1+δ;−1/γthm)). (25)
where γths= 2 T/β
−1 andΞ(n)is defined in Eq. (13). Proposition 4. Consider an arbitrary MU which generates a
request for nth object from the global content library of size N.
The probability that the MU is covered locally in two-tier small cell networks under LRU based content eviction policy can be quantified as
∆(a) = 1− mm 1 2 R∞ 0 erfc Cz−µ(t) √ 2σ2 (t) p(n) exp(−p(n)t)dt λS/λM 1−1 2 R∞ 0 erfc Cy−µ(t) √ 2σ2 (t) p(n) exp(−p(n)t)dt +m m 1 +δ 2T/a −1δπ/sin(πδ)−2F11, δ; 1 +δ;−1/ 2T/a −1 . (27) 0 1 2 3 4 5 0 0.2 0.4 0.6 0.8 1 Required Rate [T bps/Hz] Coverage Probability [P cov (n)] Cs=5 Cs=10 n=10 n=20 n=1
Figure 2. Information centric coverage probability (Pcov(n)) as a function of
varying the required transmission rate (T) for various requested object indices (n) and small cell cache memory (Cs) withCm = 10,α= 4,λm = 10−3, λs= 10−2,β= 0.5,N= 104 andη= 1.2(see Eq.(26)).
where∆(a)is defined in Eq. (27).
Proof: Employing the definition of information centric
prob-ability of being locally covered from Eq. (9) in conjunction with Eqs. (13) and (25) completes the proof.
Remarks
• From Proposition 4, it can be easily observed that unlike the traditional coverage probability metric, the information centric coverage probability is strongly dependent upon the density of deployment for each tier. More specifically, the ratio between the density of SBSs and MBSs dictate the overall performance of the scheduled downlink MU.
• Another interesting observation from Proposition 4 is that the information centric coverage probability is dependent upon which content is requested (i.e. object index n) and also the cache sizes deployed across both tiers. Optimal dimensioning of the allocated memory at each tier can be employed to max-imize the downlink performance. We defer the dimensioning problem for the future work.
VI. DISCUSSION& RESULTS
Fig. 2 investigates the impact of the desired bit rate, the popu-larity of requested object and the size of SBS cache on information centric coverage probability4. As expected, the probability of being locally covered decreases with an increase in the desired rate. Intu-itively, this can be attributed to the co-channel interference which limits the maximum attainable rate in the downlink transmission for any scheduled MU. For a fixed desired rate, the information centric coverage probability is strongly dependent on how popular the requested content is. The content which is less frequently demanded by the users has a lower probability of being in the cache and thus the probability of retrieving such a object from the serving macro or small cell BSs is also low. Thus the information centric coverage probability decreases with an increase in the requested object index n, when objects are sorted in accordance with their popularity (such as in case of the Zipf distribution). As shown
4Throughout this section, the size of cache at SBSs is denoted by (i.e.,C
y= Cs) while the size of cache at MBS is denoted byCz=Cm.
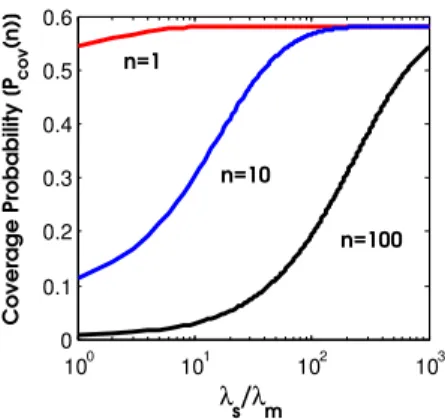
100 101 102 103 0 0.1 0.2 0.3 0.4 0.5 0.6 λ s/λm Coverage Probability [P cov (n)] n=1 n=10 n=100
Figure 3. Information centric coverage probability (Pcov(n)) as a function of
varying the ratio of deployment between small cells and macro cells(λS/λM)
for various requested object indices (n) withT = 1,Cm= 10,Cs= 5,α= 4,
β= 0.5,N= 104 andη= 1.2(see Eq.(26)).
in Fig. 2 the coverage probability for the objects which are less frequently requested can be significantly improved by increasing the size of the cache available at the SBSs. For instance, when
T = 1 bps/Hz is required for the downlink transmission, the coverage probability can be improved by50%forn= 10−20. For the popular content, deploying more memory does not effect the coverage probability as transmissions are already constrained by the attainable QoS performance for the the downlink MU and not on the cache size. Note that the coverage probability increases with an increase inη (the exponent of Zipf distribution). Due to the space constraints, we refrain from presenting the straightforward results. Fig. 3 depicts the impact of increasing the average number of small cells per macro cells (i.e., the ratio of deployment density λS/λM) on the information centric coverage probability. As is obvious from the figure, the coverage probability for the less frequently referenced items improves significantly through the network densification. Following, the widely observed 10−90 law, i.e., 10% of the content is requested 90% of the time, it is easy to see that for a library of size N = 104, most referenced
items are from n = 1−100. Moreover, as depicted by Fig. 3 the local coverage probability forn= 100can be increased by a factor of 6×with ultra dense deployment. However, the coverage probability considering only attainable QoS, does not depend on the deployment densityλs(see Eq. (18) and subsequent remarks).
Thus instead of deploying more SBSs, simply increasing the cache memory at each SBS will have a similar impact.
Fig. 3 explores the behavior of the information centric coverage probability against the deployed cache memory (Cs = Cm) at
both the small and macro BSs for various values of the desired rate (T). An interesting observation from Fig. 3 is that for any referenced object, there exists two distinct operation regimes, i.e., (i) a memory constrained regime; and (ii) a QoS constrained regime. In a memory constrained regime, the information centric coverage probability can be significantly improved by increasing the size of the cache installed on the BSs. However, after a certain value ofCm, say Cm∗, the benefits of adding more memory saturate. In
other words, the information centric coverage probability saturates to a certain value which is dictated by the path-loss exponent,
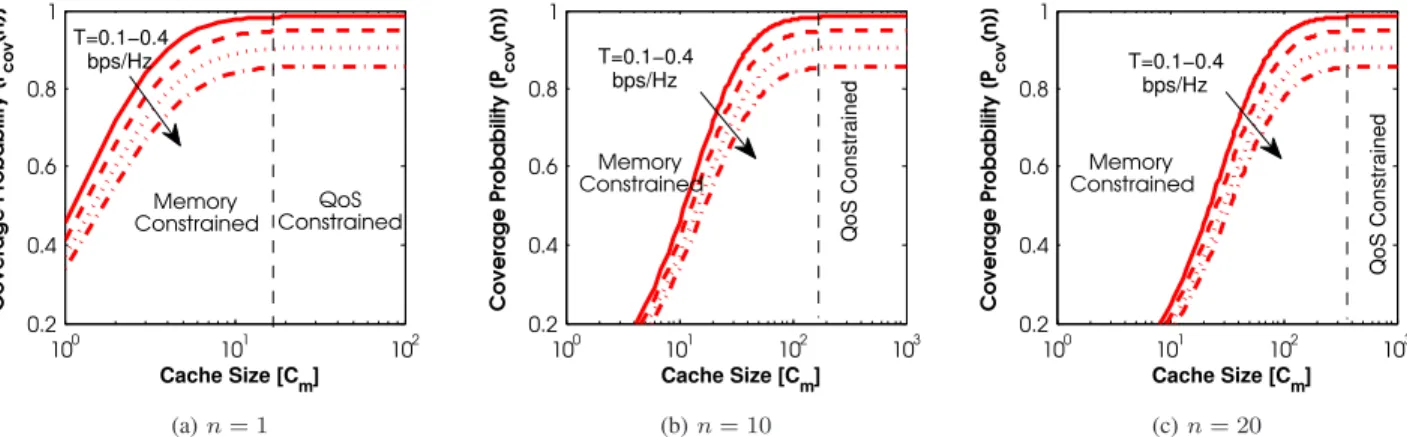
100 101 102 0.2 0.4 0.6 0.8 1 Cache Size [Cm] Coverage Probability [P cov (n)] QoS Constrained Memory Constrained T=0.1−0.4 bps/Hz (a)n= 1 100 101 102 103 0.2 0.4 0.6 0.8 1 Cache Size [Cm] Coverage Probability [P cov (n)] QoS Constrained T=0.1−0.4 bps/Hz Memory Constrained (b)n= 10 100 101 102 103 0.2 0.4 0.6 0.8 1 Cache Size [Cm] Coverage Probability [P cov (n)] QoS Constrained Memory Constrained T=0.1−0.4 bps/Hz (c)n= 20
Figure 4. Information centric coverage probability (Pcov(n)) as a function of cache size (Cs=Cm) at small cells and macro cells(λS/λM)for various requested
object indices (n) and desired rates (T) with ,α= 4,β= 0.5,λs/λm= 2,N= 104 andη= 1.2(see Eq.(26)).
the required downlink transmission rate and the allocated fraction of spectrum at each tier. Thus, the downlink performance of the MU becomes QoS constrained rather than memory constrained. Furthermore, it is observed that as expectedC∗
mincreases with an
increase in n. Effectively, sporadically referenced items have an expanded memory-constrained operational regime as compared to the popular items. Thus the improvement by adding the extra cache memory at the BSs strongly depends on the maximum content index sayn∗, for which the network information centric coverage needs
to be maximized.
VII. CONCLUSION
In this article, we presented a comprehensive framework for the information centric modeling of a two-tier heterogeneous cellular network. We introduce a new metric called ‘information centric local coverage probability’ which quantifies the probability that a downlink MU can retrieve its desired content from the content caches deployed at the nearest macro base-station or from the overlaid small cells. We demonstrated that unlike a traditional cov-erage metric, which is completely characterized by the distribution of the signal-to-interference ratio (SIR), the information centric coverage probability is coupled with: (i) the size of caches; (ii) the content eviction strategy; (iii) the underlying popularity law for referenced objects; (iv) the size of global content library; (v) the desired downlink transmission rate; and (vi) the amount of spectrum allocated to each tier. Moreover, under the SIR based coverage model the probability of an MU being covered is independent of the density of the deployed base stations and only depends on desired rate threshold, allocated fraction of spectrum and the path-loss exponent. However, the information centric coverage probability is strongly coupled with the deployment density of base-stations. It is demonstrated that when a least recently used content is evicted from the cache, the network densification can bring gains of the order of 6×for a moderately accessed object. It is demonstrated that for a certain desired rate, the information centric coverage probability has two distinct operational regimes with respect to the cache size, i.e., (i) memory limited; and (ii) cache limited. It is shown that the performance can be maximized in a memory limited regime by increasing the cache capacity. However, there exists a threshold capacity (dependent upon the underlying popularity law and considered referenced object) after which additional memory does not bring any benefit in terms of performance. The operation beyond this threshold is strongly dependent on the required rate. In summary, it is shown that the information centric coverage probability is a strong function of the content type and thus content aware design can bring significant performance gains for the 5G cellular networks. REFERENCES
[1] A. Ericsson, “Traffic and market data report: On the pulse of the networked society,”White Paper, 2014.
[2] H. ElSawy, E. Hossain, and M. Haenggi, “Stochastic geometry for modeling, analysis, and design of multi-tier and cognitive cellular wireless networks: A survey,”IEEE Communications Surveys & Tutorials, vol. 15, no. 3, pp. 996–1019, 2013.
[3] J. G. Andrews, F. Baccelli, and R. K. Ganti, “A tractable approach to cover-age and rate in cellular networks,”IEEE Transactions on Communications, vol. 59, no. 11, pp. 3122–3134, 2011.
[4] E. Ba¸stu˘g, M. Bennis, and M. Debbah, “Cache-enabled small cell networks: Modeling and tradeoffs,” EURASIP Journal on Wireless Communications and Networking, (In Press), 2014.
[5] N. Golrezaei, A. G. Dimakis, and A. F. Molisch, “Wireless device-to-device communications with distributed caching,” inIEEE International Symposium on Information Theory Proceedings (ISIT). IEEE, 2012, pp. 2781–2785. [6] N. Golrezaei, A. Dimakis, and A. Molisch, “Scaling behavior for
device-to-device communications with distributed caching,”IEEE Transactions on Information Theory, vol. 60, no. 7, pp. 4286–4298, July 2014.
[7] M. Ji, G. Caire, and A. F. Molisch, “Wireless device-to-device caching networks: Basic principles and system performance,” arXiv preprint arXiv:1305.5216, 2013.
[8] X. Wang, M. Chen, T. Kwon, L. Jin, and V. Leung, “Mobile traffic offloading by exploiting social network services and leveraging opportunistic device-to-device sharing,”IEEE Wireless Communications, vol. 21, no. 3, pp. 28–36, June 2014.
[9] Y. Zhang, E. Pan, L. Song, W. Saad, Z. Dawy, and Z. Han, “Social network aware device-to-device communication in wireless networks,”IEEE Transactions on Wireless Communications, vol. 14, no. 1, pp. 177–190, Jan 2015.
[10] N. Golrezaei, A. F. Molisch, A. G. Dimakis, and G. Caire, “Femtocaching and device-to-device collaboration: A new architecture for wireless video distribution,”IEEE Communications Magazine, vol. 51, no. 4, pp. 142–149, 2013.
[11] H. Che, Y. Tung, and Z. Wang, “Hierarchical web caching systems: Modeling, design and experimental results,”IEEE Journal on Selected Areas in Communications, vol. 20, no. 7, pp. 1305–1314, 2002.
[12] C. Fricker, P. Robert, and J. Roberts, “A versatile and accurate approxima-tion for lru cache performance,” inProceedings of the 24th International Teletraffic Congress. International Teletraffic Congress, 2012, p. 8. [13] S. N. Chiu, D. Stoyan, W. S. Kendall, and J. Mecke,Stochastic geometry
and its applications. John Wiley & Sons, 2013.
[14] M. Haenggi, J. G. Andrews, F. Baccelli, O. Dousse, and M. Franceschetti, “Stochastic geometry and random graphs for the analysis and design of wireless networks,” IEEE Journal on Selected Areas in Communications, vol. 27, no. 7, pp. 1029–1046, 2009.
[15] C. Fricker, P. Robert, J. Roberts, and N. Sbihi, “Impact of traffic mix on caching performance in a content-centric network,” in IEEE Conference on Computer Communications Workshops (INFOCOM WKSHPS). IEEE, 2012, pp. 310–315.
[16] H. Yu, D. Zheng, B. Y. Zhao, and W. Zheng, “Understanding user behavior in large-scale video-on-demand systems,” inACM SIGOPS Operating Systems Review, vol. 40, no. 4. ACM, 2006, pp. 333–344.
[17] S. M. Yu and S.-L. Kim, “Downlink capacity and base station density in cellular networks,” in 11th International Symposium on Modeling & Optimization in Mobile, Ad Hoc & Wireless Networks (WiOpt). IEEE, 2013, pp. 119–124.