Performance Comparison of Combined Collaborative Filtering Algorithms for
Recommender Systems
Dilek Tapucu∗,†, Seda Kasap∗, Fatih Tekbacak∗ ∗ Department of Computer Engineering
Izmir Institute of Technology Urla, Izmir, Turkey 35430
Email:{dilektapucu, sedakasap, fatihtekbacak}@iyte.edu.tr †Faculty of Engineering and Natural Sciences
Sabancı University
Orhanli, Tuzla, Istanbul, Turkey 34956 Email: [email protected]
Abstract—Recommender systems have a goal to make per-sonalized recommendations by using filtering algorithms. Col-laborative filtering (CF) is one of the most popular techniques for recommender systems. As usual, huge number of the datasets on the Internet increase the amount of time to work on data. This challenge enforces people to improve better algorithms for processing data with user preferences and recommending the most appropriate item to the users. In this paper, we analyze CF algorithms and present results for combined user-based/item-based CF algorithms for different size of datasets. Our goal is to show combined solution results using Loglikelihood, Spearman, Tanimoto and Pearson algorithms. The contribution is to describe which user based CF algorithms and user/item based combined CF algorithms perform better according to dataset, sparsity, execution time and k-neighborhood values.
Keywords-Recommender systems, collaborative filtering.
I. INTRODUCTION
Nowadays, installation of recommender systems in infor-mation filtering applications and e-commerce applications is the most common applied system to offer alternative products to their customers. In the near term, search en-gines will increasingly incorporate simple recommender technologies to handle approximate queries. Furthermore, the recommender industry will be larger, and recommender technologies will be more pervasive than the search industry and search technology in the long term.
In order to make good decisions in any situation, it is necessary to possess a certain sufficient amount of data. Recommender systems suggest items of interest to users based on available information such as previous transactions, the transactions of other users, and features of the items themselves. Personalization technologies and recommender systems help to provide personalized suggestions regarding which information is the most relevant to users. If users offer their feedback on purchased or consumed items, the task of recommender systems is to predict user preferences for the yet unseen items based on user’s prior feedback and
activities and, subsequently, to recommend the item(s) with the highest estimated relevance to the user.
Collaborative filtering is one of the most popular tech-niques in the recommender systems. Collaborative filtering (CF) algorithms supply suggestions to a user by the help of other users with similar opinions. This kind of collaborative filtering based recommender system brings mutual benefits to users and the operators in the web environments. For example, e-commerce sites use recommender systems to increase sales while users benefit by finding anything related with their interests without wasting their time. Good recom-mender systems help a user by providing recommendations based on his/her preferences to make decision easily.
The challenges for recommendation algorithms expand to three key dimensions, identified as sparsity, scalability and cold-start [1].
• Sparsity: The sparsity problem occurs when transac-tional or feedback data is sparse and insufficient for identifying neighbors. It is a major issue limiting the quality of recommendations and the applicability of collaborative filtering in general.
• Scalability: Recommendation algorithms seem to be efficient in filtering items that are interesting to users. However, they require computations that are very ex-pensive and grow non-linearly with the number of users and items in a database. Therefore, in order to bring recommendation algorithms successfully on the web, and succeed in providing recommendations with acceptable delay, sophisticated data structures and advanced, scalable architectures are required.
• Cold Start: An item cannot be recommended unless it has been rated by a substantial number of users. This problem applies to new and obscure items and is particularly detrimental to users with collective taste [1]. Likewise, a new user has to rate a sufficient number of items before the recommendation algorithm is able to provide reliable and accurate recommendations.
2012 IEEE 36th International Conference on Computer Software and Applications Workshops 2012 IEEE 36th International Conference on Computer Software and Applications Workshops
In this paper, there are two major steps that are followed. Firstly, we analyze user based CF algorithms and compare them by the change of neighborhood values and dataset sizes. According to this comparison, the user based CF algorithms can be chosen for the custom dataset. Besides, we draw a conclusion about which algorithms work better in which cases by calculating the margin of the error. In some conditions, a combination of user-based/item-based algorithms can give better results. For the second step, we execute user-based and item-based CF algorithms one after another to obtain a more suitable recommendation for target user. Then, the results are compared for acquiring productive solutions for different dataset sizes.
II. RELATEDWORK
Recommender systems are usually classified into three categories based on recommendation approach: content-based, collaborative, and hybrid approaches. Content-based filtering systems use data about the items and information related to target user. Collaborative filtering systems do not use data about the content of the items, they make recommendations to the target user using information about a set of users and their relation with the item. These systems accumulate preferences, and then use them to predict the preference of a particular user for the target items such as movies, music CDs, books or web pages. Hybrid recom-mender systems combine content-based and collaborative methods in several different ways [2].
Recommendation systems provide personalized sugges-tions which increase the probability of customer to make purchase. This is especially important in markets where the variety of choices is large and the taste of customers is considerable. GroupLens Research1 built MovieLens as an experimental platform to allow them to study these areas in ways that help real people with real needs. MovieLens is a typical CF system that collects movie preferences from users and then groups users with similar tastes.
III. COLLABORATIVEFILTERINGAPPROACH AND
ALGORITHMDEFINITIONS
Collaborative filtering systems are classified based on the nature of their algorithmic technique into memory-based and model-based approaches [3]. Model-based techniques use previous user activities to first learn a predictive model (typ-ically using some statistical or machine-learning methods), which is then used to make recommendations. Memory-based algorithms, which we apply in this paper, utilize the entire user-item database to generate a prediction. These systems employ statistical techniques to find a set of users, known as neighbors, that have a history of agreeing with the target user (i.e., they either rate different items similarly or they tend to buy similar sets of items). Once a neighborhood
1http://www.grouplens.org/
of users is formed, these systems use different algorithms to combine the preferences of neighbors to produce a prediction or top-N recommendation for the active user. The techniques, also known as nearest-neighbor or user-based collaborative filtering are more popular and widely used in practice [4]. There are different methods that can be applied to compute similarity or weight between users (or items) like similarity computation, prediction and recommendation computation, top N recommendations [5]. There are some limitations for the memory based CF techniques. For the conditions: a) when the similarity values are based on common items, b) when data are sparse and the common items are not enough to use similarity on algorithms. To obtain better performance measurements for these prob-lematic conditions, model-based CF approaches have been investigated.
A. Metamodel for Recommender Systems
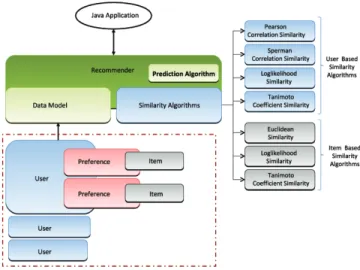
This section consists of implementing core algorithms for making recommendation. As a result of our research on collaborative filtering algorithms we come across the Apache Mahout-Taste2 which is a flexible, fast and open source collaborative filtering engine for Java. Actually, the engine takes users’ preferences for items and returns estimated preferences for other items. Fig. 1 shows Taste’s architecture and the building blocks.
Recommender applies a similarity function on a subset of pairs of items (or users) in the dataset. A similarity function usually returns a value between 0 and 1, with 1 representing two completely similar items and 0 completely dissimilar items. When the Java application requests a few recommendations for a given item, the Recommender returns the items with the highest similarity.
Recommender retrieves items and users through Data-Model abstraction.DataModelprovides methods that count the total number of users, total number of items, number of users that prefer a certain item, and any more functions.
B. Algorithm Definitions
1) Prediction Algorithm: Typical example of this CF approach is neighborhood based CF. The neighborhood-based algorithm calculates the similarity between two users or items which produces a prediction for the user taking the weighted average of all the ratings.
In user-based algorithm, predictionpa,i of an active user on target item is given by:
pa,i=ra+ k u=1(ru,i−ru)∗sim(a, u) k u=1sim(a, u) (1) When generating predictions from the nearest neighbors, neighbors can be weighted based on their distance to the
Figure 1. Metamodel for Recommender Systems with User/Item Based CF Algorithms and Preferences
target user. To generate predictions for active usera on an itemi:
ra = mean rating for user a
u1, u2, ..., uk = k-nearest-neighbors toa ru,i= rating of user uon itemi
sim(a, u) = similarity correlation between a and u. It requires computing correlations between user u and other users according to interest scores (or ratings).
There are several algorithms which will be explained in the next chapter as Pearson Correlation Similarity, Spear-man Correlation Similarity, Tanimoto Coefficient Similarity, Loglikelihood Similarity and Euclidean Distance Similarity that have been used to compute similarities between users. Tanimoto Coefficient Similarity and Loglikelihood Similar-ity algorithms are common for user based and item based CF approaches.
2) User Based Collaborative Filtering Algorithms: User based collaborative filtering predicts a test user’s rating with the help of users’ rating information having similar interest.
Pearson Correlation Similarity:The correlation between two variables reflects the degree to which the variables are related. The most common measure of correlation is the Pearson Product Moment Correlation (called Pearson’s correlation for short). For user-based Pearson correlation algorithm, wu,v = i∈I(ru,i−ru)(rv,i−rv) (ru,i−ru)2(rv,i−rv)2 (2) wherei∈I summations of users’ ratings named as u and
v [5].
Spearman Correlation Similarity: Spearman’s corre-lation algorithm is applied by using rank of ratings. It also measures the strength of relationship between two variables [6]. If the dataset has not a normalized distribution,
Spearman can give better results than Pearson correlation. The Spearman correlation is calculated as in (3).
r(U1, U2) = 6
(rank(rui1)−rank(rui2)) 2
n(n2−1) (3) Tanimoto Coefficient Similarity: Tanimoto coefficient denotes the ratio of intersections for two different datasets. This approach is mostly used for sparse datasets. Tanimoto coefficient is
T(X, Y) = X∩Y
(X+Y)−(X∩Y) (4)
whereX andY defines the elements in datasets.
Loglikelihood Similarity:Likelihood function represents a function of the unknown parameter Θ given the data y. For many applications involving likelihood functions, it is more convenient to work in terms of the natural logarithm of the likelihood function, called the loglikelihood:
f(y; Θ) = n i=1
fi(yi; Θ) =L(Θ;y) (5) 3) Item Based Collaborative Filtering Algorithms: Item based collaborative filtering uses ratings of items to find item based similarities. In this approach, we should search an item-item matrix for active users who rated these items to find relationship between them. To calculate similarity between items, users who rated both items are isolated and a similarity computation algorithm is applied.
Euclidean Distance Similarity:This algorithm computes Euclidean Distance between each item’s preference vector. The shorter the distance between these vectors is, the greater the similarity is. Euclidean Distance between two of such vectors can now be computed and used as a measure of their similarity. The formula for computing the Euclidean Distance between two vectorsiand j equals to the root of
the sum of squared differences between coordinates of a pair of vectors as shown in (6). dij= n k=1 (xik−xjk)2 (6) Euclidean Distance Similarity calculates (6) as similarity value for each pair of items and then returns
1
1−dij (7)
which results in a value between 0 and 1.
IV. EXPERIMENTALRESULTS FORCOLLABORATIVE
FILTERINGALGORITHMS
This part basically considers and analyzes the results of varying different parameters in a more sophisticated user based CF algorithms. We illustrate our test results with dif-ferent datasets which are supplied from Movielens Research Website3to evaluate variants of user-based recommendation algorithms.
A. Dataset
MovieLens has three available datasets:
• 100,000 ratings (1-5) for 1682 movies by 943 users (100K dataset which we used it in the first step of our experiments). Each user has rated at least 20 movies. Users and items are numbered consecutively from 1. The data is randomly ordered. There is a tab separated list of user id|item id|rating|timestamp
in the dataset.
• 1 million ratings (1-5) for 3900 movies by 6040 users (1M dataset which is used also for a second step in our experiments)
In this paper, we used memory-based CF algorithms. The categories of memory-based CF algorithms are cor-relation similarity algorithms such as Pearson Corcor-relation and Spearman Correlation Similarity, top N recommendation algorithms such as Tanimoto Coefficient Similarity and Loglikelihood Similarity for 100K and 1M datasets.
B. Experimental Results
Sensitivity of parameters as neighborhood size and the loading factor of the dataset should be determined for com-paring algorithms and evaluation results. We use Root Mean Square Error (RMSE) as our choice of evaluation metric to evaluate the quality of our recommender system and report prediction experiments because of its common usage and ease of implementation. RMSE evaluates the accuracy of a system by comparing the numerical recommendation scores against the actual user ratings for the user-item pairs in the test dataset. In an analogy to standard deviation, taking the square root of Mean Absolute Error (MAE) yields RMSE,
3http://www.grouplens.org/node/73
which has the same units as the quantity being estimated. MAE between ratings and predictions is a measure of the deviation of recommendations from their true user-specified values. For each ratings-prediction pair < pi, qi >, MAE treats the absolute error between them i.e.,|pi−qi|equally. MAE [4] is computed by first summing absolute errors of the N corresponding ratings-prediction pairs and then computing the average as seen in (8).
M AE= N
i=1|pi−qi|
N (8)
The square root of this equation gives RMSE value. The lower the RMSE value is, the more accurately recommen-dation engine predicts user ratings.
1) User Based CF Algorithms: This mechanism uses user rating data to compute similarity between users or items for making recommendations. Similarity computation between items or users is an important part of this approach. Pearson correlation, Spearman correlation, Tanimoto coefficient and Loglikelihood similarity algorithms are used and showed in the graphics of experimental evaluations.
When the task is to generate a top-N recommendation, we need to find k most similar users or items (nearest neighbors) after computing the similarities, and then aggregate the neighbors to get the top-N most frequent items as the recommendation.
We discuss the results of Fig. 2 and Fig. 3 for user based CF algorithms according to dataset, sparsity, time and K-neighborhood parameters.
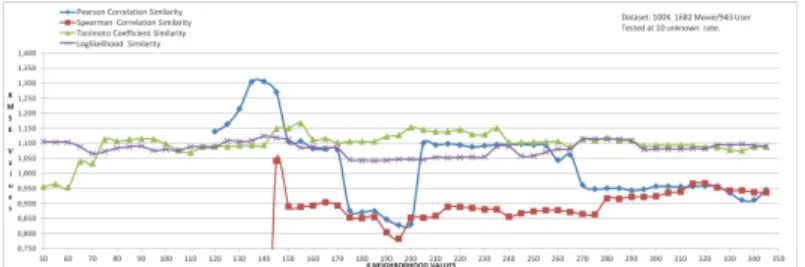
• Dataset: The training data set which is used here is from MovieLens. Datasets which indicate 80% of the data was used as training set and 20% of the data was used as test set in both 100K and 1M dataset. In Fig. 2, dataset was converted into a user-item matrix that had 943 rows (943 users) and 1682 columns (1682 movies that were rated by at least one of the users). In Fig. 3, data set was converted into a user-item matrix that had 3900 rows and 6040 columns. At the scenario for results of two experiments, 10 user ratings were picked from test set and 10 recommendations were made by the system according to k-neighborhood value. • Sparsity: We should note that sparsity problem of
the datasets affects our results. If there are not enough neighbors for the target user in the data set then it becomes challenging to predict.
When we compare the RMSE values in between 100K dataset and 1M datasets, it is realized that error value increases which means accuracy decreases. The most important reason is the sparsity level. For the data matrix R, this is defined as 1-(non zero entries / total entries). The sparsity level of the Movie data set is, therefore, 1-(1000209 / (3900*6040) ) = 0.9575391. This shows us that the sparsity of the rating values are so high and it affects all our result set badly. It is
Figure 2. Dataset: 100K - 1682 Movie / 943 User
Figure 3. Dataset: 1M - 3900 Movie / 6040 User
the same situation, if the target user has only one or two ratings to a movie and no other ratings to 6039 movies; it is undesirable and unnecessary to calculate similar users to target. In this case, many users can be found as similar minded to target with comparing one movie but in reality they can be dissimilar. That’s why RMSE values increase in the 1M dataset.
• Time: Time performance is another important issue that must be considered for selecting the best similarity algorithm. For algorithms which their time performance is measured in MovieLens 100K base data set, Pearson Correlation takes 19.76 sec, Spearman Correlation takes 493.657 sec, Tanimoto Coefficient takes 32.328 sec and Loglikelihood takes 31.094 sec.
• K-Neighborhood: The size of the neighborhood has considerable impact on the prediction quality. To deter-mine the sensitivity of this parameter, we performed an experiment where we varied the number of neighbors to be used. Fig. 2 and Fig. 3 show comparison of the behaviors for all similarity algorithms according to K nearest neighborhood values under the same conditions. There is majorly one difference between Fig. 2 and Fig. 3. k-neighborhood value increases in Fig. 3 because of the ascending number of users.
In Fig. 2, the lowest RMSE values belong to Spear-man Correlation Similarity algorithm. Pearson Correlation Similarity algorithm follows it in many cases as intervals for k-neighborhood values between 170-200 or 260-350. Tanimoto and Loglikelihood Similarity algorithms behave more stable than other two algorithms. Interval of RMSE value is generally between 0.95 and 1.15 which is acceptable in many environments.
In Fig. 3, we realize that Loglikelihood Similarity algo-rithm results are much better than other algoalgo-rithms. Be-sides, Tanimoto comes behind the Loglikelihood Similarity. Spearman and Pearson Correlation Similarity algorithms behave similarly for all k-neighborhood values. Tanimoto Correlation Similarity algorithm has really bad predictions until k-neighborhood value is 1000. Then, it is stable at 1.4 RMSE value as Loglikelihood.
In Fig. 2, Pearson and Spearman Correlation Similar-ity algorithms do not return any similarSimilar-ity value until k-neighborhood value reaches 110. Likewise, Fig. 3 shows that k-neighborhood value should be at least 900 for Spearman Correlation Similarity and 1100 for Pearson Correlation Similarity algorithms.
C. Combined User Based/Item Based CF Recommendation
For a combined solution, first we eliminate the dataset in the user based side and then, 4 different user-based CF (Pearson Correlation Similarity, Spearman Correlation Sim-ilarity, Loglikelihood Similarity and Tanimoto Coefficient Similarity) and 3 different item-based CF algorithms (Eu-clidean Similarity, Loglikelihood Similarity and Tanimoto Coefficient Similarity) are used.
100K dataset (943 User / 1682 Movie) from MovieLens is used for combined solutions. In our scenario, a random target user and a random movie which is rated as 4 by the target user are chosen. This rating is taken from sample dataset and made a recommendation for target user’s known rate. To achieve a combined solution, firstly we implement user based approach to find a k-nearest neighbor for the target user. Then, we create a new dataset (User * Movie matrix) from these neighbors and send this dataset to item based side. Secondly, item based similarity algorithms are applied
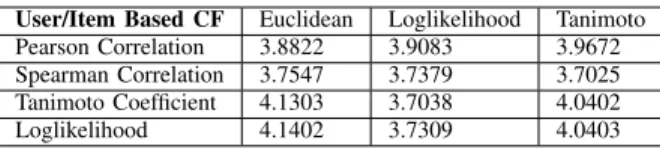
Table I
NEAREST NEIGHBORHOOD FOR MOVIESK=10
User/Item Based CF Euclidean Loglikelihood Tanimoto Pearson Correlation 4.4006 4.4009 4.3090 Spearman Correlation 4.3238 4.5006 4.4049 Tanimoto Coefficient 4.4 3.2854 4.7048 Loglikelihood 4.3 3.8960 4.8017
to the dataset for computing k most similar items of the tar-get movie. After selecting k most similar items, we generate prediction for the target user by taking average of the target user’s ratings on these similar items. Neighborhood size is chosen respectively as 10, 50 and 100.
We discuss the results of combined user/item based CF algorithms in Table I, Table II and Table III according to dataset, sparsity, and K-neighborhood parameters.
• Dataset: 100K dataset (943 User / 1682 Movie) from MovieLens is used for combined solutions.
• Sparsity: 100K dataset is picked, because its sparsity is lower than 1M dataset.
• K-Neighborhood: In the combined solutions, it is obviously clear that latter approach works much better than single approaches.
When we look at Table I, Table II and Table III, it is clear that the higher K nearest neighborhood value provides the system more accurate results for predicted rating. In Table I (K=10), Loglikelihood Similarity/ Loglikelihood Similarity combination gives the nearest rate to the user’s preference. Results of Pearson and Spearman similarity algorithms are not reasonable, because Fig. 2 shows that both Pearson and Spearman algorithms need high nearest neighborhood value to estimate similar users. While the nearest neighborhood value increases, those algorithms produce better results. In Table II, Spearman with Loglikelihood and Spearman with Tanimoto give the nearest rates. Pearson/Loglikelihood and Pearson/Tanimoto are following these results right after. In Table III, Pearson Correlation, Tanimoto Coefficient and Loglikelihood Similarity combinations with Tanimoto simi-larity algorithms in the item based side give the best results in the whole combined solutions when K value is 100. In addition RMSE values of Pearson correlation algorithm in Fig. 2 and results of the combined solutions for Pearson Correlation algorithms can be compared. For 100K data set size, Fig. 2 shows that Pearson Correlation algorithm needs minimum K neighborhood value as 120 to calculate a similarity. After the experiments indicated in Table I, Table II and Table III, we emphasize that combined solution of Pearson Correlation algorithm gives more accurate results with lower K neighborhood value.
V. CONCLUSION ANDFUTUREWORK
CF algorithms have been very successful in both research and practice. However, there still remains important research
Table II
NEAREST NEIGHBORHOOD FOR MOVIESK=50
User/Item Based CF Euclidean Loglikelihood Tanimoto
Pearson Correlation 4.2871 4.1709 4.1757 Spearman Correlation 3.6780 3.8880 3.8518 Tanimoto Coefficient 4.2201 3.5662 4.2507 Loglikelihood 4.24 3.6928 4.3262
Table III
NEAREST NEIGHBORHOOD FOR MOVIESK=100
User/Item Based CF Euclidean Loglikelihood Tanimoto
Pearson Correlation 3.8822 3.9083 3.9672 Spearman Correlation 3.7547 3.7379 3.7025 Tanimoto Coefficient 4.1303 3.7038 4.0402 Loglikelihood 4.1402 3.7309 4.0403
questions in overcoming two fundamental challenges for CF. The first challenge is to improve the scalability and efficiency of CF algorithms. Existing CF algorithms can deal with thousands of consumers within a reasonable time, but the demand of modern e-commerce systems is required to scale millions of users. Efficiency is another intimately related issue. Prediction time of a request must be definitely low like less than one second and prediction engines must often support throughput of several hundred requests per second. The second challenge is to improve the quality of the recommendations for the users. Users need recommen-dations that they can trust to help them find products they will like.
REFERENCES
[1] P. Melville, R. J. Mooney and R. Nagaragan,Content-Boosted Collaborative Filtering for Improved Recommendations, Pro-ceedings of the National Conference of the American Associ-ation Artificial Intelligence, 2002.
[2] G. Adomavicius and A. Tuzhilin,Toward the Next Generation of Recommender Systems: A Survey of the State of-the-Art and Possible Extensions, IEEE Trans. on Knowledge and Data Engineering, 17(6):734-749, 2005.
[3] S. Gong, H. Ye and H. Tan, Combining Memory-Based and Model-Based Collaborative Filtering in Recommender System, Pacific-Asia Conference on Circuits,Communications and Sys-tem, pp. 690-693, 2009.
[4] B. Sarwar, G. Karypis, J. Konstan and J. Riedl, Item-Based Collaborative Filtering Recommendation Algorithms, Proceed-ings of the 10th International Conference on World Wide Web (WWW’01), pp. 285-295, 2001.
[5] X. Su and T. M. Khoshgoftaar, A Survey of Collaborative Filtering Techniques, Adv. in Artif. Intell., Article 4, 2009. [6] H. Kwon, T. Lee and K. Hong,Improved Memory-Based
Col-laborative Filtering Using Entropy-based Similarity Measures, Information Systems Journal, vol.8, pp.29-34, 2009.