THE ELECTROPHORETIC ANALYSIS OF MATERNAL AND FETAL PLASMAS AND SERA
BY LEWIS G. LONGSWORTH, RAYMOND M. CURTIS, AND RICHARD H. PEMBROKE, JR.
(FromtheLaboratories ofTheRockefeller Institutefor MedicalResearch,New York, andthe UnionMemorial
Hospitl,
Baltimore)(Received forpublication May 24, 1944)
INTRODUCTION
The fact that the concentrations of the serum
proteins in fetal, maternal, and normal blood are different has been known for some time. The results of recent investigations (1 to 3) are summarized in Table I. Although the values
TABLE I
Comparison of the results of previous investigators for the serumproteincontentoffetal,maternal, and normal blood
(Concentrations expressed as grams of protein per 100 ml. ofserum, or plasma. Globulinprecipitated with salt solution)
,|PS PA/IPG PS PAIPG PS PAIPG
Normal adult 7.11 1.64 6.73 2.32
Fetal 5.91 1.66 5.11 2.80 5.45 2.28
Maternal 6.75 1.49 7.20 2.20
Reference (1)* (2)t (3)t
*Average values of 15 samples each of normal,maternal,
and cord blood.
tAverage values of 17 samples of fetal blood and 6 samplesofblood from mothers of premature children.
tAverage values of 33 samples of normal blood and 74 samples from infants0to7 days old.
obtained by different workers foragiventype of material are not in quantitative agreement, the results of any one research are consistent in
indicatingcertain systematic differences between bloods from the three sources. Thus, the
con-centration, Ps, ofserum protein in fetal blood is lower thanin that of normal adults. Theratio,
PA/PO,
of albumin toglobulin is,
on the other hand, not very different in the two cases. Finally, maternal blocds, taken during the later stages of pregnancy or at term, tend to have aconcentration oftotal serum protein that is not
very different from the normal values but in
which thealbumin-globulin ratio is low.
In obtaining these results, the solubility of albumin, globulin, and fibrinogen in aqueous
saltsolutions was used for the separation of these plasma fractions. This method does not dis-tinguish.between the antibody globulins and the immunologically inactive globulins. In view of the evidence (4) as to the considerable immunity possessed by the new-born infant, it appeared that it would be of interest to obtain this ad-ditional information. Electrophoresis by the Tiselius procedure (5) affords a new and effective method for theanalysis of serum or plasma and permits the separation of plasma globulin into at least four electrophoretically distinguishable
components exclusive of fibrinogen (6). While there isno reasontothink that the yglobulinof Tiselius consists wholly of immune bodies, there
is much evidence (7) that these bodies are y globulins. It is the purpose of this paper to report the resultsof the electrophoretic analyses of ten pairs of plasmas, or sera, taken from the placenta and the mother at the time of child birth and to compare the values thus obtained with each other and with those for normal adults (8).
EXPERIMENTAL
As described elsewhere (9),uncontaminated fetal blood was drawn fromthe cord immediately after the birth of the child, priorto the expulsion of the placenta. Blood from a vein in the anticubital fossa of the mother was taken, with a minimum of stasis, about one hour after delivery. Wehavenotstudied thechangesintheplasma due to loss of blood on delivery or to the anesthesia. These changes probably cause slight alterations in the concentration of total plasma protein but not in the relativeproportions of the different components.
Inthe case of plasma, 10 ml. of 2.5 per cent sodium citrate in physiological salinewas used as anticoagulant for each 100 ml. of blood. The plasma, or serum, was separated, shipped frozen in dry ice from Baltimore to New York, and stored at 00 C. until analyzed. During storage, a small amount of precipitate, presumably a fibrinclot,formed intheplasma samples, andwasremoved by centrifugation prior to electrophoresis. The
MATERNAL AND FETAL PLASMAS
phoresis procedure has, for the most part, been adequately described elsewhere (6). The following routinedetailsof manipulation have not,however, hitherto been published. A buffer solution, 0.1 N in sodium diethyl barbiturate and 0.02 N in the freeacid, has beenshown tobea satis-factory solvent for the electrophoretic analysis of the human plasmaproteins and was used exclusively through-outthisresearch. Twoliters ofthis bufferwereprepared foreachanalysis by adding44.18grainsofU.S.P. "Barbi-tal," 100ml. of carbonate-free 2 N sodiumhydroxide, and 1500 ml. of water to a 2 liter volumetric flask, heating untilthe acidwasdissolved, cooling to200, and fillingto the markwith water. This buffer solution has a pH of 8.64 at 20°and 8.78at 100,avalue of 4.00 being taken as the pH of 0.05 molar potassium acid phthalate at both temperatures. The specific conductance at00 is 0.00302 mhos. andthe refractive index increment, also at00 and for awavelength,X, of5780A.,is 0.00460. Eight ml.of this solution were added to 7 ml. ofcitrated plasma, or
9 ml. to 6 ml. of serum, in a bag made of 84" Visking tubingand the latter tied andsuspendedin 250ml.ofthe buffer solutioninafootedcylinder. Afterdialysisat0to
30 for one day, the buffer solution in the cylinder was
replaced and the dialysis continued for a second day. The bag and contents were then transferred to the re-maining1.5litersofbuffer solutionfordialysisforathird day, this solutionbeing subsequentlyused as supernatant in forming the boundaries and for filling the electrode vessels.
Some ofthe maternalsamplescontained fat insuspension which interfered with the schlieren photography. The suspended fatglobules scatter the lightand thus lead to
under-exposureoftheportionofthepattern conjugateto
that part of the cell in which the globules are present. Thisistheregionbelowthe,B-globulinpeakineachside of the channel since in thiscase theparticles werefound to
havethesamemobilityinthe electric field asthisplasma component. If one attempts to compensate for this scatteringsimply by increasingtheexposure,theremaining portionofthe pattern isthen over-exposed. Inorder to
overcomethisdifficulty,either theplasmamust beclarified priortoelectrolysis or photographic compensation, other than increasedexposure, mustbeachieved. Clarification by extractionwithfatsolvents is notadvisablebecauseof the resulting modification of the lipo-proteins in clear solutioninplasma. Centrifugationin ananglecentrifuge at 30,000 r.p.m. for 30 minutes is completely effective, causing the suspended fat to rise as a cream without appreciablesedimentation of the plasma proteins. Asa
routineprocedure, however,fortheseparationof traces of sediment,allofoursamplesarecentrifugedat5000 r.p.m. and 0°,using flattened tubes of 6 ml. capacity. This is partially effectiveinclarifyingaplasma, orserum,thatis opalescentduetosuspended fat and isusually sufficientif supplemented by photographic compensation. Thus the red light obtained from a tungsten filament and the Wratten A filter is scattered less than the yellow light given by the H4 mercury lamp and the E filter. This observation confirms that of others (10) who suggested
the use of infra-red light.' We have also noted that a photographic platehavingless contrast than the Wratten C.T.C. plates usually employed, such as a Wratten pan-chromatic plate, reduces the effect ofthescattering without materiallydecreasing the sharpness with which the pattern isdefined.
RESULTS
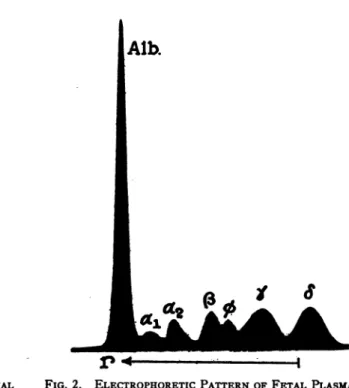
The patterns of a maternal plasma and the
corresponding fetalplasma are shown in Figures
1 and 2, respectively. These patterns were ob-tained from that side of the U-shaped
electro-phoresis channel in which the boundaries were
rising. The pattems- of both the rising and descending boundaries, obtained during the electrolysis of maternal plasma 1 of this paper,
have already been published, Figure 6 of
Refer-ence 6, in connection with a study of the effect of the buffer solution upon the analysis of
human material. In the present research, both patterns have been used in the analyses, as will
nowbedescribed.
Tracings of the patterns, enlarged 2.5
diam-eters,aremade and the area due to a component i, as defined by Tiselius and Kabat (7), deter-mined with the aid of a planimeter. This area isdesignatedas Aidifthe boundary is descending, Ai if it is rising. The total area,
Ag,
of thepattern from one side of the channel should be thesame asthat from theother side since thisarea
is proportional to the integral, jP(dn/dh)dh, whoselimits, therefractive indices of the protein solution, np, and the buffersolution, nB, arethe
same for both channels. Therelation is
f"np
(dn/dh)dh = -np-n = At/abGE,Egr
(1)in which h = heightin the channel a = cell thickness = 2.50 cm.
b = optical distance from cell to schlie-ren diaphragm = 183 cm.
G = ratio of plate to diaphragm travel
= 3.00
1 If thewavelength ofthe lightisvariedduring a series ofanalyses,correctionshould be made for the effect of this variation upon the specific refractions of the plasma pro-teins. With the aid of the schlieren scanning camera, a 60° hollow prism cell (11), and a G.E. special spectrum mercury-admiumlamp of the H4 type, we have measured thedispersion ofplasma in the diethyl barbiturate buffer at00C. If the specific refractive increment, k, is taken
as 0.00186 for X = 5780, then k4360 = 0.00196, ksos&
=0.00190, k5&4*0=0.00187, and
k,438
= 0.00183.Alb.
VP
A*0
IAlb.
a2
(L o
_. ALf
FIG. 1. ELECTROPHORETIC PATTERN OF MATERNAL PLASMA NUMBER 5, DILUTED1:2.55,AFTERELECTROLYSIS
FOR 14,000 SECONDS AT 5.35 VOLTS PER CM.
EC = camera enlargement = 1.00
Et = tracing enlargement = 2.502 = 6.25
Jr = planimeter unitspercm.2 = 16.52 Thecorresponding protein concentration, p, is
p = (np- fB)/k (2)
in which k is the specific refraction increment.
IfDis thefactorbywhich theplasma, orserum,
wasdiluted prior to electrophoresis the original
concentration, P,ingramsofprotein per100 ml.
ofsolution is
P = Dp (3)
Except forsmall uncertainties in D, A,and k, the quantities entering into equations 1, 2, and 3 are known with ample precision. One
uncer-tainty in the dilution factor, D, is due to the entrance, during dialysis, of a small amount of water into the bag containing the protein solu-tion. In one experiment, in which this effect was measured, the bagincreased 2.6 percent in
volume during the 3-day period of dialysis. A
comparison of the refractive index difference,
FIG. 2. ELECTROPHORETIC PATTERNOFFETAL PLASMA NUMBER 5, DILUTED 1:2.78, AFTER ELECTROLYSIS FOR 14,000 SECONDS AT 5.33 VOLTS PER CM.
np-nB, computed from equation 1 with that
measured directly, using the
600
hollow prismcell (11), indicates, however, that the values of
the total pattern area aresubjectto asystematic
personal error in the tracing procedure that
compensatesfor the dilution errorjust noted.
In the case of plasma, another uncertainty in D arises from the diluting effect of the solution used as anticoagulant. If the average volume of red cells in the maternal bloods, for example, is 36.3 per cent (12), the plasma is thereby diluted bya factor of (63.7 + 10)/63.7 since 10 ml. of anticoagulantwere used for each 100 ml.
of blood. Moreover, the citrate solution is
hypertonic and causes a contraction of the red
cells, the accompanying transfer of water from
the red cells tothe plasma causingan additional
dilution of the latter. Ifsodium and potassium citrates are assumed to have the same molar tonicity, interpolation from the data of Heller and Paul (13) yields ared cell shrinkage of 6.1 per cent in the case of ouranticoagulant. The total dilution of the plasma separated from the
blood is,therefore, (63.7 + 10 + 36.3 X
0.061)/
0
MATERNAL AND FETAL PLASMAS TABLE II
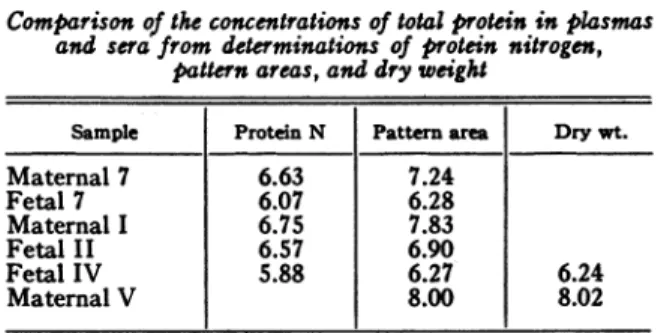
Comparisonof the concentrations of totalproteinin plasmas and sera from determinations of protein nitrogen,
pattern areas,anddry weight
Sample Protein N Pattern area Drywt.
Maternal7 6.63 7.24 Fetal 7 6.07 6.28 Maternal I 6.75 7.83 Fetal II 6.57 6.90 Fetal IV 5.88 6.27 6.24 Maternal V 8.00 8.02
63.7 = 1.192. The corresponding factor for
fetal plasma is (47.2 + 10 + 52.8 X 0.078)/47.2 = 1.299.
The specific refraction, k, is defined by
equa-tion 2. In addition to its dependence on the
temperature, the wavelength, and the type of protein, k also varies with the nature of the buffer electrolytes due to the unequal distribu-tion of the buffer ions between thetwosolutions when the latterareinaDonnan equilibrium (14).
Moreover, owingtothepresenceof nitrogen-free
constituents, such as lipids and carbohydrates,
in many of the plasma proteins, a dry-weight
determination of p, equation 2, yields asmaller
value for k than a determination of protein
nitrogen if the latter is multiplied by the
con-ventional factor of 6.25. In this research, we
haveassumed the specific refractions of all of the plasma proteins to be the same and equal to
0.00186 at 00 and for X = 5780. From a
con-siderationof the additivity of atomic refractions, it is probable that the specific refraction of a
lipid- or carbohydrate-containing protein is but
slightly less, onadry-weight basis, thanone for
which the nitrogen factor is 6.25. The data of Table II indicate, in agreement with the
fore-goingconclusions, thatourvalues for the protein
concentrations are somewhat higher than those
obtained in the usual manner from nitrogen
determinations, being more nearly comparable
with measurementsofdry weight.
Finally, in order to compute the
concentra-tions, P,, of the individual components,
correc-tionmustbe made for theeand5effects. These
effects, it will be recalled, areduetogradients of buffer salt and buffer salt plus protein,
respec-tively,and donot representplasmacomponents.
Therelative concentration of the i-thcomponent
is given very closely by A
i(At
-A.) for adescending boundary and by A
I/(At
-As) forarisingboundary, the A sdenotingpatternareas as defined earlier in this paper. The relative
values are not subject to many of the
uncer-tainties thatenter into the determination of the absolute protein concentrations.
The preceding methods of computation are
illustrated by the data of Table III for fetal plasma 7. The areas from the patterns of the descending and rising boundaries are recorded
inlines 1 and2, respectively. Theaveragetotal
area,608, yields 6.42percentasthe totalplasma
protein concentration, Pp, on substitution in
equations 1 to 3. The relative concentrations from thetwo patternsarerecordedinlines3and
4ofTable III and theiraveragevaluesin lineS.
Multiplication of these relative values by Pp gives the concentrations of the individual
compo-nents, line 6. The relative concentrations on a serumbasisaregiveninthelast line of thetable,
Psindicating the total serumprotein
concentra-tion, i.e.,Pp -P,.
The results for the maternal samples are
summarized inTable IV, plasmasandserabeing
identified by arabic and roman numerals,
re-spectively. The fetal member ofa pair is then
indicatedby thesamenumber in Table V. Both
the actual and the relative concentrations of
each component are reported, the latter on a serum basis, i.e., P,/Ps, except in the case of
TABLE III
Electrophoretic analysisoffetal plasmaNo.7
Component Albumin | | a2 . Total
1 Aid 329 25 49 54 26 91 35 609 2 Ai, 303 23 42 46 22 83 87 606 3 Aid/(At -Ai) 0.574 0.044 0.086 0.094 0.045 0.159 4 Ai,/(At -Aa) 0.582 0.044 0.081 0.088 0.042 0.159 5 Mean = P,/Pp 0.578 0.044 0.084 0.091 0.044 0.159 6 P,(g./100ml.) 3.71 0.28 0.54 0.58 0.28 1.02 6.42 7 Pi'Ps 0.605 0.046 0.088 0.095 0.166 49
JR. TABLE IV
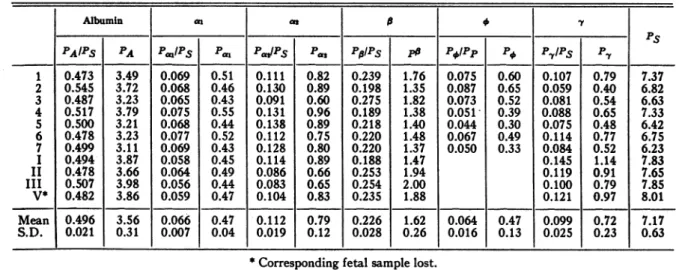
Resultsof theelectrophoreticanalysisofmaternalplasmasand sera
The absoluteconcentrations,Pi,areingramsofproteinper 100ml.ofplasmaor serum. Therelative concentrations
are on aserumbasis,
P,/Ps,
exceptforfibnnogenwhichisonthebasis ofplasma,POfPp
Albumin as B y
PS
PAIPS PA Pam/Ps Pai |au/pS Pas |P/Ps Po P|IPp Po P,/PIS P-t
1 0.473 3.49 0.069 0.51 0.111 0.82 0.239 1.76 0.075 0.60 0.107 0.79 7.37 2 0.545 3.72 0.068 0.46 0.130 0.89 0.198 1.35 0.087 0.65 0.059 0.40 6.82 3 0.487 3.23 0.065 0.43 0.091 0.60 0.275 1.82 0.073 0.52 0.081 0.54 6.63 4 0.517 3.79 0.075 0.55 0.131 0.96 0.189 1.38 0.051- 0.39 0.088 0.65 7.33 5 0.500 3.21 0.068 0.44 0.138 0.89 0.218 1.40 0.044 0.30 0.075 0.48 6.42 6 0.478 3.23 0.077 0.52 0.112 0.75 0.220 1.48 0.067 0.49 0.114 0.77 6.75 7 0.499 3.11 0.069 0.43 0.128 0.80 0.220 1.37 0.050 0.33 0.084 0.52 6.23 I 0.494 3.87 0.058 0.45 0.114 0.89 0.188 1.47 0.145 1.14 7.83 II 0.478 3.66 0.064 0.49 0.086 0.66 0.253 1.94 0.119 0.91 7.65 III 0.507 3.98 0.056 0.44 0.083 0.65 0.254 2.00 0.100 0.79 7.85 V* 0.482 3.86 0.059 0.47 0.104 0.83 0.235 1.88 0.121 0.97 8.01 Mean 0.496 3.56 0.066 0.47 0.112 0.79 0.226 1.62 0.064 0.47 0.099 0.72 7.17 S.D. 0.021 0.31 0.007 0.04 0.019 0.12 0.028 0.26 0.016 0.13 0.025 0.23 0.63
*Corresponding fetal sample lost.
fibrinogen. The average valuesaregiven in the of the fetal components. This also appears to next tothe last line in each table. Thestandard be true for the relative concentrations of the
deviations, S.D., given in the last line, were maternal components. The absolute
concentra-computed from the relation tions of the maternal
plasma
components tend,onthe other
hand,
tobe below thecorresponding
S.D. = (V- -1) maternalserumvalues. This may be accidental1 or it may be that we have underestimated the
inwhich
tV
isthemeanof thenindividual values, diluting effect of our anticoagulant. A small V. Except forfibrinogen,
there appearstobeno increase in the value of thematernalcell volumesystematicdifference between serumand plasma used in the computation of this effect would ineither the actualorthe relativeconcentrations eliminate this discrepancy and also reduce our
TABLE V
Resultsoftheelectrophoreticanalysis offetal plasmas and sera
The absoluteconcentrations, Pi,are ingramsofprotein per 100 ml.of plasmaor serum. The relativeconcentrations
areon aserumbasis, Pi/Ps,exceptforfibnnogenwhichisonthebasis ofplasma, P*/Pp.
Albumin a| | s | B
PAIPS PA P/asPS pal PaPS Pea Pp P#IPp P Ply/P5s P7
1 0.641 3.99 0.037 0.23 0.091 0.56 0.093 0.58 0.063 0.42 0.138 0.86 6.22 2 0.648 4.16 0.042 0.27 0.075 0.48 0.103 0.66 0.068 0.47 0.134 0.86 6.41 3 0.614 3.45 0.042 0.24 0.083 0.47 0.115 0.65 0.055 0.33 0.147 0.83 5.63 4 0.614 3.87 0.045 0.29 0.077 0.48 0.087 0.55 0.050 0.33 0.178 1.12 6.30 5 0.637 3.69 0.069 0.40 0.089 0.52 0.093 0.54 0.045 0.27 0.113 0.66 5.80 6 0.628 3.75 0.049 0.30 0.072 0.43 0.088 0.53 0.049 0.31 0.165 0.99 5.98 7 0.605 3.71 0.046 0.28 0.088 0.54 0.095 0.58 0.044 0.28 0.166 1.02 6.14 I 0.594 3.48 0.049 0.29 0.073 0.43 0.092 0.54 0.191 1.12 5.85 II 0.632 4.45 0.043 0.30 0.078 0.55 0.103 0.73 0.143 1.02 7.05 III 0.598 3.69 0.039 0.24 0.079 0.49 0.102 0.63 0.183 1.13 6.30 IV* 0.600 3.76 0.051 0.32 0.077 0.48 0.102 0.64 0.170 1.07 6.27 Mean 0.619 3.82 0.047 0.29 0.080 0.49 0.097 0.60 0.053 0.34 0.157 0.97 6.18 S.D. 0.019 0.29 0.008 0.05 0.006 0.04 0.008 0.06 0.008 0.07 0.024 0.15 0.38
*Correspondingmaternalsample lost.
MAtR1tAL A1tD FETAt PLASMAS
St
TABLE VI
Comparison ofthealbumin-globulin ratio inmaternal andfetal plasmasand sera
Sample 1 2 3 4 5 6 7 I IIIII Mean S.D.
PAI/PG (maternal) 0.90 1.20 0.95 1.07 1.00 0.92 0.99 0.98 0.92 1.03 1.00 0.09 PA/PG (fetal) 1.79 1.83 1.58 1.58 1.75 1.68 1.53 1.47 1.72 1.48 1.64 0.13
TABLE VII
Comparison oftheratioofy-globulintototal serumglobulinin maternal andfetal plasmasand sera
Sample 1 2 3 4 5 6 7 I II III Mean S.D.
P7,/Pa (maternal) 0.203 0.130 0.158 0.183 0.151 0.218 0.168 0.287 0.228 0.203 0.193 0.045 P7/PG (fetal)
10.384
|0.37910.380
0.459 |0.310 |0.44110.420
0.47210.391
10.454
0.409 0.050standard deviations for the actual concentrations of thematernalcomponents.
DISCUSSION
Ofespecial interest in connection with infant immunity is the distribution of thematernaI and fetal globulins. A comparison of the
conven-tional albumin-globulin ratio, PA/PG,2 with the ratio,
Py/PG,
of y to total globulin serves to emphasizethe differences between the two types of material. Values of theseratios arerecorded in Tables VI and VII, respectively, for each of the10pairsof plasmasor sera. Without excep-tion, the albumin-globulin ratio is higher for a fetal thanfor the corresponding maternalsample. This confirms the observations ofprevious work-ers that, relative to maternal serum, the fetal material is rich in albumin and poor in total globulin. Theelectrophoretic method yields the additional information that the concentration distribution of the individual globulins is quite different in thetwotypesof material. Although poor in total globulin, the fetal samples arerelatively
rich in the presumably antibody-con-taining y globulin, the fetal values ofP,/PG,
TableVII,being, without exception, significantly higher than the corresponding maternal values.
This result is compatible withthecomparatively
2Although there is some evidence (15) that the solubility of the a, component corresponds to that ofanalbumin, it has been classified here as a globulin. When this component wasfirst reported (6), the author did not state explicitly that it was a globulin but the terminology he suggested implied that he consideredit to belongin this class of proteins. This wastheresultofthe observation that al was absent from a preparation of human serum albuminthat stillcontained traces ofa2and globulin.
high degree of immunity possessed by the
new-borninfant.
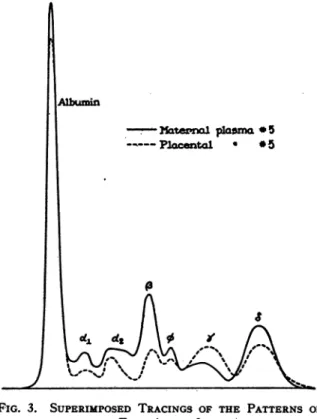
These relationshipsare illustrated graphically in Figure3 in which tracings of Figures 1 and 2
have beensuperimposed, the maternaland fetal
patterns being indicated by the full and dashed lines, respectively. We have alsonoted that in
theelectrolysis ofafetal sample it is always the
'y
globulin peak that first separates from theinitial boundary whereas withamaternalsample
the first toseparate is thatdue to, globulin.
.-atzal
plasm
*
5_PlaCental
*5FIG. 3. SUPERIMPOSED TRACINGS OF THE PATTERNS OF
Even the absolute concentration of a fetal 'y globulin tends tobe somewhat above that of the
corresponding maternal sample, in spite of the relatively low concentration of total globulin in the fetal material. It will be noted, however,
that the marked differences between the fetal
and maternal values of
P7,/PG,
Table VII, are due,inpart, totherelatively highconcentrations of the maternal al, a2, and 8 globulins. Thefollowing comparison of our results with those for normal adults recently reported (8) is of
interest in this connection.
The experimental procedure employed in that report was similar to that used in this research except that the relative concentrations were
computed only from the pattern areas, the
con-centration of total protein being obtained from nitrogen determinations. These relative
con-centrations are, therefore, comparable with ours
andare given,after conversion to a serum basis, in Table VIII, which also includes the fetal and
TABLE VIII
Therelative concentrationsof the serumprotein components ofnormal,fetal, andmaternalplasmas and sera
PAI/PS PclPS PaslPS PP/PS PSyIPs
Normal 0.633 0.049 0.075 0.127 0.116
Fetal 0.619 0.047 0.080 0.097 0.157
Maternal 0.496 0.066 0.112 0.226 0.099
maternal values for comparison. It is evident from this table that the distribution of the fetal
proteins is much more nearly normal than that ofthe maternal proteins. Although the relative concentration of fetal
'y
globulin tends to beabove normal, whereas that of , globulin is belownormal,thedifferencesare not great. The relative concentrations of the maternal al, a2, and , globulins, especially the latter, are, on the other hand, considerably above the normal values. Ithas alreadybeen noted (16) that the
values published inconnection with the study of
buffer solvents (6) were abnormal. This
dis-crepancyis,of course,explained by the factthat
the material used in that study was a maternal plasma.
The absolute concentrations of the proteins
in normal, fetal, and maternal plasmas are
com-pared in Table IX. In using this table,
allow-anceshould be made for the fact that thenormal
TABLE IX
The concentrations, in grams per 100 ml., of the proten
componentsof normal,fetal, and
maternal
plasmasandsera PA -c- - PA- -P, PT PS Normal* 4.04 0.31 0.48 0.81 0.34 0.74 6.38 Fetal 3.82 0.29 0.49 0.60 0.34 0.97 6.18 Maternal 3.56 0.47 0.79 1.62 0.47 0.72 7.17 *From nitrogen determinations-fetal and maternalvaluesobtainedrefractometrically.
values, which were obtained with the aid of
nitrogen determinations, are probably a little lower than the refractometrically measured maternal and fetalvalues.
Ithas beenshown (17) thatalargeproportion of the serum lipids is carried by the a2 and ,
globulins. These components occur in increas-ing amounts in the fetal, normal, and maternal
samples and thus pArallel, roughly, the lipid content of these materials. This is illustrated
by the data of Table X, the
total
lipid andTABLE X
Theconcentrations,ingrams per100ml.ofsolution, ofa2 +, globulin and of totallipid andcholesterolinfetal,normal,
andmaternal plasmas andsera
Fetal Normal Maternal
a2+ l globulin 1.09 1.29 2.41
Total lipid 0.198 0.617 0.900
Total cholesterol 0.034 0.181 0.205
cholesterol valuesof that tablebeingtaken from other reports (18, 19) and thecombined concen-trations of a2 and , globulin being computed
from the data of Table IX.
SUMMARY
Ten pairs of maternal and fetal plasmas, or sera, taken at the time of child-birth have been
analyzed electrophoretically. The
concentra-tions of the electrophoretically separable fetal
proteins have been compared with those of the corresponding maternal components and also withthe valuesfornormaladult plasmarecently
reported (8). Therelative concentrations ofthe
maternal components exhibitgreater deviations from the normal values than do those of the fetal samples, the concentration of maternal g8
globulin being significantlyabove normal. Both the absolute and the relative concentrations of
MATERNAL AND FETAL PLASMAS
fetal -yglobulinarehigher than either the normal
or maternal values. Since the y component includes many of the antibody globulins this
resultisconsistentwith other evidenceas to the natural immunity of thenew-born infant.
Thereareseveral sourcesofexperimentalerror
in the measurement of absolute protein
concen-trations wilth the aid of the electrophoretic method that donotenterinto the determination of relative values. A discussion of these errors is also included and procedures are suggested which, it ishoped, will aid in their elimination.
It is a pleasure to acknowledge our indebtedness to Dr. Vincent P. Dole of the Hospital of The Rockefeller Institute for the opportunity of discussingwithhim many of the problemsassociated with thisinvestigation and to Dr.D.A. MacInnesofthe LaboratoriesofTheRockefeller Institute for his suggestions in the preparation of this report.
BIBLIOGRAPHY
1. Plass, E. D., and Matthew, C. W., Placental trans-mission. IV. The protein fractions in fetal and maternal plasma. Am. J.Obst.andGynec., 1926, 12, 847.
2. Rapoport, M., Rubin, M. I., and Chaffee, D., Frac-tionationoftheserumand plasma proteins by salt precipitation in infants and children. 1. The changes with maturity and age. 2. The changes in glomerulonephritis. 3. The changes in neph-rosis. J. Clin. Invest., 1943, 22,487.
3. Trevorrow, V., Kaser, M., Patterson, J. P.,and Hill, R. M., Plasmaalbumin, globulinandfibrinogen in healthy individuals from birth to adulthood. J. Lab. and Clin. Med., 1942,27,471.
4. McKhann, C. F., and Kapnick, I., Immunity and susceptibilitytodisease inearly infancy. Acritical review. J. Pediat., 1938, 13,907.
5. Tiselius, A., A new apparatus for electrophoretic
analysis of colloidal mixtures. Trans. Faraday Soc., 1937,33, 524.
6. Longsworth, L. G., Recent advances in the study of proteins by electrophoresis. Chem. Rev., 1942, 30, 323.
7. Tiselius, A., and Kabat, E. A., An electrophoretic study of immune sera and purified antibody preparations. J. Exper.Med., 1939, 69, 119. 8. Dole, V. P., The electrophoretic patterns of normal
plasma. J. Clin. Invest., 1944,23, 708.
9. Curtis,R.M.,andWorthington, R.W.,Jr.,Placental bloodplasma. Am.J.Obst. andGynec., 1941,42, 428.
10. Treffers, H. P., and Moore,D.H.,Theuseof infra-red film forelectrophoretic and ultracentrifugal analy-ses. Science, 1941, 93, 240.
11. Longsworth, L. G., Theconcentrationdistribution in two-salt moving boundaries. J. Am. Chem. Soc., 1944, 66,449.
12. Darling, R. C., Smith, C. A., Asmussen, E., and Cohen, F.M., Somepropertiesofhuman fetal and maternalblood. J. Clin.Invest., 1941, 20, 739. 13. Heller, V. G., and Paul, H., Changes in cell volume
produced by varying concentrations of different anticoagulants. J. Lab. and Clin. Med., 1934, 19, 777.
14. Adair, G. S., and Robinson, M. E., The specific refraction increments ofserum-albumin and serum-globulin. Biochem.J., 1930,24, 993.
15. Blackman, S.S., Jr., and Davis,B.D.,Electrophoretic andchemical analysisofproteininnephriticurine. J. Clin.Invest:, 1943,22, 545.
16. Kekwick, R.A., andMcFarlane,A.S.,Thechemistry of the proteins and amino acids. II. Ann. Rev. Biochem., 1943, 12, 93.
17. Blix, G., Tiselius, A., and Svensson, H., Lipids and polysaccharides in electrophoretically separated blood serum proteins. J. Biol. Chem., 1941, 137, 485.
18. Boyd, E. M., The lipemia of pregnancy. J. Clin. Invest., 1934, 13,347.
19. Boyd, E.M., Lipid composition of blood innew-born infants. Am.J. Dis. Child., 1936, 52, 1319.