NSB-Group
CONTENTS
Contents
Important events
3
The CEO’s report
4
Annual report
Board of Director’s report
5
Income statement
13
Balance sheet
14
Cash flow statement
15
Changes in Group equity
16
Notes to the consolidated financial statements
17
Auditor’s report
57
Owner control and corporate governance
58
Statement from the Board and CEO
61
ANNUAL REPORT 2012
Important events in 2012
Long term agreement secures an improved passenger train offer
The Ministry of Transport signed in January 2012 a deal with NSB regarding purchase of passenger rail services with a total value of 15.4 billion NOK. The deal covers the period 2012 to 2017, and a prerequisite is the introduction of a new and improved route offer for Eastern Norway from 2014.
Billion NOK sale in Bjørvika, Oslo
Oslo S Utvikling AS (OSU) is owned by the NSB subsidiary Rom Eiendom AS, together with Entra Eiendom AS and Linstow AS. OSU has sold the three DNB headquarter buildings in Bjørvika in Oslo for a total of 4.8 billion NOK. The buildings have a floor area of about 80 000 square meters and will be the work place for 4 200 DNB-employees. The buildings will be finished and delivered to the new owner in the period 2012-2014.
Introduction of the NSB-app
The NSB-app for train ticket purchase was introduced in February, and the mobile phone is thereby a new ticket vending machine. The app is the main reason why 70 % of passenger train ticket sales were purchases by self-service in 2012.
Train derailment
On the 15th of February one of the new trains, type 74, derailed during a test drive at Nykirke on the Vestfold line. None of the five persons aboard were seriously injured.
The accident has been investigated by Statens Havarikommisjon (Accident Investigation Board Norway) which has not found faults with the train which would have caused the accident. The test program was stopped for a period before final testing and introduction into ordinary traffic was resumed.
First journey on the new train
The first departure with the new regional train type 74 took place on Wednesday 2nd of May from Oslo Central Station to Skien. Several of the ordered 50 new trains have been put into service after passed acceptance tests. The trains service the regional lines Skien-Lillehammer (type 74), and the long local train service between Eidsvoll and Kongsberg (type 75). The name given by the train producer Stadler is; Fast Light Innovative Regional Train (FLIRT). In addition to the 50 trains which are being delivered and put into service, NSB has ordered 16 local trains type 75. The first trains of this order will be delivered in 2014.
Honours award to NSB
The Norsk Designråd (Norwegian Design Council) has given NSB an honours award for design excellence for the new train types 74 and 75. The Council states that NSB is a locomotive for inclusive design in Norway.
Closure of rail lines
Weakened infrastructure has influenced the ability of NSB to meet customer quality expectations. During 2012 for example, the Dovre line was closed for over two months, which reduced the offer to the customers, reduced revenue and increased deviation costs. A large no. of customers have therefore chosen other suppliers due to closure of train lines.
Large population growth increases transport demand
The population of Norway is expected to grow by one million in the next 16 years. The largest part of the growth will occur in and around the larger cities, which will lead to an increased demand for transport. There is political agreement regarding the need for development of public transport, and the ambition of the government is to give the railways a more central role in the transport system.
The NSB recommendation to the National Transport Plan is to increase train capacity during rush hours to and from Oslo and deliver a good intercity service in Eastern Norway. In addition NSB has explained how the service around Stavanger, Bergen and Trondheim can be improved.
Bus tracking
Customers of the express product TIMEkspressen in Eastern Norway can track the bus on the internet. The new tracking system can show the bus position both on mobile phone and tablet computers. Nettbuss is so far the only bus company to use its own GPS-system to give customers real time positioning of the buses.
Major rescheduling of train timetables
The 9th of December a major change in the train timetables was introduced. This was the start of a major improvement in the route offer which will be finalised in December 2014. The changes will primarily give the customers in the central parts of Eastern Norway a much better route offer than today, for example through 10 minute departures for local trains.
ANNUAL REPORT 2012
CEO REPORT
2012 has on average been a good year for the NSB-Group. The financial results are satisfactory, the quality of our delivery has improved, and our customers are more satisfied, even though there is still potential for
improvement. The profit development is not satisfactory in all our areas of operations, but results are good in the real estate and passenger train operations. The group profit before income tax of 853 MNOK and return on equity of 11.4 % are among the best in the history of NSB. In 2012 we reaped the financial benefits of our long term work with development and sale of property in Bjørvika, Oslo, through our associate Oslo S Utvikling AS. The operating profit of the passenger train operations have improved due to increased revenue and reduced operating expenses, while the losses in the freight operations are considerably reduced, especially because of the
restructuring of operations in Sweden.
During the year we have introduced 30 of the 50 new regional and local trains of the Flirt type (Fast, Light, Innovative, Regional Train), and in December we implemented the first part of the change in timetable that will improve the passenger train offer for most of the passengers in Eastern Norway. We hope that more departures and increased capacity in the Oslo area will increase customer satisfaction and the no. of passengers. In parallel with the delivery of new trains and adjustment and increased capacity in the infrastructure we will increase our route offer even more. Due to improved infrastructure and passenger trains punctuality is improved, and is near the goal of 90 %.
CargoNet which operates our freight business is in the middle of a turnaround. The restructuring of the operations in Sweden have improved the results for this part of the business from a large loss to a small profit, while the Norwegian operations still has challenges regarding both quality of delivery and profitability. The closure of the Dovre line for two months during the spring of 2012 was challenging both for us and the customers. The quality of delivery has improved during the year, and CargoNet continues to adjust operations in Norway.
Nettbuss has expanded through acquisitions and new tenders, among others through acquisition of the bus operations of Fjord 1. As a result the bus operations have increased its strength in Western Norway and in the express bus market in Norway. The no. of travels has increased by 5.4 per cent to 133 million, and the no. of employees has increased by 890. The profitability in 2012 was not satisfactory. The competition through tenders in the bus market and demand for new environmental friendly buses has resulted in impairment of bus values and reduced margins. Low margins are now typical for the business. To achieve the necessary profitability in the bus market this development has to be incorporated in the pricing of new tenders.
Rom Eiendom has received a lot of attention regarding the development of building projects near Oslo Central Station and Bjørvika. The three headquarter buildings of DnB were in 2012 sold by our associate Oslo S Utvikling AS, and this has had a major impact on the profit of the year. Rom Eiendom will continue to develop good public transport hubs and commercial properties and dwellings in connection with these.
This spring the National Transport Plan 2014-2023 will be debated and decided on in the parliament. We have in our input to the plan «Oftere, raskere og mer miljøvennlig» described how the NSB-Group can help to develop a total and seamless public transport offer in Norway. We have shown how public transport hubs, train and bus together can meet the increased demand for transport driven by the expected growth of population in and near city centres. Make the infrastructure available, and we will help to get the passenger to and from jobs and holidays!
I have been lucky to work with NSB-employees for more than a year as CEO of the NSB-Group. It has been an eventful year. Our employees have worked day and night to be able to give our customers a really improved service. More trains are punctual and our profits are improving. It is important for us to succeed in making every day better for our many thousands of customers.
ANNUAL REPORT 2012
REPORT OF THE BOARD OF DIRECTORS
Summary of the results and development of the NSB-Group for 2012
The operating profit is 1 192 MNOK (312 MNOK)
Return on equity is 11,4 %
An increase in the number of train passengers and improved operating result in the passenger operations
The number of passengers in the bus operations increased
Restructuring and improved operating profit in the freight operations
Considerable gains on sale of development property
Closure of the Dovre line for two months due to landslide led to cancelled departures and affected especially the freight operations negatively
Improved punctuality both for passenger and freight operations (rail)
Important events
The NSB mobile app for ordering and purchasing tickets has been well received by the customers. Already more than 300 000 have downloaded the app, and this is one of the reasons why 70 % of ticket sales were purchased by self-service in 2012.
The Dovre line was closed due to a landslide from 13th of March to 9th of May. Especially the freight traffic was negatively affected, and a large no. of freight trains had to be cancelled with negative impact on income and profits. In the beginning of May the first Flirt train (type74)was introduced on the passenger line Skien-Lillehammer. By the end of the year more than half of the 50 new trains had been received by NSB.
On the 9th of December a new timetable was introduced, with an increased no. of train departures for both regional and local trains.
In 2012 Nettbuss acquired the shares in the bus operations of Fjord1.
Oslo S Utvikling AS, of which the NSB real estate operations own 33 %, sold the DnB head- office buildings in Bjørvika, Oslo, for 4 800 MNOK.
Profit development
Profit before tax is 853MNOK (81 MNOK). The operating result is 1 192 MNOK (312 MNOK). The change is mainly due to:
Improved results in the real estate operations due to sale of development property
Improved profit in the passenger train operations, mainly due to increased no. of passengers, increased public purchase of train services and reduced deviation and energy costs
Reduced operating result in the bus operations mainly due to impairment of goodwill and buses
Improved operating result in the freight operations mainly due to restructuring in Sweden and improved efficiency in Norway
Unrealised fair value changes on interest rate swaps of – 112 MNOK ( - 220 MNOK) Net financial income is – 328 MNOK (- 342 MNOK).
As of 1st of January 2012 the NSB-Group changed its principle for the measurement of investment property from historic costs to real value as this is considered to give better and more relevant information for the users of the financial accounts.
The NSB-Group changed on the 1st of January 2012 the reporting of actuarial gains and losses from the corridor method according to IAS 19 to immediate recognition of actuarial gains and losses over the profit and loss
statement. The accounts for 2011 have been recalculated for comparison purposes. For further information see the principle notes and note 20.
Pension costs related to defined benefit plans are apportioned linearly over the time of employment and the liability is shown in the balance sheet as the present value of future payments. The main method for the present value calculation is to use the market based interest of corporate bonds of high rating. The best estimate has up to now
ANNUAL REPORT 2012
been to use government bonds as a basis for determining the discount rate. In 2012 the best estimate is that Norwegian bonds (OMF) have both a deep market and a rating which will be a good basis for determining the discount rate. The effect is that the present value of pension liability is considerably reduced, and the consequence is shown in equity due to the positive effect on actuarial gains.
Summary of results and development for the business operations Passenger train operations
The passenger train operations consist of NSB AS and the subsidiaries NSB Gjøvikbanen AS and Svenska Tågkompaniet AB.
Operating income for passenger train operations was 5 849 MNOK (5 380 MNOK), an increase of 8,7 % compared to the previous year. A significant part of the change is due to an increase in passengers and public purchase of passenger train services. The number of passenger kilometres in the Norwegian market increased by 3,8 % to 2 827 million, while the number of journeys increased by 2,6 % to 53,8 million. The growth increased during the second half of the year.
The operating profit at 373 MNOK (- 2 MNOK), was improved by 375 MNOK. The improvement is mainly due to increased income and reduced cost related to energy and deviations.
A new timetable with significant changes and increased route offer was introduced the 9th of December. The main change was an increased route offer in the eastern part of Norway. Minor changes and improvements will be implemented as an effect of experience and the delivery of new trains. The next major change in timetable with a further increase of the route offer will take place in December 2014. The delivery of the new regional and local trains is going according to plan. 23 regional trains (type 74) and 7 local trains (type 75) were introduced on lines in eastern Norway by the end of the year. The new train sets have been well received by the customers but the seat width on the regional trains has been criticised by the commuter interest organisations. NSB has decided to replace some of the seats. All of the 50 new trains will be delivered by the end of 2014. 16 additional new trains will be ordered.
Bus operations
The bus operations consist of 35 companies, including the parent company Nettbuss AS, and operate in Norway, Sweden and Denmark.
The operating result is - 13 MNOK (103 MNOK). The Nettbuss Group’s operating income for 2012 is 5 598 MNOK (4 864 MNOK), an increase of 15 % from the previous year. The increase in operating income is mainly due to acquisitions and new regional contracts, while the reduction in profit is primarily due to impairment of buses and goodwill.
The bus operations bought 100 % of the shares in the Fjord1 bus operations in 2012. This strengthens the operations in the western part of Norway and the express-bus segment.
The bus operations transported 133 (126) million passengers, an increase of 5.6 % from 2011. The express bus TIMEkspressen transported 3.9 million passengers, compared to 4.6 million in 2011.
The bus operations took part in several tenders in 2012, and started to drive new routes in Hamar and Bergen. New routes were also started in Denmark. The bus operations lost the tender for bus routes in Trøndelag, but won already operated tenders in Østfold and Kongsberg/Vikersund. Netbuss will also start bus routes in Lund in Sweden and in Oslo in 2013. The bus operations have contracts in several regions which so far have not been put out for tender. This includes contracts in Hedmark, Buskerud, Aust-Agder, Sogn og Fjordane and Møre og Romsdal. Over the next few years the major part of this traffic will be put out for tender. In 2013 this includes the Netbuss contracts in Drammen, Kristiansund, school bus routes in Trøndelag, Nordfjord and
Nord-Gudbrandsdalen.
Freight operations
The profit improvement in 2012 is mainly due to the restructuring of the Swedish operations planned in 2011, and carried through in 2012. Cost reductions have been carried through in the Norwegian part of the operations, and maintenance services have been outsourced to the NSB train maintenance operations.
Operating income is 1 094 MNOK (1 452 MNOK), and the operating result is -70 MNOK (-202 MNOK). Income is reduced and operating result is improved mainly due to restructuring of the operations in Sweden.
ANNUAL REPORT 2012
The freight transport market has been stable, but competition is increasing, especially from foreign operated trucks. The freight operations has therefore adjusted capacity on several lines, and closed the offer on the line between Oslo and Malmø, Sweden, from December 2012.
Punctuality has improved after a rough start due to winter problems on the Oslo-Narvik line and closure of the Dovre line in March/April. Punctuality in Norway ended up at 91 %. The no. of cancelled departures due to unforeseen closure of infrastructure was 369.
Train maintenance
Train maintenanceis operated by Mantena AS which was established in 2002 continuing the maintenance activities of NSB. The train maintenance operations maintain the trains of NSB AS, Flytoget AS, Gjøvikbanen AS and CargoNet AS in Norway.
Mantena operates in Sweden through the subsidiary Mantena AB which has workshop and main office in Helsingborg, and maintains trains for Skånetrafiken. The Swedish operations also maintain trains on contract for Østergøtapendelen and Norrtåg in Umeå.
Mantena AS owns 50 % of TBT AB which maintains the trains used for the Stockholm Underground. This contract runs until 2017 with an option for extension of 6 years.
The operating income is 1 498 MNOK (1 525 MNOK). The operating profit is 30 MNOK (18 MNOK).
Real estate
The group strategy for the real estate operations is to optimize the development of the value of the real estate assets with a view to sale of non-operational property according to market opportunities and the Group financing needs. In addition the real estate operations shall develop and manage the real estate properties to strengthen the transport business of the NSB-Group.
The development of efficient and environment friendly traffic hubs has had priority for a number of years, and this work will continue. One of the goals of the climate and environment strategy is to reduce energy consumption and CO2 by 20 % before the end of 2015 and the use of water reduced by 5 %.The ambition is also that new buildings shall at least be within energy class A and BREEM-NOR Excellent.
The projects in the 33 % owned Oslo S Utvikling AS have been successful. The sale of flats in the 50 % owned companies Grefsen Utvikling AS and Jessheim Byutvikling AS has been good. Both these projects will continue for a number of years.
The real estate operations comprise a rental area of approx. 730.000 square meters, property development potential of about 2 million square meters, and achieved an operating profit of 877 MNOK (387 MNOK). The change is mainly due to increased sale of development projects.
Supportfunctions
The support functions are separated into limited liability companies. NSB Trafikkservice AS supplies the cleaning services on the trains. Arrive AS supplies IT-services for the Group. Finse Forsikring AS works on the NSB-Group’s risk handling, through limiting the economic effect when accidents occur, as well as minimizing the Group’s risk expenses.
The operating result for the support functions is - 5MNOK (8 MNOK).
Corporate governance Ownership
The NSB-Group is one of Norway´s largest transportation groups. The parent company NSB AS is owned by the State of Norway, represented by the Ministry of Transport and Communications. The Group´s headquarters is in Oslo, while operations are spread throughout most of Norway, and in certain parts of Sweden and Denmark.
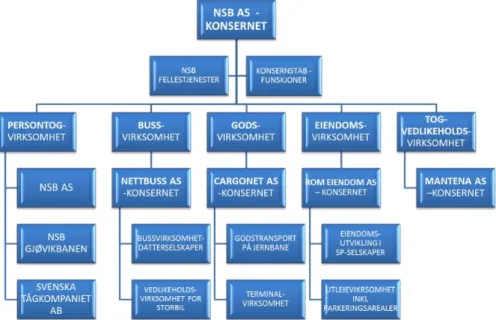
Organisation
The Group is divided into several areas of operations:
Passenger train operations consist of NSB AS and the subsidiaries NSB Gjøvikbanen AS and Svenska Tågkompaniet AB
The bus operations consist of the activities in the Nettbuss-Group
The freight train operations consist of the activities in the CargoNet-Group
Train maintenance operated by the Mantena-Group
ANNUAL REPORT 2012
Goals and strategies
The NSB-Group main goal is to create value for the owner and the community through efficient, available, safe and environment efficient transport of passengers and goods.
The NSB-Group shall
avoid injuries to people and damage to the environment
be the leading land-based transport company in the Nordic region
generate profits
have satisfied customers
have highly qualified and motivated employees
maintain financial freedom of action
Internal control
The NSB-Group follows the Norwegian recommendation of corporate governance with adaptation to the ownership structure, and has adopted guidelines for corporate governance. These are enclosed in the annual report and available on the NSB homepage.
In addition governance is based on the government principles for good ownership. In the articles of association the company social mission is specifically described as to provide efficient, available, secure and environment friendly passenger and freight transport.
The NSB-Group has established a control-environment that consists of values, ethical guidelines, organisational structure, authorisation structure and steering documents. The Board of Directors evaluates the Group’s business idea, values, strategies and plans on an annual basis. Risk analysis is performed annually for the business as a whole as well as for the various operations. Risk within financial reporting is evaluated through risk analysis of specific areas and periodic follow-up meetings with the business segments.
Based on the above the internal control system is periodically revised, by changes and improvements in the steering documents, guidelines and procedures
Economic development for the NSB Group and the parent company NSB AS
The NSB-Group has a profit after tax for 2012 of 729 MNOK (26 MNOK), an improvement of 703 MNOK. The operating profit is 192 MNOK (312 MNOK), a reduction of 880 MNOK. The improvement is mainly due to sale of development property and improved operations in the passenger operations.
The parent company NSB AS shows a profit after tax for the year of - 10 MNOK (- 60 MNOK). Group contributions from subsidiaries in the amount of 0 MNOK (213 MNOK) are included in the result. Operating profit for the parent company is 363 MNOK (51 MNOK). The change is mainly due to increased public purchase of passenger train services, increased number of travels and reduced deviation and energy costs.
The Group net cash flow from operations is 2159 MNOK (836 MNOK). The difference from operating profit consists mainly of depreciation and impairment of 1 419 MNOK, difference in cost and cash effect of pension costs, and changes in the working capital. Net cash flow used for investments is 3 255 MNOK (1 261 MNOK). This includes 3 271 MNOK in acquisition of property, plant and equipment as well as investment property. Dividend was not paid to the owner in 2012. Investments were mainly used to increase capacity and profitability within the Group’s business segments.
Including this year’s profit, owner’s equity for the parent company is 5 832 MNOK (5 620 MNOK). The equity ratio is 32 % (35 %). Distributable equity for the parent company before dividends for this year is 296 MNOK. For the NSB-Group, owner’s equity is 7 302 MNOK (6 006 MNOK), an equity ratio of 3 % (27 %).
The Group return on equity is 11.4 % (0.4 %). The Group current liabilities are 4 545 MNOK.
The Board proposes the following allocation of the result of the parent company NSB AS:
Dividend 176 MNOK
Allocated to retained earnings 36 MNOK
Sum allocated 212 MNOK
ANNUAL REPORT 2012
Risk
Financial risk
The Group activities expose the Group to a variety of financial risks: market risk (including currency exchange risk, interest rate risk and other price risk), credit risk and liquidity risk. The Group overall risk management programme focuses on the unpredictability of financial markets and seeks to minimise potential adverse effects on the Group financial performance. The Group utilizes derivative financial instruments to reduce some of the risk exposures. The NSB-Group financial risk management is described in note 29.
NSB borrows money in the markets and the currency that offers the most favourable terms. Borrowings in foreign currencies are converted to Norwegian currency through currency swap agreements. NSB has a goal of minimising currency risk in its financial management. NSB has exposure to currency risks in its daily operations to a minimal degree, due to the fact that its income and expenses primarily occur in NOK. If there is an agreement for a considerable purchase in foreign currency, the currency risk is covered at almost 100 % during the course of the agreement.
NSB is exposed to changes in the interest rate level. The parent company uses financial instruments to reduce interest rate risk and to achieve its desired interest rate structure. Guidelines have been established, regulating what portion of total outstanding debt that is to be subjected to interest rate fixing during a 12 month period, and for the duration of the loan portfolio.
Surplus liquidity is invested in short-term Norwegian bonds and commercial papers. Changes in interest rate can affect the value of the portfolio, the papers are however normally held until maturity. Limits for exposure towards certain sectors and institutions are established based on credit evaluations.
The current guidelines state that the loans which mature during the next twelve months should be covered through excess liquidity and committed credit facilities. The NSB-Group has a goal of having a free liquidity of at least 500 MNOK.
NSB has covered its borrowing needs for 2012 satisfactorily through a loan at the beginning of the year. There is still unrest in the financial markets, and there is uncertainty related to what margins will be achieved in the future. NSB has a high focus on financial risks and how to minimize these.
Operational risk
Analysis of operational risks is done systematically, for example for traffic safety and the achievement of financial goals. Based on the risk analysis, control activities reduce identified risks, including automatic controls, audits and analysis related to special risk areas. The status for internal control is annually monitored through internal audit reports and continuing analysis of financial performance.
Social responsibility Owner expectations
The Ministry of Transport and Communication has in the articles of association clarified that the board shall ensure that the company is socially responsible. The company shall annually report on this to the owner through the annual planning document (§ -10-plan). The social responsibility expectations are based on national and international conventions, guidelines and norms, with a special focus on human rights, environment/climate, and the work against corruption.
Ethics and social responsibility
The board of the NSB-Group has adopted guidelines for company ethics and social responsibility which are implemented in the business operations and published on the NSB homepage. The group status and efforts regarding social responsibility is published in an annual report.
Punctuality
Passenger train punctuality was 89.7 % in 2012. This is an improvement of more than two percentage points compared to 2011, and marginally below the goal of 90 %.
The National Rail Administration registered 18 247 delay hours in 2012 compared to 26 913 in 2011, a reduction of 32 %. The no. of delay hours includes delays caused by infrastructure, NSB and external causes. NSB passenger train carries the responsibility for a total no. of delay hours in Norway of 10 214 (16 177), which is 56 % of the total no. of delay hours for the year. This is a decrease in the no. of delay hours of 37 %.
ANNUAL REPORT 2012
The infrastructure is still the cause of the highest part of delay hours for the passenger train operations with 4 248 hours (42 %), followed by the passenger train operations with 2 811 hours (28 %). The delay hours caused by the passenger train operations is due to station delays of 1 378 hours (49 %) and rolling stock faults by 891 hours (32 %). Delay caused by rolling stock was reduced by 12 % and station delays by 50 % compared to 2011.
The passenger operation works continually to modify the rolling stock as well as maintenance programs, and at the same time renewing the passenger train pool. This as well as introducing a more robust timetable and efforts to reduce station delays contributes to improvement in punctuality.
Jernbaneverket (The Norwegian National Rail Administration) has introduced measures to improve punctuality, including measures on the line between Skøyen and Bryn in Oslo during 2012.
Punctuality for NSB Gjøvikbanen AS in Norway was 92 % (88 %), and for the Swedish subsidiary Svenska Tågkompaniet AB 91.5 % (88 %).
Traffic safety
No passengers or employees perished due to the transport activities of the NSB-Group in 2012.
In the passenger train operations two persons perished after collisions on the rail track. One of these accidents is still under investigation. In the other accident the police have closed the case without conclusion. These will therefore according to the Norwegian Railway Authority definition be classified as railway accidents. In addition one serious accident occurred during 2012. On the 15th of February a new regional train type 74 derailed during a test drive at Nykirke on the Vestfold line. Three NSB employees and two employees from contractors were injured, of which two stayed in hospital more than 24 hours. Both train and the infrastructure were extensively damaged. The accident has been investigated internally and by Statens Havarikommisjon (Accident Investigation Board Norway) and measures have been identified and put in action.
No persons perished and no serious accidents occurred in the freight operations in 2012.
In the bus operations there were two fatal accidents during 2012. In both accidents passenger cars crashed with the bus, and Nettbuss was found not guilty in both cases.
Work environment and equal rights
A safe and good work environment is a prerequisite for motivated employees, and also to ensure that the NSB-Group reaches its goals. Satisfactory work environment is also important for successful traffic accident work. The work environment measures shall prevent accidents, and risk assessment is an important part of this work. Measures shall be based on hard facts, and key performance indicators for this area are employee absence and injuries, no. of potential accidents, and employee satisfaction.
Absence due to illness for the Group is 7.8 % (8 %). Absence has increased somewhat in the passenger train, freight and train maintenance operations, while absence in the bus operations is stable. Absence was reduced in the real estate operations.
Most companies in the Group are IA-companies (inclusive labour market). As an IA-company, NSB primarily works to reduce absence due to illness.
NSB works to ensure equal rights among employees and especially focus on this during recruitment, advancement and job related training/schooling. NSB wants to emphasize diversity which reflects a cross section of the
Norwegian society.
The share of female employees in NSB AS is about 29 %, the same level as in 2011. The share of females in leadership positions in the NSB-Group´s companies and different business segments vary. The shareholder elected board members in NSB AS have a share of 40 % of females, and the Chairman of the Board is a female. The Group Management Board are all men. The share of females in the passenger train operations leadership group is 33 %.
The female share of recruitment in NSB AS was reduced from 50 % in 2010 to 48 % in 2012. The average salary has for a no. of years increased more for women than men, but the relative salary increase has been marginally lower for woman than men the last two years. The average remunerations for women in the parent company NSB AS is 86 % of that for men, and average working hours 1,7 hours less than for men. The share of women with low salaries decreased by 0.6 % to 63 %, while the share of women with high salaries is stable at 23 %. The share of employees in NSB AS with an immigrant background is 7.6 % (6.9).
ANNUAL REPORT 2012
External environment
NSB’s major contribution to reduction of greenhouse gas emissions is to increase public transport on rail and bus as well as the volume of goods transported by rail. The NSB-Group also works to increase the relative importance and level of public transport by development of property at and near public transport hubs.
NSB has presented the document “Oftere, raskere og mer miljøvennlig” as its contribution to the National Transport Plan 2014-2023. In this document NSB shows how the train transport together with other public transport will be able to meet the growth in transport need due to the expected growth in the population by 20 % up to 2028. This requires investment in infrastructure and new trains. The gain will be increased mobility through higher route frequency, reduced travel time, increased capacity and punctuality.
An important part of the group work to reduce its environmental footprint is to increase the level of public transport. This is reflected in the group strategic environment plan. The main part of the energy for passenger and freight traffic on rail is supplied by green electricity.
Customer satisfaction
Customer satisfaction increased by one percentage point to 69 for the passenger operations compared to the autumn 2011 survey. A score under 60 is weak, while over 70 is good. Punctuality is the most important factor which affects customer satisfaction, and the surveys show that our customers experienced an improvement in this area compared to 2011. The local trains in the Oslo region have the lowest satisfaction level. Due to
improvements in infrastructure, timetable and passenger trains, we expect improvement in this area in 2013. The survey shows that the most important improvement areas are:
Punctuality
Bus transport during deviations
Information during deviations
The route offer
The NSB reputations survey confirms that the NSB-Group has improved its reputation in the populace as a whole. The customer survey for 2012 shows, that the customers are well satisfied with the quality of the express bus routes. The average for all express bus routes increased to 83 (82).
Future challenges
The economic activity in Norway is high, unemployment rate is low, and state finances are good. There is still uncertainty regarding market development. The debt and finance unrest in Europe and USA can affect the demand for Norwegian export goods, reduce supply in the loan market and increase the cost of debt. The unrest may also influence the markets in Sweden and Denmark where we are established both within passenger train, bus and train maintenance operations.
According to Statistics the population in Norway will increase by 20 % up to 2028. Most of this growth will occur around and in the larger cities. Up towards 2040 the population growth in the larger city areas in Southern-Norway is expected to be 40 % from the present level. The growth is highest in the areas where the transport systems already experience capacity problems.
Even if the road system is expanded, roads will only be able to absorb a limited part of the growth in transport needs. Most of the growth has to be solved by public transport – i.e. rail and bus transport. This is a challenging future with possibilities for the NSB-Group.
To facilitate public transport growth, investment in quality and capacity improvement for the infrastructure is necessary, as well as an improved route offer and development of offices and dwellings on and around public transport hubs.
The NSB-Group will through its train, bus and real estate operations develop solutions to meet the future demand for efficient, safe and environmental transport. These possibilities are described in the NSB input to the National Transport Plan which will be debated in the parliament in 2013.
NSB is already redesigning and expanding the railway route offer, which will considerably increase the capacity in Eastern Norway. With the timetable change in December 2012 the first part of the new offer was introduced, and the rest will be introduced at December 2014. At the same time NSB invests in new trains, and 50 new regional and local trains will be in service by the end of 2014. The capacity in seat kilometres will grow by 21 %. If the infrastructure is improved as described in the NSB input to the National Transport Plan, the NSB-Group will start an investment programme of up to 150 new trains during the next 10 year period.
ANNUAL REPORT 2012
All passenger wagons on the long regional train lines will be upgraded by the end of 2013, while the passenger train sets type 73 will be upgraded during 2013 and 2014.
The real estate operations develop projects near public transport hubs. The development in and around Oslo Central Station continues, with the development of Bjørvika and two headquarter buildings in Schweigaaardsgate. At Grefsen in Oslo and at Jessheim a considerable number of flats are being built together in cooperation with local real estate companies. Large projects are being planned or are under development in Drammen,
Fredrikstad, Kristiansand, Sandnes, Bergen and Trondheim as well as public transport hubs at Gjøvik and Hamar. NSB will develop the bus operations to be able to meet the expected growth in demand for public transport. Nettbuss is a major supplier of local route and bus services to Norwegian cities and local communities in Oslo, Akershus, Hedmark, Oppland, Buskerud, Telemark, Aust-Agder, Rogaland, Møre og Romsdal, and Sør og Nord Trøndelag. Nettbuss also operates a network of express buses in Scandinavia, for example the popular
TIMEkspressen, Bus4You, and GoByBus. The express bus offer will grow in 2013, through among others improved express route offers in Østfold, Bergen and Sandnes.
The NSB-Group works actively to improve the profitability of the freight operations through closing down unprofitable parts of the operations, reduce costs and increase volumes. A stable infrastructure is a prerequisite to secure customers a trustworthy and punctual delivery.
NSB wishes to take part in the expected traffic growth through public transport, and help to achieve growth in transport of goods on rail. This necessitates increased investment in infrastructure, public transport hubs as well as development of rail terminals. The gain for society will be good and environment friendly mobility through higher route frequency, shorter travel time, increased capacity and good punctuality.
2012 has in general been a good year for the NSB-Group. The Board would like to thank the NSB-Group´s employees for their efforts in 2012, and looks forward to common efforts to develop the NSB-Group according to the present challenges and possibilities.
ANNUAL REPORT 2012
Income statement
Restated
All figures in MNOK Notes 2012 2011 2011
Operating revenue 5 13 780 12 328 12 328
Operating expenses
Payroll and related expenses 24 6 510 6 008 6 075
Depreciation and impairment 25 1 419 1 254 1 286
Other operating expenses 26 4 659 4 754 4 760
Total operating expenses 12 588 12 016 12 121
Operating profit 1 192 312 207
Share of (loss)/profit in associates 9 31 5 5
Unreal. Value change inv. property 8 -42 106 0
Profit before financial item s 1 181 423 212
Financial item s
Financial income 27 657 806 496
Financial expenses 27 873 928 618
Unrealised fair value changes 27 -112 -220 -220
Net financial item s -328 -342 -342
Profit before incom e tax 853 81 -130
Income tax expense 19 124 55 -4
Profit for the year 729 26 -126
Attributable to
Non-controlling interest 25 8
Equity holders 729 1 -134
Total 729 26 -126
Other com prehensive incom e
Profit for the year 729 26 -126
Deviation retirement benefit obligations 20 751 -1 256
Change in value of reclassification of
investment property 8 80
Tax on items in comprehensive income 19 -270 352
Currency translation differences -8 -8
Total com prehensive incom e for the year 1 290 -886 -134
Attributable to
Non-controlling interest -18 6 8
Equity holders 1 308 -892 -142
ANNUAL REPORT 2012
Balance sheet
Restated Restated
All figures in MNOK Notes 2012 2011 2011 2010 2010
ASSETS
NON-CURRENT ASSETS
Intangible assests 6 92 154 154 226 226
Property, plant and equipment 7 13 848 11 404 11 636 11 690 11 690
Investment property 8 3 351 3 021 854 2 663 872
Investments in associates 9 91 61 61 65 65
Financial assets 67 67 67 89 89
Total non-current assets 17 449 14 707 12 772 14 733 12 942
CURRENT ASSETS
Inventories and development property 10 2 426 3 010 3 010 1 853 1 853
Trade and other receivables 12 1 756 1 596 1 596 1 517 1 517
Derivative financial assets 13 867 1 060 1 060 629 629
Financial assets 14 369 355 355 701 701
Cash and bank deposits 16 1 184 1 208 1 208 1 779 1 779
Total current assets 6 602 7 229 7 229 6 479 6 479
Total assets 24 051 21 936 20 001 21 212 19 421
EQUITY AND LIABILITIES EQUITY
Ordinary shares and share premium 17 5 536 5 536 5 536 5 536 5 536
Retained earning 324 -925 962 209 1 242
Total 5 860 4 611 6 498 5 745 6 778
Non-realised gains - revalued inv. Property 1 449 1 393 0 1 290 0
Non-controlling interests -7 2 4 18 18
Total equity 7 302 6 006 6 502 7 053 6 796
LIABILITIES Long term liabilites
Borrow ings 18 8 763 7 921 7 921 5 690 5 690
Deferred income tax liabilities 19 703 287 480 611 511
Retirement benefit obligations 20 2 543 3 512 888 2 389 954
Provisions for other liabilities and charges 21 195 250 250 293 293
Total long term liabilities 12 204 11 970 9 539 8 983 7 448
Short term liabilites
Trade and other payables 22 3 741 3 509 3 509 3 172 3 172
Tax payable 19 4 1 1 1 1
Borrow ings 18 402 173 173 1 913 1 913
Derivative financial instruments 13 398 277 277 91 91
Total short term liabilities 4 545 3 960 3 960 5 177 5 177
Total liabilities 16 749 15 930 13 499 14 160 12 625
ANNUAL REPORT 2012
Cash flow statement for the Group
Restated
All figures in MNOK Notes 2012 2011 2011
853 81 -130
Deprec. And imparm. Of non-current and intangible assets 25 1 419 1 254 1 286 Gain/losses on disposal of property, plant and equipment -87 -321 -321 Differences in pension cost through profit and loss and 20
payment/disbursement of the defined contribution plan -234 -134 -67
Net changes to other accruals 21 -54 -49 -43
Net unrealised fair value changes to financial instruments 27 112 220 220
Unreal. Fair value change inv. property 42 -106 0
Interest items (see below ) 27 68 -1 -1
Share of profit/loss (-) from associates 9 -29 -5 -5
Changes to w orking capital (see below ) 69 -43 -43
Taxes paid -60 -60
Net cash flow from operations 2 159 836 836
Acquisition/sale of subsidiaries less cash acquired 32 -192 -22 -22
Additions/disposals of investments in associates 9 -4 22 22
Loans paid to/from single purp. Comp. Joint ventures -6 0 0
Purchase of property, plant and equipm. (PPE) and investm. property 7,8 -3 271 -1 511 -1 511
Proceeds from sale of PPE 205 240 240
Dividends received 27 13 10 10
Net cash flow from investm ent activities -3 255 -1 261 -1 261
Proceeds from borrow ings 1 587 2 143 2 143
Repayment of borrow ings -495 -2 136 -2 136
Dividends paid to company's shareholder 17 -147 -147
Dividends paid to non-controlling interests -1 -1
Net cash flow from financing activities 1 092 -141 -141
Net change in cash and bank deposits -4 -566 -566
Cash and bank deposits as at 1st of January
16 1 208 1 779 1 779
Foreign exchange gain/loss on cash and bank deposits -20 -5 -5
Cash and bank deposits as at 31st of Decem ber
16 1 184 1 208 1 208
Specification of changes to working capital 2012 2011 2011
Change in developmental property 110 -1 164 -1 164
Change in inventories 10 7 7
Sale of developmental property 480 480
Changes to trade receivables and other receivables -41 -79 -79
Changes to financial assets 11 343 343
Changes to trade and other receivables -11 370 370
69 -43 -43
Specification of interest item s 2012 2011 2011
Interest included in the income statement 27 211 122 122
Interest paid -808 -504 -504
Interest received 665 381 381
Interest item s 68 -1 -1
Changes in w orking capital Profit for the year before tax
ANNUAL REPORT 2012
Development in NSB-Group equity
2012 Notes Ordinary shares and share Restr. equity-investm . Acc. currency translations Retained earnings Non-controlling interest TOTAL Equity 1st of January 2012 17 5 536 1 393 -18 -907 2 6 006
Profit for the year -30 759 729
Acquisition of non-controlling interest -3 9 6
Other comprehensive income 86 493 -18 561
Equity 31st of Decem ber 2012 17 5 536 1 449 -18 342 -7 7 302
2011 Restated Notes Ordinary shares and share Restr. equity-investm . Acc. currency translations Retained earnings Non-controlling interest TOTAL Equity 1st of January 2011 17 5 536 1 290 -10 219 18 7 053
Profit for the year 103 -102 26 27
Acquisition of non-controlling interest 9 -22 -13
Other comprehensive income -8 -885 -20 -913
Dividends paid -147 -147
Equity 31st of Decem ber 2011 17 5 536 1 393 -18 -907 2 6 006
2011 Notes Ordinary shares and share Acc. currency translations Retained earnings Non-controlling interest TOTAL Equity 1st of January 2011 17 5 536 -10 1 252 18 6 796
Profit for the year -134 8 -126
Acquisition of non-controlling interest 9 -22 -13
Other comprehensive income -8 -8
Dividends paid -147 -147
NOTES 2012
NOTES TO THE CONSOLIDATED FINANCIAL STATEMENTS 2012
All figures in the report are in MNOK.
1. Principle notes
1.1 General information
1.2 Summary of significant accounting principles 1.3 Critical accounting estimates and judgments
2. Shares in subsidiaries
3. Group and company structure
4. NSB-Group’s passenger operations in the Nordic Region
5. Segment information
6. Intangible assets
7. Property, plant and equipment
8. Investment property
9. Investments in associates
10. Inventory and developmental property
11. Assets held for sale
12. Trade and other receivables
13. Derivatives
14. Other financial assets at fair value through profit and loss
15. Financial instruments by category
16. Cash and bank deposits
17. Share capital and share premium
18. Borrowings
19. Deferred income tax/Income tax expense
20. Retirement benefit obligations and similar obligations
21. Provisions for other liabilities and charges
22. Trade and other payables
23. Contract losses
24. Payroll and related expenses
25. Depreciation, amortization and impairment
26. Other expenses
27. Financial income and expenses
28. Leases
29. Financial risk management
30. Related party transactions
31. Contingencies
32. Business combinations
33. Joint ventures
34. Events after the balance sheet date
The consolidated financial statements were approved by the Board of Directors on 14
thof February
2013.
NOTES 2012
1.
ACCOUNTING PRINCIPLES FOR THE NSB-GROUP
1-1.
General information
NSB AS (the company) and its subsidiaries (the Group) do business in the following areas:
Passenger transport operations by train and bus
Freight transportation by train
Real estate operations
Train maintenance
Support functions, such as, train cleaning, to insurance operations and administrative services. The NSB-Group has its main office in Oslo. All the shares are owned by the Norwegian Ministry of Transport and Communication.
1-2.
Summary of significant accounting policies
The most important accounting principles which have been used to produce the Group accounts have been described below. The same principles have been used consequently throughout all periods, as long as nothing else is stated.
1-2.1 Basis of preparation
The consolidated financial statements have been prepared in accordance with International Financial Reporting Standards (IFRS) and IFRIC interpretations as approved by the EU.
The consolidated financial statements have been prepared under the historical cost convention with the exception of Financial derivatives, certain financial assets and financial liabilities and investment property which are valued at fair value.
The preparation of financial statements in conformity with IFRS requires the use of certain critical accounting estimates. It also requires management to exercise its judgment in the process of applying the Company’s accounting policies. The areas involving a higher degree of judgment or complexity, or areas where assumptions and estimates are significant to the consolidated financial statements are disclosed in the notes.
The Group adopts the going concern basis in preparing its consolidated financial statements.
1-2.2 Significant changes of principles implemented as of 01.01.2012
Pensions
The Group has changed its accounting principles on how to account for actuarial deviations, from using the corridor method to a direct charge of actuarial deviations over other comprehensive income. This change is within the current IAS 19 to harmonize with adopted changes in the standard and is considered to give a more reliable and relevant information. According to adopted changes in IAS 19R, actuarial deviations are to be included on the balance sheet in its entirety and the corridor alternative is no longer permitted.
At the implementation date of 1st of January 2012, non-balance sheet actuarial deviations for the Group of 2.624 MNOK increased the pension obligation, offset to other equity and deferred tax. The restated comparative numbers results in an increased pension retirement obligation of 1.435 MNOK as at 1st of January 2011 as well as reduced payroll and related costs in 2011 of 67 MNOK through reversed amortized actuarial deviations combined with actuarial losses of 1.256 MNOK in comprehensive income as at 31stDecember 2012, all numbers are gross before income tax.
Starting 1st of January 2012 the financial elements of the pension costs are presented as financial items and not as part of pension cost in the operating result.
Investment property
Acquisition of investment property is to be measured at cost. At the subsequent measurement date, one can choose between the fair value method or the historical cost method. The Group has been using the historical cost method for subsequent measurements. Starting in 2012, the Group has changed this principle to the fair value method, since this is considered to give more reliable and relevant information for this type of property.
At the implementation date of 1st of January 2012, by measuring investment property at fair value, the additional value of
MNOK 1.936 increased book value to investment property; offsets are equity and deferred tax.
For a further description of the valuation as basis for estimated fair value, see a separate note for investment property towards the back of this report. There will also be a specification of the effects through restating comparative numbers including effects of reversing depreciation and fair value changes.
NOTES 2012
Overview of principle changes
As of the 1st of January 2012, the change in accounting principles will have a negative net effect of 496 MNOK on equity.
Restatement on comparative numbers for principle changes implemented 1
stof January 2012
According to IAS 8, it is required that comparative numbers for 2011 are restated as if the changed principles had been used as of 1st of January 2011.
Below is a further specification of restated equity as of 1st of January 2011 with comparison to restated income statement and
balance sheet per 1st of January 2012:
For a further specification per line item on the financial statement, we refer to the column for restated numbers that are presented with the ordinary statements at the beginning of this report.
Other than the changes in principles mentioned above, the Group has chosen not to adopt early any new or adopted standards or interpretations not yet effective or any other principle changes.
Restated equity 1st of January after effects of principle changes (M NOK) 2012 2011
Equity 1st of January before principle changes 6502 6796
Net reduction of equity 1st of January as a consequence of principle change of retirement benefit oblig. -1889 -1033
Net increased equity 1st of January as a consequence of change in principle of investment property 1393 1290
Restated equity 1st of January after principle changes 6006 7053
Equity 1st of January 2011 before principle changes 6796
Net equity effect of principle changes January 2011
Fair value investment property 1st of January 1290
Change in retirement benefit obligation on the balance sheet -1033 257 Other comprehensive income restated in the income statement 2011 -886 Other movements in equity in 2011
Acquisition of non-controlling interest -13
Dividends paid to shareholders in 2011 -148 -160
Equity restated for the accounts as of 31st of December 2011 6006
Equity movements 2011 with restated numbers as a consequence of principle changes (M NOK)
Principle changes results in the following changes to comparative numbers
Profits Restated
2011 2011 Changes
Payroll and related expenses -6 008 -6 075 67
Depreciation and impairment -1 254 -1 286 32
Other operating expenses -4 754 -4 760 6
Unreal. Value changes investment property 106 0 106
Tax -55 4 -59
Profit for the year 152
Total amended items in other comprehensive income -912 -8 -904
Total net amendments profit for the year -753
Profit for the year -134
Restated profit for the year 2011 -886
Balance sheet
Restated Changes Changes
2011 2011 Reclass. Equity effect
Property, plant and equipment 11 404 11 636 -232
Investment property 3 021 854 232 1 935
Retirement benefit obligations -3 512 -888 -2 624
Deferred tax -287 -480 193
NOTES 2012
1-2.3 Standards, changes and interpretations to existing standards not yet effective
and the Group has chosen not to adopt early
Other than the adopted changes in IAS 19 R that the Group essentially already have implemented within the current IAS 19 one has decided that interest expense and expected return on pension assets are replaced with net interest amount, which is calculated using the discount rate on net pension obligations (assets). Starting on 01.01.2013, the Group will adapt to this change, which results in the determined discount rate is to be used to calculate net return on pension assets. Based on the interest level at the end of 2012, this change will not result in significant changes in 2013.
In the spring of 2011, the IASB decided the new standard IFRS 11 Joint Arrangement which is approved by EU and will replace IAS 31 shares in joint ventures. The Group has considerable shares in single purpose companies that have joint control.
Based on the actual rights and obligations of the parties a concrete evaluation on all existing shares in single purpose companies has been made on whether it’s a joint arrangement and if the companies should be classified as a joint venture in accordance with IFRS 11. Based on business form and agreements it is most likely that it should be classified as a joint arrangement. This conclusion results in that the equity method is to be used as the transition to IFRS 11 is implemented
.
Implementing IFRS 11 will mean a transition from proportional consolidation to the equity method. Transition to the equity method will result in the share of joint ventures be classified as a net asset. Based on the Groups balance sheet as at 31st of December 2012, the change seems preliminary to result in a reduction of net assets and liabilities of approximately 895 MNOK. This will lead to an increase of 2 % to owner’s equity ratio. The effects on the income statement will be presented net on one line as gain/loss on joint ventures.
The Group has decided to adapt to the ability to choose within todays IAS 31 with transition to the equity method starting on 01.01.2013.
Changes outside IAS 19R and IFRS 11 has been considered to not have a significant effect on the Group. This is presented below.
IAS 1“Financial statement presentation” As part of IASB’s annual improvement project, some minor changes have occurred in IAS1. The changes result in requirement for entities to group items presented in “other comprehensive income” (OCI) per item, either in changes to equity or in the notes. Additionally, there is a requirement to allocate the elements in other comprehensive income in two groups that distinguishes between items that reverses in profit and loss and the items that doesn’t.
IFRS 9 “Financial instruments” was issued in November 2009 and 2010 and replaces the parts of IAS 39 that relate to the classification and measurements of financial instruments. IFRS 9 requires financial assets to be classified into two measurement categories: those measured as at fair value and those measured at amortized cost. For financial liabilities, the standard retains most of the IAS 39 requirements. The main change is that, in cases where the fair value option is taken for financial liabilities, the part of a fair value change due to an entity’s own credit risk is recorded in other
comprehensive income rather than the income statement. The Group will also consider the impact of the remaining phases of IFRS 9 when completed by the Board.
IFRS 10“Consolidated financial statements” builds on existing principles by identifying the concept of control as the determining factor in whether an entity should be included within the consolidated financial statements of the parent company. The standard provides additional guidance to assist in the determination of control where this is difficult to assess.
IFRS 12 “Disclosures of Interest in Other Entities” includes the disclosure requirements for all forms of interests in other entities, including joint arrangements, associates, special purpose entities and other off balance sheet entities.
IFRS 13 “Fair value measurements” provides a precise definition of fair value and a complete description on how fair value is to be measured in IFRS and defines which additional information is to be included when fair value is used. The standard gives guidance on how it should be applied where its use is already required or permitted by other standards.
The Group will adapt to changes within IFRS 9, IFRS 10, IFRS 11, IFRS 12 and IFRS 13 when the standards are implemented within EU.
There are no other IFRSs or IFRIC interpretations that are not yet effective that would be expected to have a material impact on the Group.
NOTES 2012
1-2.4 Consolidation
(a) Subsidiaries
Subsidiaries are all entities over which the Group has the power to govern the financial and operating policies generally accompanying a shareholding of more than one half of the voting rights. The existence and effect of potential voting rights that are currently exercisable or convertible are considered on the balance sheet date. Subsidiaries are fully consolidated. The Group uses the purchase method of accounting to account for acquisitions of subsidiaries. The consideration transferred for the acquisition of a subsidiary is the fair values of the assets transferred, the liabilities incurred and the equity interests issued by the Group. The consideration transferred includes the fair value of any asset or liability resulting from a contingent consideration arrangement. Acquisition-related costs are expensed as incurred. Identifiable assets acquired, and liabilities and contingent liabilities assumed in a business combination are measured initially at their fair values at the acquisition date. On an acquisition-by-acquisition basis, the group recognises any non-controlling interest in the acquired company either at fair value or at the non-controlling interest’s proportionate share of the acquirer’s net assets.
The excess of the consideration transferred, the amount of any non-controlling interest in the acquired company and the acquisition-date fair value of any previous equity interest in the company acquired over the fair value of the Group’s share of the identifiable net assets of acquired is recorded as goodwill. If this is less than the fair value of the net assets of the subsidiary acquired, the difference is recognised directly in the income statement.
Intra-company transactions, balances and unrealised gains and losses on transactions between Group companies are eliminated. Subsidiaries’ accounting policies have been changed where necessary to ensure consistency with the policies adopted by the Group.
(b) Transactions and non-controlling interests
The Group treats transactions with non-controlling interests as transactions with equity owners of the Group. For purchases from non-controlling interests, the difference between any consideration paid and the relevant share acquired of the carrying value of net assets of the subsidiary is recorded in equity. Gains or losses on disposals to non-controlling interests are also recorded in equity.
When the Group ceases to have control or significant influence, any retained interest in the entity is re-measured to its fair value, with the change in carrying amount recognized in profit or loss. The fair value is the initial carrying amount for the purposes of subsequently accounting for the retained interest as an associate, joint venture or financial asset. In addition, any amounts previously recognized in other comprehensive income in respect of that entity are accounted for as if the Group had directly disposed of the related assets or liabilities. This may mean that amounts previously recognized in other
comprehensive income are reclassified to profit or loss.
(c) Joint venture
Associates are all entities where NSB exercises control in cooperation with other owners according to an agreement. The Group’s interests in jointly controlled entities are accounted for by proportionate consolidation. The Group combines its share of joint ventures’ individual income and expenses, assets and liabilities and cash flows on a line-by-line basis with similar items in the Group’s financial statements. The Group recognises the portion of gains and losses on the sale of assets by the Group to the joint venture that is attributable to the other ventures. The Group does not recognise its share of profits and losses from the joint venture that result from the Group’s purchase of assets from the joint venture until it resells the assets to an independent party. A loss on the transaction is recognised immediately if it provides evidence of a reduction in the net realisable value of current assets, or an impairment loss.
(d) Associates
Associates are all entities over which the Group has significant influence but not control, generally accompanying a
shareholding of between 20 % and 50 % of the voting rights. In subsidiaries where we own 50 %, but do not have control, the companies are included as an associate. Investments in associates are accounted for by the equity method of accounting and are initially recognised at cost and include goodwill. Identified additional value is depreciated over remaining useful life, while goodwill is tested for a possible write-down as a part of the investment (see note 1-2.7).
The Group’s share of its associates’ post-acquisition profits or losses is recognised in the income statement, and its share of post-acquisition movements in reserves is recognised in reserves. When the Group’s share of losses in an associate equals or exceeds its interest in the associate, including any other unsecured receivables, the Group does not recognise further losses, unless it has incurred obligations or made payments on behalf of the associate.
Unrealised gains on transactions between the Group and its associates are eliminated to the extent of the Group’s interest in the associates. Unrealised losses are also eliminated unless the transaction provides evidence of an impairment of the asset transferred. Associates’ accounts have been changed where necessary to ensure consistency with the policies adopted by the Group.
When the Group no longer has significant influence, remaining ownership interest is measured at fair value with changes charged to the income statement. Fair value will be equal to acquisition cost for the future accounting of this financial asset. Amounts related to these companies and that are included in other comprehensive income will be treated as if the assets and liabilities were disposed. This could result in items that are included in other comprehensive income are reclassified to profit for the year. By reducing the share of ownership in associated companies where the Group maintains significant influence, a proportional share of the amount is reclassified from other comprehensive income to profit for the year.