1 MEASUREMENT AND DECOMPOSITION OF SEASONAL DEMAND FOR TOURISM IN
NORWAY
NIGEL HALPERN
Associate Professor in Transport and Tourism Department of Economics, Informatics and Social Sciences Molde University College-Specialized University in Logistics
P.O. Box 2110, 6402 Molde, Norway Tel: +47 712 14 226, fax: +47 712 14 100
E-mail: nigel.halpern@himolde.no
Abstract
The tourism industry in Norway is characterised by strong fluctuations in demand, as it is highly seasonal. This creates a number of challenges such as those related to the recruitment of competent staff and the ability to develop a profitable industry. Combating seasonality and prolonging the tourism season is often viewed as being important for reducing the challenges associated with seasonal demand for tourism but in order to develop counter-seasonal
strategies, it is necessary to have an understanding of the seasonal concentration of demand for tourism and the relative marginal effect of different markets.
Using Gini coefficients, this study investigates the seasonal concentration of demand for tourism in Norway between 1999 and 2011. Seasonal concentration is investigated at both the national and regional level. Seasonal concentration of demand in 2011 is then decomposed at the national level according to nationality, accommodation, and main purpose of visit. The decomposition determines the relative marginal effect that different markets have on the seasonal concentration of demand for tourism.
The decomposition technique used in this study is based on three factors that measure the contribution of a particular market to overall seasonal concentration; the Gini coefficient of the market, the correlation between monthly demand for the market and overall monthly demand, and the annual share that the market has of overall demand. Market share is arguably the easiest of the three to change. Consequently, the decomposition technique could be used to identify and subsequently target markets that reduce seasonal concentration (i.e. via product development or advertising and promotional campaigns). The decomposition
technique could also be used to simulate possible outcomes of growing or contracting certain markets.
Keywords: seasonality, measurement, Gini coefficient, decomposition,
counter-seasonal strategy, Norway.
Themes: sustainability and competitiveness (cross-cutting horizontal theme),
2
1. Introduction
Tourism in Norway is characterised by strong fluctuations in demand that are a consequence of seasonal concentration. This results in a number of challenges for the Norwegian tourism industry including the ability to generate profits and attract and retain staff at all levels. Reducing seasonal concentration of demand for tourism is therefore a priority (e.g. see Norwegian Ministry of Trade and Industry 2005).
In order to develop counter-seasonal strategies, it is useful to have an understanding of the seasonal concentration of demand for tourism and the relative marginal effect of different markets. The former identifies patterns of seasonal concentration and can be used to measure any year-on-year changes. It can also be used to benchmark seasonal concentration in one geographical area against that of other areas. The latter provides opportunities to target markets that reduce (or at least minimise growth in) seasonal concentration.
This paper investigates the seasonal concentration of demand for tourism in Norway and the relative marginal effect of different markets. Section 2 provides background to the study. Section 3 outlines the methodological approach taken. Section 4 provides a summary of the main findings. Section 5 provides concluding remarks.
2. Background
Tourism is an important part of the Norwegian economy. In 2011, demand for tourism in Norway contributed 29 million commercial guest nights including at hotels and similar establishments, campsites, cabins and hostels. Over a quarter of those guest nights were foreign (Statistics Norway, 2012). Total expenditure by tourists in Norway was estimated to be 106 billion Norwegian Kroner in 2009 with almost 30 per cent of total expenditure by foreign tourists. The tourism industry employed 2.2 million full-time equivalents in 2009. The tourism industry’s total share of Norwegian GDP and employment was 3.3 per cent and 6.3 per cent respectively in 2009 (Statistics Norway, 2012) 1.
In its Soria Moria Declaration, the Norwegian Government states that national strategies will be developed within the five industries where Norway has expertise or a special advantage, and tourism is one of those five industries. One of the main tasks involved in the development of tourism in Norway is “to ensure that further growth is converted into increased value creation and greater profitability (Norwegian Ministry of Trade and Industry, 2005; p8)”. There are a number of challenges facing the Norwegian tourism industry that affect its ability to increase value creation and achieve greater profitability. One of the challenges is the seasonal concentration of demand for tourism in Norway.
”The industry is characterised by strong fluctuations in demand, as it is highly seasonal….. It is characterised by high labour turnover because of the strong seasonal fluctuations in employment. Attracting staff with the required competence at all levels is therefore a challenge for tourism enterprises. It is also a challenge to develop a profitable travel and tourism industry….. The development of year-round tourism may therefore be the correct strategy in certain cases for improving profitability (Ministry of Trade and Industry, 2005; p9)”
1
Due to a revision of the Norwegian national accounts, updated results for the tourism satellite accounts were not published for 2010 data, and have not yet been published for 2011.
3 Reducing seasonal concentration of demand for tourism is no easy matter because the causes are usually structural in nature and are therefore difficult to change. Based on a review of literature, Baum and Hagen (1999) identify a range of causes that can be classified into three main categories: natural (i.e. climate), institutional (i.e. holiday periods, calendar effects and social or business customs), and supply-side constraints (i.e. availability of labour,
accommodation and transport infrastructure). Baum and Hagen (1999) also identify the main types of initiatives that can be used to counter seasonal concentration:
Market diversification, which can be combined with segmentation strategies, price differentials and targeted advertising and promotional campaigns.
Product diversification, which could include the introduction of events and festivals.
Structural responses such as public sector initiatives to maintain services and access to facilities outside of the main season.
The work by Baum and Hagen (1999) is somewhat dated however, recent works on
seasonality still tend to use their work as a starting point and conduct empirical analysis on individual counter-seasonal strategies. For instance, Jang (2004) investigates market
segmentation solutions to seasonal tourism in Canada. Higham and Hinch (2002) investigate how changes to sport seasons can reduce seasonal sports tourism in New Zealand. Parrilla et al. (2007) investigates supply determinants of seasonality related to accommodation services on the Balearic Islands in Spain.
In order to develop counter-seasonal strategies, it is useful to have an understanding of the seasonal concentration of demand for tourism and the relative marginal effect of different markets. The former identifies patterns of seasonal concentration and can be used to measure any year-on-year changes. It can also be used to benchmark seasonal concentration in one geographical area against that of other areas. The latter provides opportunities to target markets that reduce (or at least minimise growth in) seasonal concentration.
This study investigates the seasonal concentration of demand for tourism in Norway between 1999 and 2011. Seasonal concentration is investigated at both the national and regional level. Seasonal concentration of demand in 2011 is then decomposed at the national level according to nationality, accommodation, and main purpose of visit. The decomposition determines the relative marginal effect that different markets have on the seasonal concentration of demand for tourism.
The decomposition technique used in this study is based on three factors that measure the contribution of a particular market to overall seasonal concentration; the Gini coefficient of the market, the correlation between monthly demand for the market and overall monthly demand, and the annual share that the market has of overall demand. Market share is arguably the easiest of the three to change. Consequently, the decomposition technique could be used to identify and subsequently target markets that reduce seasonal concentration (i.e. via product development or advertising and promotional campaigns). The decomposition
technique could also be used to simulate possible outcomes of growing or contracting certain markets.
The methodology and approach to empirical analysis in this study is not new. It has been used in a tourism context as a measure of seasonal concentration in previous studies including Fernández-Moralez (2003), Fernández-Moralez and Mayorga-Toledano (2008), and Nadal et
4 al. (2004). However, every region or country is characterised by unique patterns of
seasonality and it is important for studies to be region- or country-specific. In addition, previous studies have tended to focus on a narrow range of component markets. This study decomposes seasonal concentration of demand according to three main components; nationality, accommodation and main purpose of visit.
3. Methodology
The unit used to measure demand for tourism in Norway is the number of commercial guest nights including at hotels and similar establishments, campsites, cabins and hostels. Data on guest nights is available from Statistics Norway on a monthly basis from 1999 to 2011. Data is disaggregated according to three types of market; nationality, accommodation, and main purpose of visit. Nationality is disaggregated into domestic and international markets. The international market is further disaggregated by country and provides data for 41 individual countries worldwide. Accommodation is disaggregated into four markets; hotels and similar establishments, campsites, cabins, and hostels. Main purpose of visit is disaggregated into three markets; course and conference, business, and holiday and leisure. It must be noted that data on guest nights according to main purpose of visit is only available for hotels and similar establishments so the total number of guest nights is lower than it is for guest nights by nationality and accommodation.
Different methods can be used to measure the seasonal concentration of demand for tourism (e.g. see Lundtorp, 2001). Yacomis (1980) uses two methods; the coefficient of seasonal variation and the seasonality ratio. The coefficient of seasonal variation is equal to the standard deviation seasonal indices where the index (index = 100) is the average number of guest nights each month. The seasonality ratio measures the ratio between the maximum number of guest nights in a particular month versus the average number of monthly guest nights. These two methods have been criticised (e.g. see Wanhill and Yacomis, 1980) on the basis that they take no account of the skewness of distribution and are both influenced by extreme values. Instead, Wanhill and Yacomis (1980) recommends the use of the Gini coefficient.
The Gini coefficient is a measure of statistical dispersion that was first developed in 1912. The Gini coefficient was, and still is, commonly used in an economics context as a measure of income inequality in society (e.g. see OECD, 2008). It is commonly used in a tourism context as a measure of seasonal concentration (e.g. see Moralez, 2003;
Fernández-Moralez and Mayorga-Toledano, 2008; Nadal et al., 2004). There are different ways of calculating the Gini coefficient (e.g. see Xu, 2003) but a simple formula applied to tourism and used in this study is represented by formula 1.
. 1 0 1 1
N i i i i i Y X X Y G (1) X is the cumulative number of months in a year and Y is the cumulative number of guest nights in each month (both X and Y are in fractions). N is the number of observations. The Gini coefficient (G) will be a value of between 0 (perfect equality between months) and 1 (perfect inequality between months).
The benefits of the Gini coefficient are that unlike the seasonality ratio, it is less dependent on a maximum value and is therefore more sensitive to variations outside the peak season. It is
5 also less influenced by extreme values compared to the coefficient of seasonal variation and the seasonality ratio.
The Gini coefficient is used in this study to measure seasonal concentration of demand for tourism in Norway on an annual basis between 1999 and 2011 therefore providing an
understanding of the seasonal concentration of demand for tourism in Norway during the most recent year and how it has changed over time. The Gini coefficient is not additive so in order to investigate the relative marginal effect of different markets, it is necessary to decompose seasonal concentration. The decomposition in this study is carried out on demand for tourism in Norway in 2011.
The decomposition method used in this study was developed by Lerman and Yitzaki (1985) and has been used in a tourism context by Fernández-Moralez and Mayorga-Toledano (2008). The method has also been used by the author to carry out a decomposition of seasonal
passenger demand at airports in Spain (see Halpern, 2011). The decomposition measures the contribution that component markets have on seasonal concentration. For instance, guest nights can be decomposed by two markets; international (m¹) and domestic (m²) so in this case, m2. The nature of the decomposition is represented by formula 2.
m m m m mR S G G
1 (2) mG is the annual Gini coefficient of market m, Rm is the coefficient for the correlation between total monthly guest nights and monthly guest nights for market m, and Sm is the annual share that market m has of total annual guest nigths. The contribution that each market (Cm) has on seasonal concentration is therefore dependent on Gm, Rm and Sm (i.e.
m
C =GmxRm xSm). The contribution of each market can also be expressed in relative terms as the share of inequality of the market. This is represented by formula 3.
G S R G
Cm m m m/ (3)
The decomposition in formula 3 allows for the calculation of the relative marginal effect ( RME) that each market has on seasonal concentration where a proportional increment in a market (em) equally distributed throughout the year will reduce or enhance seasonal concentration in a proportion that is equal to:
/ 1 G G R S G e G RME m m m m m (4) m e G
/ is the partial derivative of Gwith respect to m
e , where G is a function on ( 1
m , …,
n
m ).
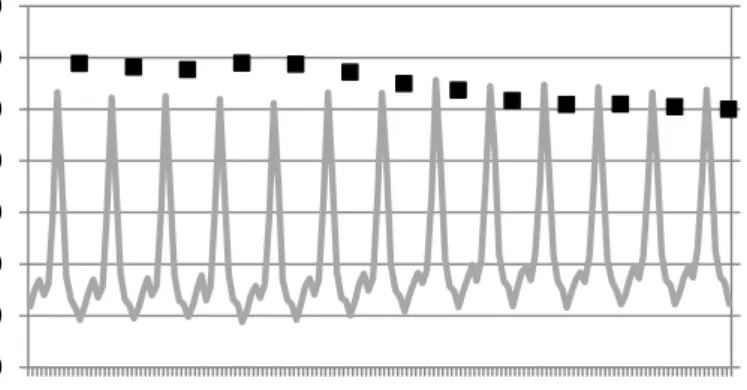
6 Demand for tourism in Norway is concentrated during the summer season between May and September (see figure 1). It peaks in July when it is typically 4.5 times greater than in December. Seasonal concentration has declined during 1999 to 2011 but only by a small amount. The Gini coefficient has declined from 0.29 in 1999 to 0.25 in 2011.
Figure 1. Monthly guest nights and annual Gini coefficient, 1999-2011.
Annual guest nights and the Gini coefficient for each county in Norway are provided in Table 1. The counties are listed according to the degree of seasonal concentration. The county of Vestfold had the highest degree of seasonal concentration in 2011 with a Gini coefficient of 0.47 while Oslo had the lowest with 0.13. There does not appear to be a link between seasonal concentration and volume of demand for tourism or regional dispersal of demand for tourism, which perhaps justifies the need to investigate seasonal concentration according to market characteristics.
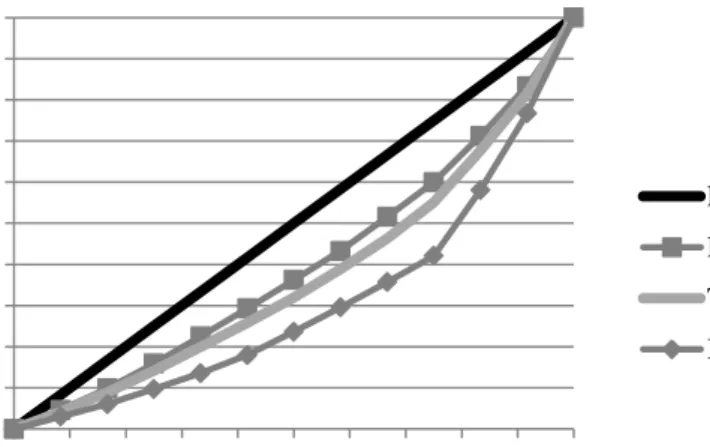
Norway has a Gini coefficient of 0.25 but the degree of seasonal concentration varies by market. Figures 2, 3 and 4 illustrate this using Lorenz curves for tourism demand in 2011 by nationality, accommodation and main purpose of travel. The greatest contributors to seasonal concentration are international tourists, tourists staying on campsites, and tourists visiting Norway for holiday and leisure purposes. The differences between markets are represented by their respective Gini coefficients that are provided in Table 2. Table 2 also provides the results of the decomposition of seasonal concentration of demand for tourism in Norway for 2011.
Table 1. Guest nights and Gini coefficient by county, 2011.
Region County Total guest nights % total guest Gini coefficient
0,00 0,05 0,10 0,15 0,20 0,25 0,30 0,35 0 1.000.000 2.000.000 3.000.000 4.000.000 5.000.000 6.000.000 7.000.000 G ini co ef ficient G ues t nig hts Year/Month
7
nights in Norway
Eastern Norway Vestfold 1,142,638 3.9 0.47
Southern Norway Aust-Agder 676,374 2.3 0.44 Western Norway Sogn & Fjordane 1,345,561 4.6 0.44
Eastern Norway Østfold 797,615 2.7 0.39
Northern Norway Nordland 1,523,500 5.2 0.38
Northern Norway Finnmark 559,979 1.9 0.37
Southern Norway Vest-Agder 1,152,573 4.0 0.37 Western Norway Møre & Romsdal 1,420,013 4.9 0.35
Eastern Norway Telemark 1,041,568 3.6 0.32
Central Norway Nord-Trøndelag 630,980 2.2 0.28
Eastern Norway Oppland 2,774,437 9.5 0.28
Western Norway Hordaland 2,599,333 8.9 0.25
Western Norway Rogaland 1,978,238 6.8 0.22
Central Norway Sør-Trøndelag 1,604,729 5.5 0.22
Eastern Norway Hedmark 1,167,232 4.0 0.21
Northern Norway Troms 1,012,530 3.5 0.21
Eastern Norway Buskerud 2,232,551 7.7 0.19
Eastern Norway Akershus 1,615,992 5.6 0.13
Eastern Norway Oslo 3,798,470 13.1 0.13
Note. The total number of guest nights for Norway is 29,074,313 and the Gini coefficient is 0.25.
Figure 2. Lorenz curve for tourism demand in 2011 by nationality.
0 10 20 30 40 50 60 70 80 90 100 0 10 20 30 40 50 60 70 80 90 100 C um ula tiv e g ue st nig ht s % Cumulative months % Perfect equality Domestic Total International
8
Figure 3. Lorenz curve for tourism demand in 2011 by accommodation.
Figure 4. Lorenz curve for tourism demand in 2011 by main purpose of travel.
Note. Data on tourism demand by main purpose of travel is only available for hotels and similar establishments.
Based on the decomposition of demand in 2011 (Table 2), the Norwegian market reduces seasonal concentration with a relative marginal effect of -14.2 per cent. International markets increase seasonal concentration with a relative marginal effect of 14.2 per cent. Of the international markets, German and Dutch markets increase seasonal concentration with relative marginal effects of 6.8 per cent and 3.8 per cent respectively. Danish, Swedish, British, Polish and Lithuanian markets reduce seasonality although their relative marginal effects are fairly small. Hotels and similar establishments and cabins reduce seasonal
concentration with a relative marginal effect of -27.3 per cent and -1.9 per cent respectively. Campsites and hostels have the greatest propensity to increase seasonal concentration with a relative marginal effect of 28.8 per cent and 0.5 per cent respectively. Business and course and conference markets reduce seasonal concentration with relative marginal effects of -23.4 per cent and -13.0 per cent respectively. Holiday and leisure markets increase seasonal concentration with a relative marginal effect of 36.3 per cent.
0 10 20 30 40 50 60 70 80 90 100 0 10 20 30 40 50 60 70 80 90 100 Cum ula tiv e g ues t nig hts % Cumulative months % Perfect equality Hotels & similar Cabins Total Hostels Campsites 0 10 20 30 40 50 60 70 80 90 100 0 10 20 30 40 50 60 70 80 90 100 Cum ula tiv e g ues t nig hts % Cumulative months % Perfect equality Business
Course & conference Total
9
Table 2. Decomposition of seasonal concentration of demand, 2011.
Market share Gini correlation Gini coefficient Total gini Concentration contribution RME % Nationality Domestic 0,730 0,989 0,204 0,250 0,588 -14.2 International 0,270 0,978 0,390 0,250 0,412 14.2 -Germany 0,055 0,987 0,568 0,250 0,123 6,8 -Sweden 0,032 0,884 0,212 0,250 0,024 -0,8 -Denmark 0,029 0,116 0,405 0,250 0,005 -2,4 -Netherlands 0,026 0,991 0,627 0,250 0,063 3,8 -Great Britain 0,018 0,936 0,150 0,250 0,010 -0,8 -United States 0,011 0,991 0,394 0,250 0,017 0,6 -France 0,011 0,991 0,553 0,250 0,023 1,3 -Spain 0,009 0,975 0,581 0,250 0,020 1,1 -Poland 0,008 0,925 0,228 0,250 0,007 -0,1 -Italy 0,007 0,946 0,532 0,250 0,014 0,7 -Russia 0,006 0,877 0,464 0,250 0,010 0,4 -Finland 0,005 0,945 0,439 0,250 0,008 0,3 -Switzerland 0,005 0,999 0,570 0,250 0,011 0,6 -Japan 0,003 0,986 0,472 0,250 0,006 0,3 -Czech Republic 0,003 0,989 0,527 0,250 0,007 0,4 -China 0,003 0,945 0,550 0,250 0,007 0,3 -Belgium 0,003 0,985 0,548 0,250 0,006 0,3 -Austria 0,003 0,988 0,542 0,250 0,006 0,3 -Lithuania 0,002 0,854 0,211 0,250 0,002 -0,1 -Australia 0,002 0,975 0,397 0,250 0,003 0,1 Accommodation
Hotels & similar 0,660 0,976 0,150 0,250 0,387 -27,3
Campsites 0,278 0,979 0,520 0,250 0,566 28,8
Cabins 0,049 0,648 0,236 0,250 0,030 -1,9
Hostels 0,012 0,995 0,347 0,250 0,017 0,5
Main purpose of travel
Course & conference 0,133 0,020 0,164 0,150 0,003 -13,0
Business 0,379 0,743 0,077 0,150 0,145 -23,4
Holiday & leisure 0,489 0,959 0,273 0,150 0,852 36,3
Notes. Only the top 20 international markets (from a total of 41) are listed. Data on tourism demand by main purpose of travel is only available for hotels and similar establishments.
Figure 1 illustrated how seasonal concentration has declined since 1999. The decline could be due to increased year-on-year demand (which has increased from 24.4 million overnights in 1999 to 29.1 million overnights in 2011). The decline also coincides with changes in the annual market share of a number of key markets, most notably an increase in the domestic markets (from 68.0 per cent in 1999 to 73.0 per cent in 2011) and a corresponding decrease in international markets. The business market has increased from 32.4 per cent in 1999 to 37.9 per cent in 2011 and the holiday and leisure market has decreased from 52.5 per cent in 1999 to 48.9 per cent in 2011. The cabins market has increased from 1.5 per cent in 1999 to 4.9 per cent in 2011 and the hostels market has decreased from 1.6 per cent in 1999 to 1.2 per cent in
10 2011. Changes in market share of hotels and similar establishments and campsites do not conform to the rule. However, further analysis reveals that the contribution to concentration of the hotels and similar establishments has declined from 39.2 per cent in 1999 to 38.7 per cent in 2011 as a consequence of demand for hotels and similar establishments becoming less seasonally concentrated relative to other accommodation markets. This compensates to some extent for the loss of market share.
Table 3. Changes in share of total guest nights, 1999 versus 2011.
Share of total guest nights (%) 1999 2011 Change Nationality
Domestic 68.0 73.0 5.0
International 32.0 27.0 -5.0
Accommodation
Hotels & similar 67,6 66,0 -1,6 Campsites 29,3 27,8 -1,5
Cabins 1,5 4,9 3,4
Hostels 1,6 1,2 -0,3
Main purpose of travel
Course & conference 15,1 13,3 -1,8
Business 32,4 37,9 5,4
Holiday & leisure 52,5 48,9 -3,6
Note. Data on tourism demand by main purpose of travel is only available for hotel and similar establishments.
5. Conclusion
Using Gini coefficients, this study investigates the seasonal concentration of demand for tourism in Norway between 1999 and 2011. Seasonal concentration of demand in 2011 is then decomposed according to nationality, accommodation, and main purpose of visit. The study finds that seasonal concentration has declined slightly between 1999 and 2011. Based on the decomposition of 2011 data, the study finds that the domestic market reduces seasonal concentration. The international market, especially the German market enhances seasonal concentration. Hotels and similar establishments and cabins reduce seasonal concentration. Campsites and hostels enhance seasonal concentration. Business and course and conference markets reduce seasonal concentration. Holiday and leisure markets enhance seasonal concentration.
The decomposition technique used in this study is based on three factors that measure the contribution of a particular market to overall seasonal concentration; the Gini coefficient of the market, the correlation between monthly demand for the market and overall monthly demand, and the annual share that the market has of overall demand. Market share is arguably the easiest of the three to change. Consequently, the decomposition technique could be used to identify and subsequently target markets that reduce seasonal concentration (i.e. via product development or advertising and promotional campaigns). The decomposition
technique could also be used to simulate possible outcomes of increasing or reducing certain markets.
11
References
Fernández-Moralez, A. (2003) Decomposing seasonal concentration, Annals of Tourism Research, 30(4), 942-956.
Fernández-Moralez, A., and Mayorga-Toledano, M.C. (2008) Seasonal concentration of the hotel demand in Costa del Sol: a decomposition by nationalities, Tourism Management, 29(5), 940-949.
Halpern, N. (2011) Measuring seasonal demand for Spanish airports: implications for counter-seasonal marketing, Research in Transportation Business and Management, 1(1), 47-54.
Nadal, J. R., Font, A.R., and Roselló, A.S. (2004) The economic determinants of seasonal patterns, Annals of Tourism Research, 31(3), 697-711.
Norwegian Ministry of Trade and Industry (2005) Action Plan for the Travel and Tourism Industry (Oslo: Norwegian Ministry of Trade and Industry).
OECD (2008) Growing Unequal? Income Distribution and Poverty in OECD Countries
(Paris: OECD).
Lerman, R.I., and Yitzaki, S. (1985) Income inequality effects by income. The Review of Economics and Statistics, 67(1), 151-156.
Lundtorp, S. (2001) Measuring tourism seasonality. In T. Baum and S. Lundtorp (Eds.),
Seasonality in Tourism, pp. 23-50 (Oxford: Pergamon).
Statistics Norway (2012) Tourism Statistics 1999-2011 (Oslo: Statistics Norway). Baum, T. and Hagen, L. (1999). Responses to seasonality: The experiences of peripheral
destinations, International Journal of Tourism Research, 1(5); 299–312. Jang, S-C. (2004). Mitigating tourism seasonality: A quantitative approach, Annals of
Tourism Research, 31(4); 819-836.
Higham, J. and Hinch, T. (2002). Tourism, sport and seasons: the challenges and potential of overcoming seasonality in the sport and tourism sectors, Tourism Management, 23(2);175-185.
Parrilla, J.C., Font, A.R. and Nadal, J.R. (2007). Accommodation determinants of seasonal patterns, Annals of Tourism Research, 34(2); 422-436.
Yacomis, J. (1980). Tackling seasonality: The case of Sri Lanka, Tourism Management, 1(2); 84-98.
Wanhill, S.R.C. and Yacomis, J. (1980). Tackling seasonality: A technical note, International Journal of Tourism Management, 1(4); 243-245.
Xu, K. (2003). How has the Literature on Gini’s Index Evolved in the Past 80 Years? (Halifax: Dalhousie University).
12 Author: Marijana Kožul
Co-author: Ivana Brozović
Organisation: Croatian Bureau of Statistics, Tourism Department Job Title: Senior Adviser
Job Title: Head of Department,
Address: Ilica 3, 10 000 Zagreb, Croatia Phone: +385 1 4806 272, +385 1 4806 188 Fax: +385 14873 680
Email: kozulm@dzs.hr, brozovici@dzs.hr
Title of the proposed paper: TOURISM CONGRESS AS A SPECIAL TYPE OF TOURISM
Session (theme) where the paper will be presented: Theme 1: Seasonality in Tourism
Abstract:
Since 2006. Central Bureau of Statistics conducted the regular monthly survey on congressional tourism in the Republic of Croatia on the form TU-23. The purpose of this survey is to provide data that will be the basis for the analysis of the situation and development of congress tourism in Croatia, and will also serve businesses to review their position on the tourist market.
The subjects oft his survey are business meetings, incentive travels and team building programs. The survey covers all business entities performing business meetings, incentive travels and team building programmes (hotel and restaurant facilities, universities, concert and congress halls, fair, cultural facilities etc.).After analysis the quality of the obtained statistical results on business meetings, the Central Bureau of Statistics came to the conclusion that the contents of the form TU-23 should be changed in order to comply the fundamental principles of official statistics and to
improvethequalityofstatisticaldata. In cooperation with convection and incentive bureaus in Croatia, it was agreed of reporting on business meetings held on.
The aim of this presentation is to present a new method of monitoring congressional activity in the Republic of Croatia.
Congressional activity extends tourist season, especially in the classic tourist destination
13 and other business meetings are the best promoters of Croatian as a tourist, business, scientific and cultural destinations.
Keywords: seasonality, measurement, definitions, causality, geography, nichemarkets, seasonal
Adjustment
Methodology: The document will show analyses and main data from survey conducted by Croatian Bureau of Statistics.
User value/Application Context:This document can be used for deeper analyzes of the importance and posibilities of this type of Croatian tourism.
CONGRESS TOURISM IN CROATIA
Introduction
Congress tourism is an important part of business tourism in Europe. In recent years it records huge growth in the whole world. Congress tourism contributes to the transmission and exchange of experience and knowledge, as well as generating employment in the area of the congress site. Its development has positive influence on tourist results in the Republic of Croatia. Due to the importance of congress sector Croatian Bureau of Statistics conduct the regular Monthly Survey on Congresses and Other Business Meetings in the Republic of Croatia on the Form TU-23.
The aim of this survey is to insure data which will be basis to analyze congress position and
development of the whole tourism activity in Croatia. Also, the aim is to give overview to the business entities for their position on tourist market.
The aim of this work is to present a new method of monitoring congress activity in the Republic of Croatia.
14 Report on business meeting (Form TU-23)
Since January 2006, the Central Bureau of Statistics has been conducting a regular monthly survey through the TU-23 Form. The survey covers all business entities performing business meetings, incentive travels and team building programmes (hotel and restaurant facilities, universities, fair, cultural institutions and convention centres).
Up to 2012 the survey coversall business meetings with at least one realised overnight and all business meetings without realised overnights attended by 20 participants or more. Reportof Business Meeting (TU-23 form) is followed bythefollowingcharacteristics: name of business meeting, type ofbusiness meeting, type of facility in whichthebusiness meetingis held, the date of openinga businessmeeting, the date of closureof business meeting, number of days at businessmeeting, business meeting by professionalorganizer, the number of participants in businessmeeting (domestic and foreign), business meeting participants overnights, the turnover ofthe businessmeeting and extra spending.
After an analysis of the quality of obtained statistical results on business meetings ( the period from 2006-2010), CBScame to the conclusionthat thecontent of the Form TU-23 should be changed in a way to improve data quality and and reduce the burden on reporting units (there were problems with evidence on number of domestic and foreign participants, no punctual data of number of participants that realised overnights due to business meeting, no data for extra consumption). In cooperation with convention bureaus from Zagreb, Dubrovnik and Opatija the content of the TU-23 Form has been improved. CBS sent questionnaire to the report units to givetheir comments on thecontent of the Form TU-23 for 2012.CBSgot only complimentson the new TU-23 Form.
In 2012, Reporton Business Meeting(TU-23 form) is based onthe followingcharacteristics:
name ofbusiness meeting, the date of openinga businessmeeting, the date of closureof business meeting, business meeting by professionalorganizer (business meeting organised by
corporations/companies, business meetings byassociations/institutions), business meetings by type(business meeting, congress/conference, incentive, team building), business meetings bythe participants(national, international)and the number ofparticipants at a business meeting. Report on Business Meeting also includes data about business entities, capacities (number of hall, auditorium and maximum number of seats).
Becauseof these changesinmethodology,datafor 2012are notcomparablewith data 2006-2011.
15 Coverage, meeting types and definitions
In creating methodology and the questionnaire CBS used “Methodological manual for statistics on Congress and Conferences“ by Eurostat. Also, we take into consideration features that reporting units and Croatian National Tourist Board proposed.
In order to be counted the meeting shall take place in a venue specifically contracted for the purpose. The meeting shall have at least 10 participants. The days of the meeting do not include occupied rooms by participants, before and after the meeting.
Congresses/conferences are meetings in which participants belonging to different places meetin order to discuss things on a particular topic in a particular place. They canbe maintainedon a regular basis(semi-annually, annually orperennial)or adhoc(keep only onceandnot
repeated any more). Congresses, in mostcases, last forseveraldays andhave several simultaneoussessions.Conferencesareusuallyof limitedduration andhave specificgoals andtasks
Business meetings are those business-oriented meetings in which the participants represent the same company, corporate group, joint-venture, or client/provider relation withan orientationtowardthe improvementof operationsor performanceunder different conditions
Incentive travel is a marketing method aimed at stimulating the employees of a certain corporation and improving the corporation’s functioning. Incentive travel is a stimulating travel given as an award to the best employees of a certain corporation. It has replaced a classic stimulating money award etc. The firms may thank their clients, motivate or reward their employees for their loyalty and hard work invested in the firm’s efficiency by taking them to a nice incentive travel. Incentive programmes may include: golfing, sailing, rafting, ballooning, archery, cycling, paintball, ATV safari etc. Incentivetravel canbe nationalorinternational,organizedfor smallerorlarger groupsand canbe part of a motivationalprogram.
Team building program is a special type of incentive travel and, at the same time, an active relaxation, organised by agencies for employees of certain firms and institutions with the aim of boosting the team spirit, practicing coordination and offering other incentives.
16
Professional organisers of business meetings or incentive travels are domestic and foreign
corporation/companies which aim is to make a profit (companies – joint stock company, limited liability company, general partnership, limited partnership) and nonprofit
organizations/institutions, such as: international governmental organisations (e.g. UN, EU, EFTA, OECD, NATO), international NGOs, the Government of the Republic of Croatia, administration,
government bodies and bodies of local and regional government and self-government units, universities, scientific institutions, political bodies, research centers, academies, professional associations, sports associations and othernationaland international non-profitorganizations/institutions).
Internationalbusiness meetingisa business meetingwhich has at least 20% of participants that are not resident in the country where the meeting takes place. In this proportion will not be reached, the meeting shall be counted as national.
MEETING TYPES
CORPORATE MEETINGS
17 ASSOCIATION MEETINGS CONGRESS/CONFERENCE BUSINESS MEETING INSENTIVE TEAM BUILDING NATIONAL INTERNATIONAL
18 Creating of Address list
When we were creating the address list we used different sources such as: CBS Address List for Monthly Survey on Tourist Arrivals and Tourist Nights and information about congress venues from Convention Bureaus, Internet and professional magazines.
The address list covered 304 business entities with congress halls, but only 139 business entities really perform business meetings, incentive arrangements and team building program’s (hotel and restaurant facilities, universities, concert and congress halls, fairs, cultural facilities). The address list contents: data about business entities (name, address, county, town/municipalities, and post number), type of business entities (hotels by categories, universities, fairs, cultural institutions and others), capacities (number of halls and seats), telephone number and mail address. We are continuously working on better coverage of this survey.
End of year, CBS send to the report units circular letter with questionnaire (Form TU-23) and detailed instructions for filling that questionnaire. In order to facilitate the legal obligation to submit monthly questionnaire TU-23, CBS offers report units two possibility for sending the questionnaire:
1. Exceltable -filling dataTU-23 in Exceltable, prepared by CBS according toForm TU-23.
Excel spreadsheetshould be submittedby electronic mail. In this way data from reports TU-23 is inserted directly into the application, for further statistical analysis.
19 2. Classical way- fulfilling the form TU-23 in paper formin duplicate.Reporting unitkeeps one copyfor their own purposes and the other sendto the CroatianBureau ofStatistics. In this way data from reports TU-23 is entered manually into the application.
About 70% of the reporting unit submits Form TU-23 form in Excel and about 30% of them still delivered in paper.
Reporting units should submit the Reporton Business Meeting with data to the10thof the month forthe previous month.
Response rate is quite satisfactory because reporting units have a legal obligation for filling up Form TU-23. Also, CBS is very friendly and flexible concerning reporting units that do not submit the Report on time. Although the reporting units fulfil their legal obligation to submit TU-23 Form, CBS has a problem with the submission of a report by the deadline. Reporting units from the Address list must be constantly reminded from CBS of the deadline, either by mail or through the phone, which makes data collection and processing very difficult.
Survey results about Congress and Other Business Meeting in Croatia for 2012
After finishing monthly data collecting, data analysis and processing, CBS get a following data about business entities performing business meetings, incentive arrangements and team building programmes:
- number of business entities in which business meeting were held and their capacities,
- number of meetings by type of facilities in which the meeting were held (by venues),
- number of meetings by professional organiser,
- number of meetings by types,
- number of meetings by participants.
In following tables are data from business entities performing business meetings, incentive arrangements and team building programmes for period January to June 2012.
20
Business entities Congress halls Seats
Hotels and similar accommodation facilities 122 448 46 562
Universities, fair, cultural institutions and convention centres
7 93 15 216
Total 129 541 61 778
Source: Croatian Bureau of Statistics, 2012
In theperiod from January toJune 2012this survey covered129facilities in whichbusiness meetings were held, of which 89% are hotels with 541 congress halls.
2. BUSINESS MEETINGS, BY TYPES OF FACILITIES IN WHICH THEY WERE HELD, JANUARY – JUNE 2012
Business meetings
Total One-day Multy-day
Business meetings Number of days at meeting Participants Business meetings Number of days at meeting Participants Business meetings Number of days at meeting Participants
Hotels and similar accommodation facilities 3 182 6 926 206 305 1 674 1 674 102 334 1 508 5 252 103 971
Universities, fair, cultural institutions and convention centres
285 416 46 845 221 221 23 586 64 195 23 259
Total 3 467 7 342 253 150 1 895 1 895 125 920 1 572 5 447 127 230
Source: Croatian Bureau of Statistics, 2012
In the period from January to June 2012 there were 3 467 business meetings held in the Republic of Croatia, of which 1 895 business meetings were one-day (55%) and 1 572 of the events were multi-day (45%).The total number of days at business meetings was 7 342.
21 Each meeting was held two days on average. Business meetings were attended by 253 150 participants.
Source: CBS, survey 2012
3. BUSINESS MEETINGS, BY TYPES, JANUARY – JUNE 2012
Business meetings
Total One-day Multy-day
Business meetings Number of days at meeting Participants Business meetings Number of days at meeting Participants Business meetings Number of days at meeting Participants Congress/conference 1 810 3 995 165 436 892 892 73 500 918 3 103 91 936 Business meeting 1 445 2 619 73 061 953 953 48 869 492 1 666 24 192 Incentive travel 96 357 6 870 11 11 912 85 346 5 958 Team building 116 371 7 783 39 39 2 639 77 332 5 144
Structure of business meetings, by venues, January - June 2012
Hotels and similar accomodation 92% Univerzities, fair, tural institutions, and convention centres 8%
22 Total 3 467 7 342 253 150 1 895 1 895 125 920 1 572 5 447 127 230
Source: Croatian Bureau of Statistics, 2012
There are four types of business meetings by type that are monitored in this survey: congress/conference, business meeting, incentive travel and team building.
According to the type of business meeting, the most meetings, 52%, were congresses and
conferences, 42% were business meeting, and 6% were incentive and team building. The average numberof days of multi-daycongress is3.3 days and the average numberof participantsin these meetingsis 100 participants.
Monthly survey on Business Meeting conduced in CBS in 2012 also shows that business meetings last less than staying on a holiday of classic tourists. Business meetings generally last from one to four days.
52% 42%
6%
Structure of business meetings by type, January - June 2012
Congress/conference Busines meeting Incentive and team building
23
Source: CBS, survey 2012
In the period from January – June 2012 even 55% of business meetings were one-day meeting, and 45% of business meetings were multy-day.
Source: CBS, survey 2012
Average days of bussines meetings, January - June 2012
Business meetings, January - June 2012; One-day; 55; 55% Business meetings, January - June 2012; Multy-day; 45; 45%
24 4. BUSINESS MEETINGS, BY PROFESSIONAL ORGANISER, JANUARY– JUNE 2012
Business meetings
Total One-day Multy-day
Business meetings Number of days at meeting Participants Business meetings Number of days at meeting Participants Business meetings Number of days at meeting Participants
Business meetings of corporation/companies 2 182 4 424 141 500 1 236 1 236 73 961 946 3 188 67 539
Business meetings of associations/institutions 1 285 2 918 111 650 659 659 51 959 626 2 259 59 691
Total 3 467 7 342 253 150 1 895 1 895 125 920 1 572 5 447 127 230
Source: Croatian Bureau of Statistics, 2012
By professional organiser, 63% business meetings were organized by corporations and companies and 37% of business meetings were organized by associations and institutions.
25
Source: Croatian Bureau of Statistics, 2012
5. BUSINESS MEETINGS, BY PARTICIPANTS, JANUARY – JUNE 2012
Business meetings
Total One-day Multy-day
Business meetings Number of days at meeting Participants Business meetings Number of days at meeting Participants Business meetings Number of days at meeting Participants National 2 689 4 650 179 785 1 695 1 695 113 943 994 2 955 65 842 International 778 2 692 73 365 200 200 11 977 578 2 492 61 388 Total 3 467 7 342 253 150 1 895 1 895 125 920 1 572 5 447 127 230 Source: CBS, survey 2012
Structure of business meetings by professional organiser, January - June 2012
Business meetings of association/institutions 8% Business meetings of corporation/companies 92%
26
Source: CBS, survey 2012
According to the participants, 22% business meetings had an international dimension. 78% business meetings were national.
When we were defining thecharacteristics of the FormTU-23 for 2012, congressionaloffices have emphasized the importanceof monitoringcharacteristicsof thebusiness meeting if they are national orinternational. It was agreed, according to the proposalsofcongressionaloffices thathave several years ofexperience in the internationalcongresstourismmarket,that nationalbusiness meeting is everybusiness meetingin which80%of participants andmore
are Croatian citizens and internationalbusiness meetingisa business meetingin which20%
or moreparticipantsare foreign.
Survey results are quarterly publishedin the aggregatedformon the CBS website www.dzs.hr/"Releases"/"Meetings and other business meetingsin 2012."
Seasonality
Croatia for years has the image as a holiday destinations. Awareness that the tourist season can be extend has stimulated business professionals to try to define Croatia as a congress destination also. Congress and business tourism known as MICE tourism (Meetings, Incentives, Congresses,
Exhibitions) can be a great way to fill the hotel capacity in the preseason and postseason.
Business meetings by participants, January - June 2012
National 78% International
27
Monthly survey on Business Meeting conducted for years in CBS shows that the period in May and September has always been the most popular time to organize business meetings. The relative popularity of July and August has been decreasing over the past five years. The popularity of March has been increasing. The seasonal distribution of events shows that congress tourism is mainly performed before and after the tourism season (in the spring and autumn).
Chart of Tourist nights shows that Croatia is still a holiday destination. The largest number of overnight stays realised in the period from June to August 2012, in the summer.
In 2011, the three summer months, June, July and August, recorded the peak of tourism season. Tourist nights realised about 75% of the total tourist nights. 2012th shows the same trend.
28
Source: CBS, survey 2012
Cities with the most business meetings in Croatia
Business travelers are most attracted by Zagreb, Dubrovnik, Opatija, Rijeka, Osijek and Split which recorded good results in business tourism throughout the whole year. These cities have good geographic location, they are close to the main generating markets, have significant natural and cultural attractions, have developed infrastructure, and have large conference halls and five star hotels. They invest in better transport links and airports.
MUNICIPALITIES, NUMBER OF BUSINESS MEETINGS, NUMBER OF DAYS, JANUARY – JUNE 2012
Municipality Business meetings Participants Days
Zagreb 1 725 137 534 2 669
Dubrovnik 227 16 621 845
Opatija 196 18 886 574
Rijeka 199 10 970 214
Osijek 165 10 058 232
TOURIST NIGHTS, BY MONTHS, AUGUST 2011 – AUGUST 2012
'000 2011. 2012. 0 2 000 4 000 6 000 8 000 10 000 12 000 14 000 16 000 18 000 20 000 22 000
VIII. IX. X. XI. XII. I. II. III. IV. V. VI. VII. VIII.
Total Foreign tourists Domestic tourists
29
Split 163 8 391 367
Source: CBS, survey 2012
Source: CBS, survey 2012
The largestnumber of meetingsin the periodfrom January to June 2012, in Croatia, was held in the Zagreb (50%). In the period from January to June businessmeetings in Zagreb were attended by 54% of the total numberof participants. Zagreb is the administrative, economic, diplomatic, and cultural center of the Croatia. From every European city, Zagreb can be reached by plane in less than two hours.
Excellent offer in organisation of congresses, Dubrovnik makes one of the most important destinations meeting industry in Croatia. In the spring and the autumn part of the tourist season, Dubrovnik hosts participants of international congresses and groups with special
Number of business meetings per city, January - June 2012
Opatija 6% Osijek 5% Split 5% Rijeka 6% Dubrovnik 7% Other 23% Zagreb 50%
30 programs that during this period of year achieved the great tourist results. Over the years city established itself as a top congress center for participants 150-700 participants, making Dubrovnik one of the most famous congress city in Europe.
Together withZagreb andDubrovnik,Opatijaisthe leading cityin congress tourismin Croatia. In the last 5years, thiscity has beenhost tomany nationaland international
conferences.With more than20 hotels,a variety of restaurantsand entertainmentprograms and events, Opatija can alreadysatisfythecongress organizers and business meeting
participants.
Except the existing ones, Croatia needs a new congress centers equipped by European standards with capacities of several thousand seats. With their construction Croatia could stand side by side with the strongest European congress cities.
Conclusion
Congress activity is very important, notonly for tourism, but also itis an importantactivityfor the Croatian developmentand the economy. Congress meetings produce an exchange of experience, knowledge and information. There are significantimprovements intransport, communication and accommodation. Congress activity also increases the international position of cities. It extends tourist season, especially in the classic tourist destination characterized by highly seasonal concentration of tourists.
Congress industry produces numerous of major features. First of all, occupancy of the capacity isin the pre-season. Then it should be notedsignificantly greaterconsumption ofcongress
participantsthen the tourists on holidays. An additionaladvantage is thateach business meetingincludesshort tripsso participants have a chance tosee natural beauty of Croatia.
31
Satisfied participants of congress and other business meetings are the best promoters of Croatian as a tourist, business, scientific and cultural destinations.
Therefore, great opportunities for the increasing demand for Croatia can expect in congress tourism.
Significant impacton the developmentof tourismin Croatiahas,and must have, the congress tourism. Croatia is an ideal destination for this type of tourism. Croatia has good transport links, good infrastructure and supporting content such as cultural and historical heritage and natural attractions.
Due to the importance of the congress sector, statistics need to be developed to cover a wide range of users’ requirements. Institutions and government needs statistics to analyses the flows of congress tourism and to renovate venues to be able to accommodate a larger number of participants of the congress in one place. Specialised agencies need statistics for monitoring the movement of congress activities and for further development and spread of work. Enterprises and tourism suppliers also need statistics. Therefore, statistics has to conduct and disseminate quality data of congress activity.
Inthe futureCBS will try to enrich the Survey on Congresses and Other Business Meetings with new data. In association with convention and incentive bureaus CBS will try to preparesurveyon the consumptionof participants inbusinessmeetings.
Finally, quality datais the basefor quality businessdecisions, incongressindustry and inthe tourismin general.
32
Understanding seasonality in peripheral regions
The potentials and pitfalls of developing winter tourism in Iceland
Seasonal differences in tourism are very pronounced in Iceland, especially in rural areas. During the summer months, ca. 70% of all overnight stays are registered in regions outside of the capital area, whereas in the off-season this ratio of rural regions versus capital area is reversed. One obvious consequence of this is severe under-utilization of tourism infrastructure which in turn has a negative effect both on full-time job creation and on investments, whether in infrastructure or in less tangible things such as quality development, environmental management or innovation. It may also be argued that this “bi-polar” situation has a negative effect on tourism development more generally as companies (the large majority of which are SMEs) tend to become largely “dormant” in the off-season months.
This paper will outline the terms of seasonality in the Icelandic context relating it to seasonal challenges common to peripheral and island destinations in tourism. This geographical focus on seasonality entails an understanding of Iceland’s position as a potential peripheral polar destination and to what extent this classification fits what can be observed in tourism statistics from the island. The paper draws on available statistics in Iceland to demonstrate how these can reveal seasonality dynamics through which an understanding of how destinations are constituted can be provided. Iceland’s two destination character, with the capital region on the one side and the rest of the country on the other, which statistics clearly reveal, is paramount when trying to come to terms with seasonality. Thus the paper will demonstrate the role of tourism statistics in directing policy initiatives to tackle seasonality.
In autumn 2011, the Icelandic government launched a three year marketing and promotion initiative called “Ísland Allt Árið” (Iceland - all year round) which has the primary aim of increasing visitor arrivals in Iceland during the low season(s). Most of the funds made available were earmarked for marketing campaigns which are meant to follow the lead set
by the marketing campaign Inspired by Iceland. The success of the campaigns will,
apparently, be monitored by the responsible government institutions. No funding, however, has yet been announced for either basic or applied research on the possibility of developing winter tourism in Iceland, its limits or potential consequences. The paper will argue that the inspirations for this campaign are drawn from the available tourism statistics but that it fails to address more fundamental issues of seasonality in a peripheral island destination. The bifurcated nature of Iceland as a destination is reflected in its industry structure and thus the paper argues for the role of niche market industry initiatives as crucial to addressing seasonality. Moreover the role of transportation and infrastructure needs to be integrated.
In order to demonstrate how these marketing initiatives and development projects need to unfold the paper concludes by demonstrating the necessity of understanding the attitudes and expectations of potential winter tourists in Iceland, their experiences and behaviours. The paper will outline possible ways to integrate these insights into tourism statistics that ultimately feed into tourism marketing and development.
33
Authors
Edward H. Huijbens Director / Reader
Icelandic Tourism Research Centre / University of Akureyri Borgum v/Norðurslóð
600 Akureyri, Iceland (IS)
Phone: +354 460 8930, fax: 460 8919
edward@unak.is
Þorvarður Árnason Director
Hornafjörður University Centre Nýheimar, Litlabrú 2,
780 Höfn, Iceland (IS) Phone: +354 470 8040 thorvarn@hi.is
34
WHY COMBATING
SEASONALITY IN NEW ZEALAND
REQUIRES A MORE COORDINATED MULTI-LAYERED
APPROACH INCLUDING COLLABORATION WITH
AIRLINES
Markus M. M. Landvogt
Professor for Information Management in Tourism, Faculty Tourism, Kempten University, Bahnhofstraße 61, D-87435 Kempten (Allgäu), Germany. Ph. +49 831 2523 9518,
E-mail: Markus.Landvogt@fh-kempten.de
Abstract
This paper analyses the seasonal variation in tourism demand in New Zealand. The tourism industry in New Zealand faces abnormally strong seasonality for a country of its latitude and climate. In spite of a broad understanding of the phenomenon of seasonality, tourism strategies to change travel patterns have so far had limited effect. This paper is based on a quantitative analysis of the publicly available tourism data in New Zealand by utilising seasonality measures such as the Gini Coefficient. By treating some of the shortcomings of the data and the measurement methods, new insights into the phenomenon of seasonality are gained. What seems to be an extreme seasonality problem for the tourism industry onshore is not an issue at all for airlines flying to New Zealand. Acknowledging these facts may help to understand that only a collaborative approach in tackling seasonality across all sectors could have the much hoped-for effect of distributing the tourism demand more evenly.
Key words: New Zealand, Seasonality, Seasonality measures, Gini Coefficient, Collaboration in tourism
Introduction
Seasonality in tourism is a well-known phenomenon. Academics, policymakers and especially tourism businesses regularly deal with the issues related to seasonal imbalances in tourism demand. However, in New Zealand, seasonality is not just a concern but the main problem facing the tourism industry, as is well recognised by the tourism sector itself and by central government.
New Zealand’s location in the Southern hemisphere, its temperate maritime climate and its predominantly Western culture and traditions result in the overlap of key drivers for seasonality: summer, school and industrial holidays, as well as the Christmas/New Year break.
35 This extreme seasonality of tourism demand has a significant impact on the productivity of New Zealand’s tourism industry. The seasonal fluctuation constrains the more efficient use of tourism assets and also acts as a disincentive for investment and for the development of employees.
As New Zealand is an island country 1,500 kilometres from the next larger landmass, arrivals are predominantly (99.1 per cent) by air, with the remainder at sea ports. The limited number of airports and sea ports allows New Zealand to collect extremely accurate data on visitor arrivals and departures. In addition, the New Zealand Commercial Accommodation Monitor provides reliable data on seasonal distribution of tourism onshore.
This paper studies seasonality in New Zealand tourism based on accessible data from these sources. It focuses on quantitative methods such as the Gini Coefficient to measure seasonality.
Literature review
Seasonality in tourism is not yet sufficiently understood for successful strategies to be developed that tackle this fluctuation in demand. However, seasonality has become a central theme in practical tourism management, policy-making and academic studies. Firstly, it is seen as a problem of the tourism industry, where capacity utilisation has to be maximised in order to achieve profitability. Secondly, because tourism providers naturally collaborate within the same destination and as a single provider’s actions can have only limited impact, seasonality becomes an issue of the destination and its policy-makers in terms of socio-economic impacts and the development of tourism. Thirdly, seasonality is becoming a focus in the academic literature on tourism (Koenig-Lewis & Bischoff, 2005).
BarOn (1975) defined seasonality as the effects occurring each year with more or less the same timing and magnitude. Butler (1994) described seasonality as: “A temporal imbalance in the phenomenon of tourism, which may be expressed in terms of dimensions of such elements as numbers of visitors, expenditure of visitors, traffic on highways and other forms of transportation, employment and admissions to attractions.” Other definitions focus on its causes (Hylleberg, 1992) or on its yearly reoccurrence (Kuznet, 1933; Hartmann, 1986; Allock, 1989), or try to identify main or peak tourism seasons (Mitchell & Murphy, 1991; Lim & McAleer, 2001).
Two main causes of seasonality in tourism have been identified: these are the natural and the institutional causes. Natural causes relate to regular temporal variations in natural phenomena, particularly those associated with hours of daylight, temperature, rainfall and snow (BarOn, 1975; Hartmann, 1986; Butler, 1994; Frechtling, 2001). Institutional causes relate to temporal variations based on social factors and legislated policies. These include the impact of religious and other public holidays and the longer vacations of educational institutions and workplaces (usually over summer). The calendar effects of weekdays and weekends, fixed or continuously changing holidays, and single
36 or re-occurring events also have an influence on seasonality. Clearly, natural and institutional causes are often interlinked (Butler, 1994; Hinch & Jackson, 2000).
A majority of outdoor activities rely on natural, climate-dependent attractions. Destinations predominantly offering natural scenery and outdoor facilities will therefore experience a much higher influence of natural causes on seasonality.
The physical and socio-cultural factors causing seasonality might be different in the generating areas compared to the receiving areas for tourism (Butler & Mao, 1997). Important factors in the origins of the tourists may act as ‘push-factors’ and factors in the destination as ‘pull-factors’ (Lundtorp, Rassing & Wanhill, 1999). In order to tackle seasonality, it is important to realise where seasonality is generated (Butler & Mao, 1997).
Access to a destination has also an impact on seasonality. Peripheral locations, particularly islands, experience a high level of dependency on access carriers (Baum & Hagen, 1999). Some islands, in theory, use transport policy as a means to stimulate demand outside the main season.
According to Koenig-Lewis & Bischoff (2005), most of the academic literature dealing with the issues of seasonality identifies demand fluctuations as a major problem which either has to be overcome, reduced in its effects or tackled due to its economic, ecologic and socio-cultural impacts. The economic problem is mainly identified through an inflexibility to expand resources and facilities to meet total demand in the peak season and an under-utilisation in the off-peak season. The latter is usually measured with an absence of cost covering or a loss of profit due to inefficient use of capacities. Particular industries such as the accommodation sector and attractions suffer from this, either because they cannot be relocated or because they lack an alternative use.
Other economic impacts include the effects of seasonal employment. The most important issue is the difficulty in recruiting and employing full-time staff. Issues such as reduced time for education, limited availability of skills, lower payment and a higher fluctuation in the tourism labour market have an impact on both the employee and employer sides.
Ecological impacts are mainly related to negative effects through a higher concentration of visitors during the peak season. Overcrowding and overuse result, for example, in heavy traffic and in the exhaustion of infrastructure and of natural resources such as water supply, sewage, and air pollution.
37 Socio-cultural impacts deal with the effects of seasonal variation on the host community and the visitors. Problems are related to infrastructure problems and quality of life, as well as to satisfaction on the demand and supply side.
Tourism in New Zealand
New Zealand is an island country in the South-West Pacific with its administrative boundaries from 33° to 55° South latitude. It is an attractive tourist destination famed for its various beautiful landscapes, different climate and vegetation zones, good infrastructure, outdoor lifestyle and its surprisingly empathetic and welcoming people.
Tourism plays an important role in the New Zealand economy as it provides one in eleven jobs both directly and indirectly. New Zealand’s tourism focus lies on incoming tourism, with international visitors comprising 40 per cent of all commercial guest nights and contributing 16.8 per cent to the country’s export revenues. Tourism is, besides the dairy industry, the most important export sector in a country still regarded as a Western industrial country.
According to the Tourism Satellite Account, tourism’s direct and indirect contribution to New Zealand’s Gross Domestic Product (GDP) reached 8.6 per cent in 2011. With currently 179,800 jobs, 9.3 per cent of the New Zealand workforce is linked to tourism (Statistics New Zealand, 2011). For the complete year ended in June 2012, New Zealand attracted 2,635,726 international visitors, each of these spending an average of 19.4 days in the country (Statistics New Zealand, 2012), and in total staying for 51,133,084 nights. Based on the population of about 4.4 million people, the tourism density is 11,600 overnights per 1,000 inhabitants per year.
New Zealand’s temperate climate – which has an average maximum air temperature in its largest city, Auckland, ranging from 14.7°C in July to 23.7°C in February (NIVA, 2012) – has a strong influence on seasonality. The peak tourism demand period occurs during the summer months, from November/December through to March. The bulk of domestic tourism happens over the Christmas/New Year period because this is the usual close-down time for schools, industry and commerce (Collier & Latham, 2002).
For most destinations in the northern hemisphere, summer coincides with the main school and industrial holidays. Although, both causes depend on each other, they are still seen as two drivers for seasonality in tourism. If three causes overlap, an increased seasonality can be expected, and this is the case for countries in the southern hemisphere with a predominantly occidental tradition such as New Zealand. That is because the two causes of seasonality in tourism (summer, and the main school and industrial holidays) coincide with a third major cause, the Christmas/New Year holiday.
In New Zealand, school holidays start in mid-December and last until the national holiday on 6th of February, while industry holidays are held in the two weeks after Christmas and are sometimes extended to the middle of January. This is because there are four national holidays within a short space of time (December 25, December 26, January 1 and January 2, with all of these taken during the following week if they fall on a weekend), prompting many government agencies and commercial businesses to take the opportunity to close for one or two weeks, or even longer.