ELECTRICITY PRICING
METHODOLOGY 2013
EFFECTIVE 1 APRIL 2013
DISCLOSED IN ACCORDANCE WITH SECTION 2.4.1 OF THE ELECTRICITY DISTRIBUTION INFORMATION DISCLOSURE DETERMINATION 2012
Powerco Limited | Electricity Pricing Methodology 2013 2 CONTENTS PAGE
1. Definitions ... 3
2. Background ... 7
3. Legal Requirements ... 8
4. Changes to the methodology ... 13
5. Overview of the pricing methodology ... 15
6. Powerco’s Pricing Strategy ... 17
7. Summary of Pricing Process ... 18
8. Quantification of Key Components of Costs and Revenues ... 19
9. Eastern Region pricing Methodology ... 21
10. Western Region pricing Methodology ... 31
11. Revenue Summary ... 39
12. Approach to setting prices for non-standard contracts ... 41
13. Compliance with Electricity Authority’s Pricing Principles ... 44
14. Summary of Compliance with clauses 2.4.1 to 2.4.5 of the Electricity Information Disclosure Determination 2012 ... 54
15. Certification of Year Beginning Disclosure ... 57
Powerco Limited | Electricity Pricing Methodology 2013 3
1. DEFINITIONS
This pricing methodology uses industry standard terms where possible. A glossary of common terms is included for clarity. Additional information on definitions used in the document can be found in:
Powerco’s Distributed Generation Policy and Asset Management Plan1; and
The Commerce Commission’s electricity default price-quality path notice and information disclosure requirements.2
“Anytime Maximum Demand” (AMD) means, in respect of a Western Region
Consumer, on a 12-month rolling basis the highest kVA peak occurring at anytime for that Consumer. In respect of an Eastern Region Consumer, AMD means the highest kW peak occurring any time in the twelve month period from 1 January to 31
December, the result of which is applied in the subsequent Price Year commencing 1 April.
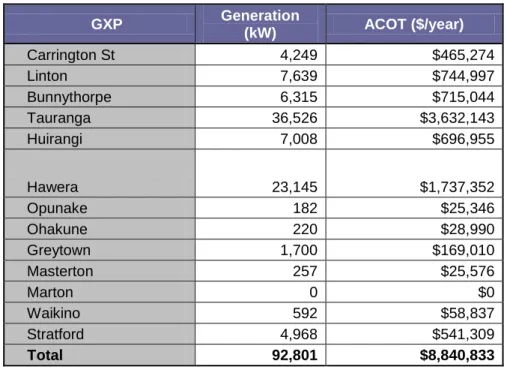
“Avoided Cost of Transmission” (ACOT) is the amount equal to the actual reduction in the interconnection charges of new investment charges that are payable by
Powerco to Transpower under the Grid Network Agreement. ACOT charges are a substitute for what otherwise would have been Transpower charges.
“Coincident Maximum Demand” (CMD) see “On Peak Demand”
“Connection” or “Point of Connection” means each point of connection at which a supply of electricity may flow between the Distribution Network and the Consumer’s installation, as defined by the Distributor.
“Consumer” means a purchaser of electricity from the Retailer where the electricity is delivered via the Distribution Network.
“Customer” means a direct Customer or a Retailer (where the Retailer is the Customer).
“Default Price Path – DPP” means Powerco’s compliance with clause 8 of the Commerce Act (Electricity Distribution Default Price Quality Path) Determination 2010.3
“Demand” means the rate of expending electrical energy expressed in kilowatts (kW) or kilovolt amperes (kVA).
“Distributed Generation” or “Embedded Generation” means electricity generation that is connected and distributed within the Network.
“Distributed Generator” or “Embedded Generator” means an electricity generation plant producing Embedded Generation.
1
Available at www.powerco.co.nz.
2
Available at www.comcom.govt.nz.
3The DPP is described in more detail on the Commerce Commission’s website, http://www.comcom.govt.nz/electricity-default-price-quality-path/
Powerco Limited | Electricity Pricing Methodology 2013 4
“Distribution Network” or “Network” means:
DISTRIBUTION NETWORK
EASTERN REGION Valley – the Distribution Network connected to the Transpower transmission system at the GXPs at:
Kinleith Kopu Hinuera Piako Waihou Waikino
Tauranga – the Distribution Network connected to the Transpower transmission system at the GXPs at:
Tauranga Mt Maunganui Te Matai Kaitimako
WESTERN REGION Wairarapa – the Distribution Network connected to the Transpower transmission system at the GXPs at:
Greytown Masterton
Manawatu – the Distribution Network connected to the Transpower transmission system at the GXPs at:
Bunnythorpe Linton Mangamaire
Taranaki – the Distribution Network connected to the Transpower transmission system at the GXPs at:
Carrington Huirangi Hawera New Plymouth Opunake Stratford
Wanganui – the Distribution Network connected to the Transpower transmission system at the GXPs at:
Brunswick Marton Mataroa Ohakune Wanganui Waverley
“Distributor” means Powerco Limited, as the operator and owner of the Distribution Networks, and includes its subsidiaries, successors and assignees.
“Electricity Authority” (EA) means the Electricity Authority which is an independent Crown entity responsible for regulating the New Zealand electricity market.
“Grid Exit Point” (GXP) means a point of connection between Transpower’s transmission system and the Distributor’s Network.
“High-Voltage” (HV) means voltage above 1,000 volts, generally 11,000 volts, for supply to Consumers.
“Installation Control Point” (ICP) means a Point of Connection on the Distributor’s Network, which the Distributor nominates as the point at which a Retailer is deemed to supply electricity to a Consumer, and has the attributes set out in the Code.
Powerco Limited | Electricity Pricing Methodology 2013 5 “kVA” means kilovolt–ampere (amp).
“kVAh” means kilovolt ampere hour.
“kVAr” meanskilovolt ampere reactive.
“kW” means kilowatt.
“kWh” means kilowatt hour.
“Line Charges” means the charges levied by the Distributor on Customers for the use of the Distribution Network, as described in the Pricing Schedule.
“Low Voltage” (LV) means voltage of value up to 1,000 volts, generally 230 or 400 volts for supply to Consumers.
“MVA” means Megavolt Ampere.
“Network” see Distribution Network.
“Optimised Deprival Value” (ODV) means, in respect of the Distributor’s assets, the value attributed by applying the ODV methodology, as set out in the Handbook for Optimised Deprival Valuation of System Fixed Assets of Electricity Line Businesses published by the Commerce Commission in 2004.
“Optimised Replacement Cost” (ORC) is an estimate of the current cost of replacing the asset with one that can provide the required service in the most efficient way. Under this approach, asset values are adjusted if assets exhibit excess capacity, are over-engineered, are poorly designed (compared with modern technology) or are poorly located.
“Optimised Depreciated Replacement Cost” (ODRC) is an estimate of the ORC value, less an allowance for depreciation that reflects the age of the asset.
“On Peak Demand” (OPD) is the average of Consumer’s demand during the 100 regional peak periods as notified by Transpower. The 100 regional peak periods will be between 1 September 2010 and 31 August 2011 for the Price Year effective 1 April 2012. The OPD is used in calculating the Line Charges of a Consumer on an asset-based load group such as the V40, T50, V60 and T60 load groups.
“Point of Connection” means the point at which electricity may flow between the Network and the Consumer’s Installation and to which an Installation Control Point is allocated.
“Powerco” means Powerco Limited and any of its subsidiaries, successors and assignees.
“Price Category” means the relevant price category selected by the Distributor from this Pricing Schedule to define the Line Charges applicable to a particular ICP.
“Price Year” means the 12-month period between 1 April and 31 March.
“Recoverable Costs” has the meaning specified in clause 3.1.3 of the Commerce Act (Electricity Distribution Services Input Methodologies) Determination 2012.
Powerco Limited | Electricity Pricing Methodology 2013 6 “Region” means the Eastern Region or the Western Region as the case may be.
“Registry” means the Electricity Authority central Registry.
“Retailer” means the supplier of electricity to Consumers with installations connected to the Distribution Network.
“Time of Use Meter” (TOU) means metering that measures the electricity consumed
for a particular period (usually half-hourly) and complies with Part 10 of the Code.
“Tariff Option” means the price option within a Price Category where such a Price Category provides for Retailer choice amongst two or more options, subject to a particular configuration of metering and Load Control Equipment.
“Transmission Charge” has the meaning specified in section 4 of the Electricity Distribution Services Default Price-Quality Path Determination 2010.
Powerco Limited | Electricity Pricing Methodology 2013 7
2. BACKGROUND
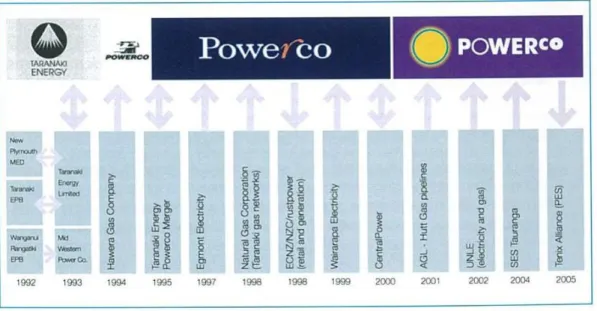
1. Powerco is a utility network ownership and management business. It is New Zealand’s largest provincial distributor of electricity and gas, with around 420,000 consumers connected to its networks. Powerco’s electricity networks are located in Tauranga, Thames Valley, Coromandel Peninsula, Eastern and Southern Waikato, Taranaki, Whanganui, Rangitikei, Manawatu and Wairarapa. Our gas pipeline networks are in Hutt Valley, Porirua, Wellington, Horowhenua, Manawatu, Taranaki and Hawke’s Bay. 2. From the mid-1990s until the early 2000s, Powerco grew significantly through mergers and acquisitions to its current position as New Zealand’s second largest electricity and gas distribution utility. In March 2000, Mergeco was incorporated and was renamed Powerco in September 2000 when it acquired the energy distribution undertakings of the former Powerco Limited and CentralPower Limited. Powerco acquired the Eastern Region electricity network and Central gas network from UnitedNetworks Limited (UNL) in November 2002.
Figure 1: History of Powerco Mergers and Acquisitions.
3. Funds managed by QIC Limited have a 58% stake in Powerco, with the remaining 42% holding owned by Brookfield Infrastructure Partners. QIC Limited is a Queensland Government-owned institutional investment manager. Brookfield Infrastructure
Partners is a Canadian infrastructure investment business listed on the New York Stock Exchange and the Toronto Stock Exchange.
4. In November 2005, Powerco sold its New Zealand field service contracting businesses to Tenix Alliance. In New Zealand, Powerco contracts a large portion of its field
services from Tenix under an open-book alliance arrangement.
5. The electricity industry has undergone significant change, including regulatory change, since 1992. Legislation has required electricity lines businesses to be separated from retail and generation businesses. Price-quality thresholds for electricity lines
businesses were introduced in 2003 and remained in force until 31 March 2010. Since 1 April 2010 Powerco has been subject to the Electricity Distribution Services Default
Powerco Limited | Electricity Pricing Methodology 2013 8 Price-Quality Path Determination 20104, which is enforced pursuant to Part 4 of the Commerce Act 1986.
6. On 1 October 2012 the Electricity Distribution Information Disclosure Determination 2012 came into force, which inter alia requires Powerco and other non-exempt lines businesses to disclose specified pricing and related information.
3. LEGAL REQUIREMENTS
7. This document contains the information that must be disclosed in accordance with clauses 2.4.1 to 2.4.5 of the Electricity Distribution Information Disclosure
Determination 2012. Part of this required information is a demonstration of the extent to which the pricing methodology is consistent with the Electricity Authority’s pricing principles5 and, if necessary, an explanation of the reasons for any inconsistency between the pricing methodology and the pricing principles6. We do not believe there is any inconsistency between this pricing methodology and the pricing principles. 8. Other legal requirements that affect distribution pricing are contained in the Commerce
Act (Electricity Distribution Default Price-Quality Path) Determination 2010 (DPP) and the Electricity (Low Fixed Charge Tariff for Domestic Consumers) Regulations 2004 (Low Fixed Tariff Regulations).
9. Detailed below are:
the disclosure requirements;
the Electricity Authority’s pricing principles;
the pricing implications of the DPP;
the pricing implications of the Low Fixed Tariff Regulations.
ELECTRICITY DISTRIBUTION INFORMATION DISCLOSURE DETERMINATION 2012 – CLAUSES 2.4.1 TO 2.4.5
The Commerce Commission’s Electricity Distribution Information Disclosure
Determination 2012 came into force on 1 October 2012. Clauses 2.4.1 to 2.4.5 of the Determination state:
Disclosure of pricing methodologies
2.4.1 Every EDB must publicly disclose, before the start of each disclosure year, a pricing methodology which-
(1) Describes the methodology, in accordance with clause 2.4.3 below, used to calculate the prices payable or to be payable;
4
Originally styled the Commerce Act (Electricity Distribution Default Price-Quality-Path) Determination 2010.
5
As specified in Distribution Pricing Principles and Information Disclosure Guidelines, originally published by the Electricity Commission in March 2010.
6
Powerco Limited | Electricity Pricing Methodology 2013 9 (2) Describes any changes in prices and target revenues;
(3) Explains, in accordance with clause 2.4.5 below, the approach taken with respect to pricing in non-standard contracts and distributed generation (if any); (4) Explains whether, and if so how, the EDB has sought the views of consumers,
including their expectations in terms of price and quality, and reflected those views in calculating the prices payable or to be payable. If the EDB has not sought the views of consumers, the reasons for not doing so must be disclosed. 2.4.2 Any change in the pricing methodology or adoption of a different pricing
methodology, must be publicly disclosed at least 20 working days before prices determined in accordance with the change or the different pricing methodology take effect.
2.4.3 Every disclosure under clause 2.4.1 above must-
(1) Include sufficient information and commentary to enable interested persons to understand how prices were set for each consumer group, including the assumptions and statistics used to determine prices for each consumer group; (2) Demonstrate the extent to which the pricing methodology is consistent with the
pricing principles and explain the reasons for any inconsistency between the pricing methodology and the pricing principles;
(3) State the target revenue expected to be collected for the disclosure year to which the pricing methodology applies;
(4) Where applicable, identify the key components of target revenue required to cover the costs and return on investment associated with the EDB’s provision of electricity lines services. Disclosure must include the numerical value of each of the components;
(5) State the consumer groups for whom prices have been set, and describe– (a) the rationale for grouping consumers in this way;
(b) the method and the criteria used by the EDB to allocate consumers to each of the consumer groups;
(6) If prices have changed from prices disclosed for the immediately preceding disclosure year, explain the reasons for changes, and quantify the difference in respect of each of those reasons;
(7) Where applicable, describe the method used by the EDB to allocate the target revenue among consumer groups, including the numerical values of the target revenue allocated to each consumer group, and the rationale for allocating it in this way;
(8) State the proportion of target revenue (if applicable) that is collected through each price component as publicly disclosed under clause 2.4.18.
Powerco Limited | Electricity Pricing Methodology 2013 10 2.4.4 Every disclosure under clause 2.4.1 above must, if the EDB has a pricing strategy-
(1) Explain the pricing strategy for the next 5 disclosure years (or as close to 5 years as the pricing strategy allows), including the current disclosure year for which prices are set;
(2) Explain how and why prices for each consumer group are expected to change as a result of the pricing strategy;
(3) If the pricing strategy has changed from the preceding disclosure year, identify the changes and explain the reasons for the changes.
2.4.5 Every disclosure under clause 2.4.1 above must–
(1) Describe the approach to setting prices for non-standard contracts, including– (a) the extent of non-standard contract use, including the number of ICPs
represented by non-standard contracts and the value of target revenue expected to be collected from consumers subject to non-standard contracts; (b) how the EDB determines whether to use a non-standard contract, including
any criteria used;
(c) any specific criteria or methodology used for determining prices for
consumers subject to non-standard contracts and the extent to which these criteria or that methodology are consistent with the pricing principles;
(2) Describe the EDB’s obligations and responsibilities (if any) to consumers subject to non-standard contracts in the event that the supply of electricity lines services to the consumer is interrupted. This description must explain-
(a) the extent of the differences in the relevant terms between standard contracts and non-standard contracts;
(b) any implications of this approach for determining prices for consumers subject to non-standard contracts;
(3) Describe the EDB’s approach to developing prices for electricity distribution services provided to consumers that own distributed generation, including any payments made by the EDB to the owner of any distributed generation, and including the-
(a) prices; and
(b) value, structure and rationale for any payments to the owner of the distributed generation.
Powerco Limited | Electricity Pricing Methodology 2013 11 ELECTRICITY AUTHORIT Y’S DISTRIBUTION PRICING PRINCIPLES
Pricing Principles
(a) Prices are to signal the economic costs of service provision, by:
(i) being subsidy free (equal to or greater than incremental costs, and less than or equal to stand alone costs), except where subsidies arise from compliance with legislation and/or other regulation;
(ii) having regard, to the extent practicable, to the level of available service capacity; and
(iii) signalling, to the extent practicable, the impact of additional usage on future investment costs.
(b) Where prices based on ‘efficient’ incremental costs would under-recover allowed revenues, the shortfall should be made up by setting prices in a manner that has regard to consumers’ demand responsiveness, to the extent practicable.
(c) Provided that prices satisfy (a) above, prices should be responsive to the requirements and circumstances of stakeholders in order to:
(i) discourage uneconomic bypass;
(ii) allow for negotiation to better reflect the economic value of services and enable stakeholders to make price/quality trade-offs or non-standard arrangements for services; and
(iii) where network economics warrant, and to the extent practicable, encourage investment in transmission and distribution alternatives (e.g. distributed generation or demand response) and technology innovation.
(d) Development of prices should be transparent, promote price stability and certainty for stakeholders, and changes to prices should have regard to the impact on stakeholders. (e) Development of prices should have regard to the impact of transaction costs on retailers,
consumers and other stakeholders and should be economically equivalent across retailers.
DEFAULT PRICE-QUALITY PATH DETERMI NATION – PRICING IMPLICATIONS 10. The Commerce Act (Electricity Distribution Default Price-Quality Path) Determination
2010 (DPP) allows Powerco to increase its notional revenue (sum of price times quantity for all prices) by the average annual change in the Consumers’ Price Index (CPI) plus any change in pass-through and recoverable costs, which include
transmission charges, local authority rates and the levies charged by the Commerce Commission and Electricity Authority
11. In November 2010, the Commerce Commission amended the DPP to include a “revenue differential adjustment” term, which removes the link between the price an electricity distribution business (EDB) charged in the previous pricing period and its price path for the next pricing period. Powerco has incorporated this change into its pricing methodology.
Powerco Limited | Electricity Pricing Methodology 2013 12 12. In November 2012, the Commerce Commission finalised a mid-period starting price
adjustment for the DPP applying to electricity distribution businesses7.Changes to electricity line charges with effect from 1 April 2013 reflect changes that result from this starting price adjustment.
LOW FIXED TARIFF REGULATIONS – PRICING IMPLICATIONS
13. The Electricity (Low Fixed Charge Tariff for Domestic Consumers) Regulations 2004 require that, for every residential standard tariff option that is available, another tariff option must also made available for residential consumers for which the fixed charge component is no more than 15 cents per day and the total charges per year for the average residential consumer are the same or no more than those incurred under the standard option. Consequently, changes to the annual charges under the low fixed charge option for the average8 residential consumer must be no more than the changes to the annual charges incurred under the standard option for the same consumer.
POWERCO’S PRICING OBJECTIVE AND PRACTICE
14. Powerco’s principal objective when allocating its annual revenue requirement is to set prices to ensure that the company recovers its operating and recoverable cost (chiefly transmission costs) and earns the permitted regulatory return on (and of) its capital. 15. When determining its prices, Powerco balances a number of considerations, including:
the price signals or incentives required to ensure efficient use of the network;
the ability of consumers/retailers to respond to these signals or provide these same signals without dilution to end consumers;
minimising business risk, particularly in relation to costs that are outside Powerco’s control;
the need to take account of customer preferences and the effect of rate shocks when adjusting rates;
the transaction and compliance costs that affect its stakeholders;
the expectations of its shareholders; and
the need to comply with all legal requirements.
16. Because Powerco has grown through mergers and acquisitions it has inherited
different pricing methodologies and pricing groups from its predecessor businesses. In order to achieve greater equity, and reduce transaction costs, Powerco has been gradually moving towards greater alignment of its pricing methodologies and fewer customer groups. By 2010 37 price groups had been consolidated into 16 groups. Powerco is currently undertaking a pricing review with the aim of better aligning its Eastern and Western pricing methodologies, consistent with the Electricity Authority’s
7
The adjustment reset the 2010-15 default price-quality paths for 16 electricity distributors,.
8
Average consumer is defined as an 8000 kWh per annum consumer in accordance with the Electricity (Low Fixed Charge Tariff Option for Domestic Consumers) Regulations 2004.
Powerco Limited | Electricity Pricing Methodology 2013 13 pricing principles and draft decision-making and economic framework, and the
requirements of the Electricity Distribution Information Disclosure Determination 2012.
4. CHANGES TO THE METHODOLOGY
17. There have been no material changes to Powerco’s pricing methodology since the previous methodology was published in March 2012. From 1 April 2013 we have, however, incorporated some minor tariff rationalisation and adjustments as detailed below.
18. In the Eastern region we have reclassified the V24 and T22 load groups in the Valley and Tauranga regions respectively from “3 Phase 100 Amps to 3 Phase 250 Amps” to “greater than 3 Phase 60 Amps to 3 Phase 250 Amps”. This change was implemented to make it explicit that any fuse sizes greater than 3 Phase 60 Amps were to be
classified as V24 or T22.
19. In the Eastern region we have created a new tariff option of 24DG for the T05, T06, V05 and V06 load groups. This tariff option is only for separately metered export volumes and has been created to allow retailers to submit volumes separately from any connections that have the ability to generate and inject electricity into Powerco’s network.
20. Across the Eastern and Western regions we have reviewed and revised a number of loss factors to reflect the average reconciliation losses over the previous 24 month period. Specifically, in the Valley network area we have revised the loss factors for the loss factor codes VYLALV, and VYMALV. In the Western region we have revised the loss factors for the loss factor codes BPE, BRK, CST, GYT, HUI, LTN, NPL, MGM, MST, MTN, MTR, OKN, SFD, WGN, and WVY.
21. In the Tauranga network we have migrated 88 ICPs from the closed load group of T43 (300 – 1,499 kVA) to the equivalent T50 (300 – 1,499 kVA) load group. This is part of an ongoing process to migrate ICPs from the legacy load group of T43 (which has a combination of variable and fixed charges and has been closed to new connections since 1 April 2005) to the T50 load group where the charges are individually
determined and, as a result, more cost reflective.
22. With regard to the changes outlined in paragraph 16, to minimise the impact on existing consumers in this price category, Powerco decided that this change would only apply to existing connections where the potential increase to the lines charges was less than or equal to 25%9. This approach was discussed in our consultations with retailers before being implemented and no feedback was received that suggested that any alternative approach was preferred. We will continue to migrate the remaining connections from the T43 to the T50 load group in future pricing years and regularly consult with retailers with regard to the further transitional arrangements.
9
Powerco Limited | Electricity Pricing Methodology 2013 14 23. In the Thames Valley network we have re-balanced the fixed and variable charges for
the V24 and V28 load groups in order to reduce the disparity between the fixed charges for these load groups and the equivalent fixed charges for the load groups of T22 and T24 in the Tauranga region. In order to minimise the rate shocks to individual connections this re-balancing will be implemented in stages over the next three pricing years. We will consult with retailers during each stage of this process.
24. In the Tauranga network we have cancelled the CTUD dual meter tariff option for the T06U/T06C load groups and migrated these connections to the equivalent 24UC tariff option. The CTUD tariff option was historically only for commercial connections in the T20 load group (greater than 3 Phase 20 amps) and has been closed to new
connections since 1 April 2010 – this was because, in April 2010, the commercial load group of T20 merged with the mass market load group of T06 which consequently required us to create an equivalent CTUD tariff option for the T06 load group for transitional purposes only.
25. In the Western region we have reduced the daily fixed charge for connections in the E1C load group from 10 cents/day to 0 cents/day. This change was introduced to provide increased load control incentives to the connections on our Western network which have some form of controllable load10 and to more closely align the incentives between Powerco’s Eastern and Western regions. During our consultations a number of retailers supported increasing the incentive but suggested that a variable pricing signal (like the CTRL tariff option in the Eastern region) would be a more efficient method of sharing the benefits of controllable load with consumers. This was duly considered, but the nature of Powerco’s pricing methodology in the Western region limits our ability to achieve this change. Therefore, the only viable option to provide an increased incentive within the existing methodology was to reduce the daily fixed charge.
26. In the Western region we have revised the definition of the E100 and E300 price categories from “connections with installed capacity of less than 300 kVA” and “connections with installed capacity of 300 kVA and greater” respectively to
“connections with installed capacity of less than or equal to 300 kVA” and “connections with installed capacity of greater than 300 kVA”. These changes were made to
remove an existing anomaly in the applicable price category for any connections with 300 kVA of connected capacity. This has resulted in 21 connections with 300 kVA of installed capacity being migrated from the E300 to the E100 price category. In order to mitigate the impact of this change only connections that had an increase of less than 10% were migrated this year. Transitional arrangements for the remaining four connections will be discussed with retailers in due course.
27. In the Western region, for a small number of large commercial/industrial connections in the SPECIAL load group we have chosen to apply a power factor charge11 from 1 May 2013. This was is in response to Powerco noticing a deteriorating power factor among these specific connections and to better align the treatment of power factor charges across the Western and Eastern regions. The charge provides an incentive for the
10As defined in Powerco’s Price Schedule which can be found at:
http://www.powerco.co.nz/Publications-and-Disclosures/Pricing-Schedules/Electricity/ 11
Powerco Limited | Electricity Pricing Methodology 2013 15 consumer to take some form of corrective action. Powerco has provided three months’ notice of this charge applying to allow sufficient time for the consumer to take the necessary steps to remedy the situation prior to the charge applying (if they choose to do so).
28. This document has also been revised to include more information that may be helpful to the Electricity Authority, Commerce Commission, consumers and interested persons.
5. OVERVIEW OF THE PRICING METHODOLOGY
29. Two different pricing methodologies continue to be used across Powerco’s network. The Western Region (as highlighted below) uses a Grid Exit Point (GXP) methodology which can be considered a wholesale delivery model and the Eastern Region uses an Installation Control Point (ICP) methodology which can be considered a retail delivery model.
30. These two methods have a number of differences, but the principal difference is the way that quantities for charges are measured.
Map of Powerco’s Eastern and Western Regions12
OVERVIEW OF THE WESTERN REGION METHODOLOGY
31. A GXP methodology applies in the Western Region covering Taranaki, Wanganui, Rangitikei, Manawatu, Tararua and Wairarapa. The GXP methodology is a wholesale delivery model whereby quantities are derived using reconciled GXP volumes which are then allocated to retailers based on their relevant share.
32. Powerco has three distinct price categories in the Western region. The price category E1 is for all residential consumers and most commercial customers, the price category
12Figures from Powerco’s Asset Management Plan 2012-2020.
Eastern Region1 146,502 ICPs 12,797 km of line/cable 2,321 GWh of energy conveyed Western Region1 174,385 ICPs 18,044 km of line/cable 2,318 GWh of energy conveyed
Powerco Limited | Electricity Pricing Methodology 2013 16 E100 is for commercial customers with installed capacity of 100 kVA or greater (up to and including 300 kVA), and the price category E300 is for commercial customers with installed capacity of greater than 300 kVA.
33. These price categories were defined as such due to the different levels of demand that each of these consumer groups place on particular components of the network such as sub-transmission, high voltage (11kV), and low voltage (400V) assets and the on-site assets at each connection. For example, in most cases a mass market (E1) connection makes use of all network assets but has limited on-site assets, whereas an industrial connection in the E300 price category has many more on-site assets but makes limited use of the low voltage (400V) network assets. The use of these consumer groups makes it possible to more accurately recover the costs actually incurred by different classes of customer.
34. Each price category in the Western region has different tariffs by region which reflect a grouping of GXPs with similar characteristics such as network density and
geographical location. High density networks typically have lower costs per customer than low density networks.
35. Essentially all sales for service take place at the GXP. Volumes and demand data for industrial consumers, normally 11kV network users, are calculated from half hour metering data, adjusted for losses, with the balance of volume and demand inputs derived from the reconciliation process and retailer ICP counts accessed from the industry registry.
36. For the majority of consumers, minimal market segmentation occurs under the GXP method, which should reduce barriers to a competitive retail market and promote innovation in retailer designed consumer tariffs.
OVERVIEW OF THE EASTERN REGION METHODOLOGY
37. An Installation Control Point (ICP) methodology is used for the Eastern Region. This methodology has not been significantly altered since the acquisition of the
UnitedNetworks (UNL) networks in the Tauranga, Thames Valley and Coromandel regions in 2002.
38. This methodology is a retail delivery model whereby the sale for service takes place at the consumer’s metering point.
39. Powerco has two separate price schedules in the Eastern region reflecting the tariff structure since the acquisition of the UNL networks in 2002. These different schedules are based on geographical location of our consumers and are defined as Thames Valley (or Valley, which includes the Coromandel) and Tauranga.
40. Each of these price schedules consist of around six different price categories, again reflecting the tariff structure since the acquisition of the UNL networks in 2002. The price categories are:
1. T01/T02 and V01/V02 − for all unmetered connections in the Valley and Tauranga regions;
2. T05/T06 and V05/V06 − for all residential consumers and small commercial consumers with a fuse size of 3 Phase 60 Amps or less;
Powerco Limited | Electricity Pricing Methodology 2013 17 3. T22/V24 − for commercial customers with a fuse size of greater than 3 Phase 60
Amps up to and including 3 Phase 250 Amps;
4. T24/T41/V28 − for commercial customers with an installed capacity of 200 – 299 kVA;
5. T43/T50/V40 − for commercial customers with an installed capacity of 300 – 1499 kVA; and
6. T60/V60 − for commercial customers with an installed capacity of 1,500 kVA and greater.
41. These price categories were defined around consumer groups with similar load characteristics such as installation type (such as Unmetered, Non-Half Hour (NHH), and Half Hour (HH)), fuse size and installed capacity of the consumer’s installation. 42. The granularity of the groupings for each price category will always be a trade-off
between practicality, fairness and cost reflectiveness and Powerco will continue to consult with retailers and consumers to ensure an appropriate balance is maintained. 43. This ICP based methodology is more consistent with retailer tariffs and consequently
makes it possible to provide a greater number of targeted price signals to specific groups or individual market segments of consumers to encourage efficient use of the network.
6. POWERCO’S PRICING STRATEGY
44. Powerco grew rapidly from its first merger in 1995, to its current footprint, which incorporates eleven businesses that existed in the late 1980s. The focus of pricing since the last merger in 2002 has been a consolidation from 47 to 16 price categories. This change has been driven by administrative efficiency and the desire to treat customers equitably.
45. An important principle of the consolidation process was to minimise the impact on consumers and retailers. For example, Powerco operates quite different pricing methodologies in its Eastern and Western regions and the pricing methodology for the Eastern Region has not been substantially changed since it was inherited by Powerco in 2002. Rather than adopting a “big bang” approach to align pricing, Powerco has followed an incremental strategy, thereby minimising the change for consumers and retailers.
46. In 2010, the first stage of the consolidation process was completed. Powerco is now undertaking a pricing review with the aim of better aligning Eastern and Western pricing and preparing Powerco to respond to future challenges and opportunities, including those created by regulatory changes, and technological developments, such as the roll out of advanced metering infrastructure. How consumer prices might change as a result of this review is not yet known.
47. Until the pricing review has been completed, Powerco will continue to use its existing pricing methodology. Changes to electricity line charges with effect from 1 April 2013 reflect increases in charges that result from the Commerce Commission’s 30
November 2012 starting price adjustment13,and a pass through of increases to specific
13
Powerco Limited | Electricity Pricing Methodology 2013 18 pass through and recoverable costs, which include transmission charges
(Transpower’s interconnection and connection charges, Transpower’s charges under customer investment contracts and avoided cost of transmission (ACOT) payments to embedded generators), local authority rates, and Commerce Commission and
Electricity Authority levies.
48. Powerco’s medium term pricing objective is to achieve better alignment between four revenue requirement by price category and region and the underlying cost of supply. Accordingly, from 1 April 2013, a number of price categories across the Western and Eastern regions have had a slightly higher (or lower) than average increase in order align the resulting revenue more closely to the outputs of the cost of supply model. To minimise the impact of this realignment on retailers and consumers, Powerco is making these adjustments over a three to five year period.
7. SUMMARY OF PRICING PROCESS
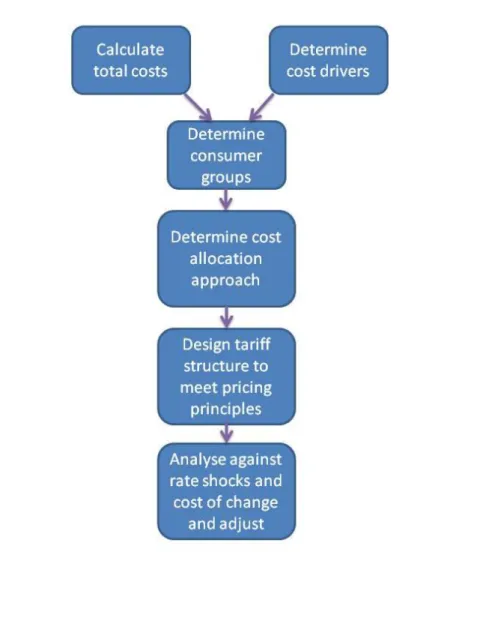
49. The pricing process is summarised in diagram 1. Diagram 1: Overview of the pricing process
Powerco Limited | Electricity Pricing Methodology 2013 19 50. A description of the pricing process is:
calculate total costs for the relevant period; these include transmission costs (including ACOT), capital costs, operating costs, maintenance costs and administration costs;
determine the key drivers of network expenditure;
determine suitable groupings of connections across each network based on similarities of network and consumer characteristics such as geography,
rural/urban connection density, mains size, protection rating and/or transformer capacity;
determine the allocation of costs (such as operating costs, transmission costs and cost of capital) across each network and tariff category;
calculate prices based on the relevant cost allocations, ensuring compliance with the relevant legal requirements;
assess the pricing structure to take account of the effect of rate shocks and adjust as needed.
8. QUANTIFICATION OF KEY COMPONENTS OF COSTS AND REVENUES
51. The key components of network costs and revenue for Powerco’s Eastern and Western Regions are summarised below. Network assets, customer density and system length largely drive these costs. Consequently, these costs are largely fixed and independent of the volume of electricity consumed across our network.
OPERATING COSTS
52. These are costs associated with the provision of electricity distribution services, including:
statutory charges and levies (excluding those that are pass through costs);
network planning and asset management costs;
network management and dispatch costs;
network operation costs;
the cost of support services such as billing, record management, planning, contract administration, regulatory compliance and resource costs;
depreciation on electricity lines business assets; and
tax.
53. Detailed information on Powerco’s historical costs are disclosed each year in Powerco’s annual information disclosure to the Commerce Commission. This information is publicly disclosed on Powerco’s website, including by cost category. 54. Powerco’s asset management plan contains forecasts of capital and operating
expenditure over a ten year period which helps to form a view of future costs. This information is also publicly disclosed on Powerco’s website.
55. Powerco’s operating costs relating to the electricity business are allocated directly to each relevant region. Where this is not possible, the allocation between regions is based on each region’s total optimised replacement cost (ORC).
Powerco Limited | Electricity Pricing Methodology 2013 20 56. Powerco’s indirect operating costs relating to the electricity business are allocated
between regions and customer groups using a weighted average of each group’s contribution to system demand and ICP numbers.
TRANSMISSION COSTS
57. These are the costs charged by Transpower for transmission services and those charged by other parties that provide services that substitute for transmission or distribution services. Transmission costs include Transpower’s interconnection, connection and new investment charges and any avoided cost of transmission (ACOT) payments made by Powerco.
58. Transmission costs are allocated between customer groups using a weighted average of the regional coincident maximum demand (based on the 100 regional coincident peak demands) attributable to each load group and the number of ICPs within each load group.
COST OF CAPITAL
59. This is the cost of capital (both debt and equity) invested in Powerco. Powerco requires large amounts of capital to maintain and develop network assets to meet increased demand, satisfy quality standards and legal compliance requirements, and achieve performance targets for safety and reliability. Historical capital expenditure by drivers (e.g. system growth, replacement and renewal) is available on Powerco’s website.
60. Powerco’s asset management plan provides a large amount of detail on the drivers of capital expenditure for the network.14
61. Capital costs are allocated between regions based on the optimised replacement cost of the assets within each group.
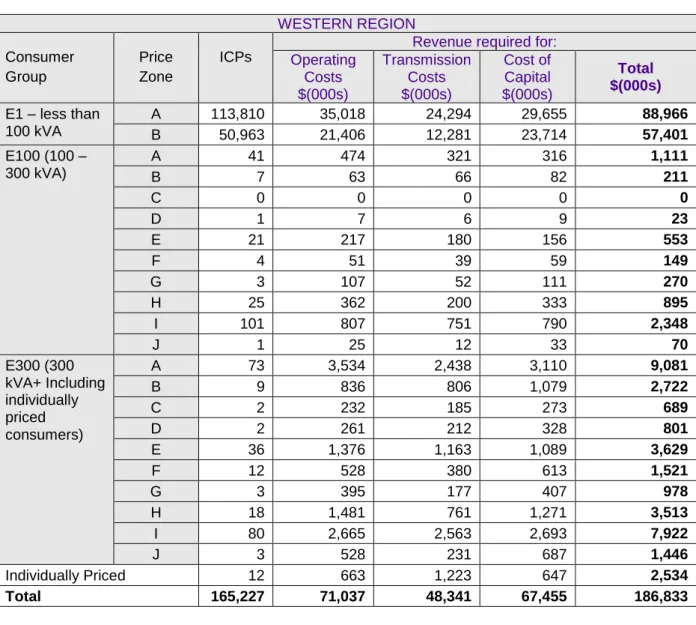
SUMMARY OF KEY COMPO NENTS OF TARGET REVENUE
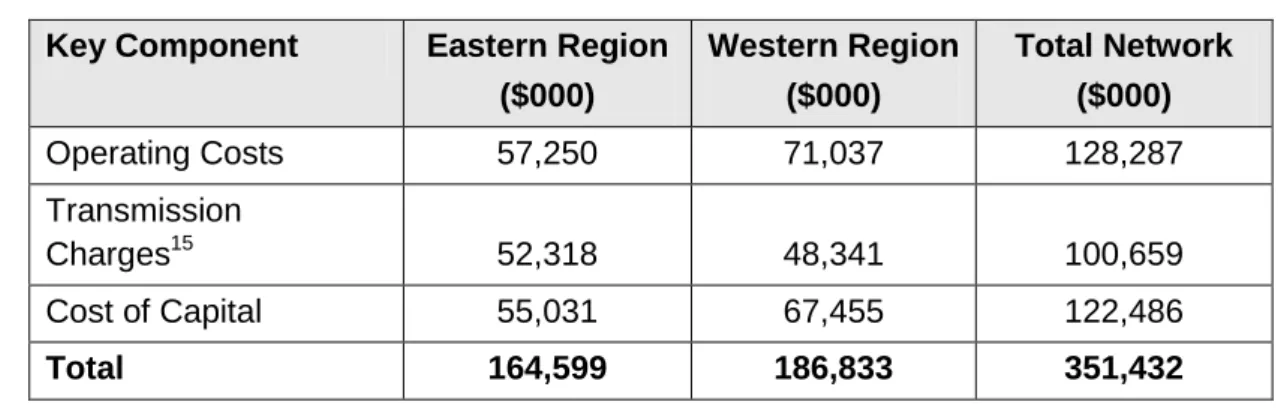
Table 1: The numerical value of each of the key components of Powerco’s target revenue for the 2013/14 financial year
Key Component Eastern Region
($000) Western Region ($000) Total Network ($000) Operating Costs 57,250 71,037 128,287 Transmission Charges15 52,318 48,341 100,659 Cost of Capital 55,031 67,455 122,486 Total 164,599 186,833 351,432
14Section 2 of Powerco’s 2012 Asset Management Plan, available at
www.powerco.co.nz.
Powerco Limited | Electricity Pricing Methodology 2013 21
9. EASTERN REGION PRICING METHODOLOGY
CONSUMER GROUPS
RATIONALE FOR CONSUMER GROUPS
62. Powerco uses six consumer groups in the Eastern Region for pricing purposes:
T01/T02 and V01/V02 − for all unmetered connections such as streetlights in the Valley and Tauranga regions;
T05/T06 and V05/V06 − for all residential consumers and small commercial consumers with a fuse size of 3 Phase 60 Amps or less;
T22/V24 − for commercial customers with a fuse size of greater than 3 Phase 60 Amps up to and including 3 Phase 250 Amps;
T24/T41/V28 − for commercial customers with an installed capacity of 200 – 299 kVA;
T43/T50/V40 − for commercial customers with an installed capacity of 300 – 1499 kVA; and
T60/V60 − for commercial customers with an installed capacity of 1,500 kVA and greater.
63. These price categories are based around consumer groups with similar load characteristics such as demand, fuse size and installed capacity of the consumer’s installation as well as groups which use specific sets of assets. Annex A provides information on the characteristics of the network and consumers in the Eastern Region.
64. The characteristics of each consumer group are provided in Table 2. Ideally Powerco would have more information on anytime maximum demand and on peak demand. However, this information is only available for connections that have half hour meters and therefore assumptions on the load profile of the remaining consumer connections have to be made.
65. The T01/T02 and V01/V02 price categories are for unmetered streetlights which, due to the unmetered nature of the load and the associated dedicated equipment, require special consideration when determining our revenue requirement.
66. The T05/T06 and V05/V06 price categories are for all residential consumers and small commercial consumers with a fuse size of 3 Phase 60 amps or less. Any consumers with a fuse size of up to 3 Phase 60 Amps are typically considered to be residential or small commercial consumers and, as such, individually place minimal demands on our network and require minimal investment in on-site and upstream assets.
67. The T22/V24 price categories are for connections with a fuse size of greater than 3 Phase 60 amps up to 250 amps. Any connections with these fuse sizes are typically commercial consumers with higher average volumes than the T05/T06 and V05/V06 price categories. Therefore, this group places increased demands on different components of our network and requires a slightly larger investment in on-site and upstream assets.
Powerco Limited | Electricity Pricing Methodology 2013 22 68. The T24/T41/V28 price categories are for connections with an installed capacity of
greater than 200 kVA up to 299 kVA. Any connections with this level of installed capacity are typically medium sized commercial consumers with significantly higher average volumes than the T22/V24 price categories. Therefore, this group places increased demands on the upstream network assets and requires a slightly larger investment in on-site and upstream assets.
69. The T43/T50/V40 price categories are for connections with an installed capacity of greater than 300 kVA up to 1,499 kVA. Any connections with this level of installed capacity are typically large commercial consumers which require dedicated
transformers and associated switch gear to meet their supply requirements.
70. The T60/V60 price categories are for connections with an installed capacity of greater than 1,500 kVA. Any connections with this level of installed capacity are typically very large commercial/industrial consumers which place increased demand on upstream network assets and require dedicated on-site transformers and dedicated feeders to meet their supply requirements.
71. Because connections in the V40, T50, T60 and V60 price categories typically require dedicated on-site and upstream assets they are all individually priced based on their specific on-site and upstream assets and contribution to peak demands. While these consumers are charged a constant daily rate this rate is reviewed each year based on the consumer’s previous year’s peak demands. This ensures that their charges are regularly updated to reflect their individual contribution to network costs.
72. The ICP pricing methodology more closely reflects retailer tariffs and consequently makes it possible to provide a greater number of targeted price signals to specific groups or individual market segments of consumers to encourage efficient use of the network.
73. Powerco’s charges are structured so that the fixed revenue component increases as the connected capacity of each price category increases. This is to ensure that our overall charges reflect the level of demand that consumers place on different components of our network such as sub-transmission, high voltage (11kV) and low voltage (400V).
74. The granularity of the groupings for each price category will always be a trade-off between practicality, fairness and cost reflectiveness and Powerco will continue to consult with retailers and consumers to strike the preferred balance.
METHOD FOR DETERMINING THE ALLOCATION OF CONSUMERS
75. Consumers in the Eastern Region are allocated to one of the two distribution networks of Valley and Tauranga based on the grid exit point that is associated with the
consumer’s ICP.
76. Consumers are then allocated into an appropriate price category based on the market segment attributable to the consumer, mains size, dedicated transformer capacity, metering type and/or availability of controllable load (as shown in diagram 2).
Powerco Limited | Electricity Pricing Methodology 2013 23 Diagram 2: Overview of the price category allocation process
77. Once allocated, price categories are published for each and every ICP on the
Electricity Registry16 to enable retailers and other parties to determine the distribution charges that apply for that ICP.
16 https://www.electricityregistry.co.nz Eastern Valley Residential
Low User Uncontrolled V05U Controlled V05C Standard Uncontrolled V06U Controlled V06C Commercial <=3 Phase 60 Amps Uncontrolled V06U Controlled V06C Streetlights V01/V02 > 3 Phase 60 Amps up to 3 Ph 250 Amps V24 200 - 299 kVA V28 300 - 1,499 kVA V40 1,500 + kVA V60 Tauranga Residential
Low User Uncontrolled T05U Controlled T05C Standard Uncontrolled T06U Controlled T06C Commercial <=3 Phase 60 Amps Uncontrolled T06U Controlled T06C Streetlights T01/T02 > 3 Ph 60 Amps up tp 3 ph 250 Amps T22 200 - 299 kVA NHH Metering T24 HH Metering T41 300 - 1,499 kVA T50 1,500 + kVA T60
Powerco Limited | Electricity Pricing Methodology 2013 24 Table 2: Statistics for Eastern Region consumer groups used in the pricing methodology
Region Consumer Group ICPs
Volume (MWh) Anytime Maximum Demand (kW) On Peak Demand (kW)
Tauranga Unmetered Streetlights 289 8,921 Residential & Small
Commercial 73,651 598,959
3 Phase 100 Amps up to and including 3 Phase 250 Amps 237 28,907 200 - 299 kVA 131 31,675 300 - 1,499 kVA 183 160,693 52,206 21,452 1,500 kVA + 21 105,812 31,234 15,247 Total 74,511 934,967 83,440 36,699
Valley Unmetered Streetlights 130 5,292 Residential & Small
Commercial 67,005 542,686
3 Phase 100 Amps up to and including 3 Phase 250 Amps 387 52,981 200 - 299 kVA 31 7,873 300 - 1,499 kVA 70 55,748 16,553 6,944 1,500 kVA + 25 610,682 134,044 80,348 Total 67,647 1,275,262 150,597 87,292
COST ALLOCATION METHODOLOGY
78. Powerco has recently developed a cost of supply model for the Eastern Region, but given the high priority which consumers and retailers place on price stability, the method of revenue allocation has not changed materially since the acquisition of the network from UnitedNetwork Ltd in 2002.
79. The cost of supply model uses a number of key inputs and cost drivers to determine the appropriate allocation of costs between the relevant consumer groups. The key allocators contained within this model are:
average number of connected ICPs;
coincident maximum demand (CMD);
installed kVA;
optimised replacement cost (ORC);
contribution to system demand and ICP numbers, which is used in the determination of GXP cost allocation; and
Powerco Limited | Electricity Pricing Methodology 2013 25 contribution to coincident maximum demand and ICP numbers, which is used in
the allocation of costs between load groups.
80. For the purposes of cost allocation the cost of supply model aggregates costs into one of three groups rather than the six price categories mentioned earlier. This is to allow consistency between regions and to simplify the resulting analysis. The three groups consist of:
mass market (which includes unmetered, residential and small commercial consumer groups);
commercial consumers with a capacity greater than 69 kVA but less than 299 kVA;
commercial consumers with a capacity greater than or equal to 300 kVA (this includes individually priced consumers in the V40, T50 , V60 and T60 groups). 81. Where possible, Powerco’s operating costs in relation to the electricity business are
allocated directly to each relevant region. Where this is not possible the allocation between regions is based on each region’s optimised replacement cost (ORC).
82. Transmission costs are allocated directly to each relevant region due to the fact that all costs can be directly attributed to specific GXPs. Capital costs are allocated to regions based on the optimised depreciated replacement cost (ODRC) of the assets within each group.
83. Powerco’s operating costs, transmission costs and capital costs are then subsequently allocated between price categories using a 80:20 weighted average of the contribution to regional coincident peak demand and ICP numbers for each group in accordance with the formula below:
( ) ∑ ( ) where A is the cost allocator;
I is the number of ICPs for each price category i;
D is the contribution to regional coincident peak demand for each price category i. 84. Given the data available, this approach is reasonably cost-reflective and provides
some incentive to flatten peak demands. Powerco could use other methods, such as only ICP numbers or electricity volume. However, these allocators are not as related to cost drivers and would not send as good a price signal.
85. Table 3 provides a summary of the allocation factors used in the cost of supply model to allocate costs between regions and price categories for the Eastern region.
Powerco Limited | Electricity Pricing Methodology 2013 26 Table 3: Summary of the factors used to allocate the costs of Powerco’s lines business activities by key revenue components to each consumer group for the relevant financial year
EASTERN REGION Distribution
network
Consumer Group Allocator for:
Operating Costs
Transmission
Costs Cost of Capital
Tauranga Mass market (Including
Unmetered ICPs) 35.4% 36.3% 36.4% 69 – 299 kVA 1.4% 1.7% 1.5% 300 kVA + (including individually price consumers) 8.3% 10.0% 8.9%
Valley Mass market (including
unmetered ICPs) 40.6% 32.2% 40.2% 69 – 299 kVA 0.9% 1.0% 1.0% 300 kVA + (including individually priced consumers) 13.5% 18.8% 12.0%
QUANTIFICATION OF KEY COMPONENTS OF COST S AND REVENUES 86. The key components of costs and revenues are described in paragraphs 51 - 61. The
breakdown of these costs into consumer groups is provided in Table 4. Table 4: Powerco’s target revenue for the 2013/14 financial year by consumer group
EASTERN REGION Distribution
network
Consumer Group ICPs Revenue required for:
Operating Costs $(000s) Transmission $(000s) Cost of Capital $(000s) Total $(000s) Tauranga Mass market
(Including Unmetered ICPs) 73,939 20,241 19,000 20,040 59,281 69 – 299 kVA 368 811 907 830 2,548 300 kVA + 203 4,679 5,113 4,868 14,659 Individually Priced 1 54 115 56 224
Powerco Limited | Electricity Pricing Methodology 2013 27 EASTERN REGION
Distribution network
Consumer Group ICPs Revenue required for:
Operating Costs $(000s) Transmission $(000s) Cost of Capital $(000s) Total $(000s) Valley Mass market
(including unmetered ICPs) 67,135 23,238 16,826 22,100 62,164 69 – 299 kVA 418 526 509 545 1,580 300 kVA + 88 5,320 1,398 4,555 11,273 Individually Priced 7 2,380 8,451 2,038 12,870 Total 142,157 57,250 52,318 55,031 164,599
FIXED AND VARIABLE CHARGES
87. In Powerco’s Eastern region consumers are typically charged a two-part tariff which consists of a variable (cents/kWh) tariff and a fixed charge ($/day). The only
exceptions are the V40, T50, V60, and T60 price categories where the tariffs consist of only a fixed charge.
88. Consumers in the V40, T50, V60, and T60 price categories are typically very large commercial/industrial consumers which require dedicated on-site and upstream assets (such as dedicated feeders and transformers) to meet their supply requirements. Therefore, their charges are determined on an individual basis and are fixed to ensure that an appropriate level of return on investment is made by Powerco.
89. From an economic point of view, a two-part tariff should ideally be structured such that all marginal costs are charged based on a variable basis and all other costs on a fixed basis (so as not to distort behaviour). However, marginal costs are typically small (zero if spare capacity exists) which would result in the majority of charges being fixed. 90. However, an economically pure single fixed charge would not provide consumers with
any incentive to manage their consumption and therefore would likely result in substantial growth which would put increased pressure on our network and increase the need for future capital expenditure. A high fixed charge would also act as a significant deterrent to existing and potential customers.
91. Powerco wishes both to promote the economically efficient use of our network and encourage organic growth. Therefore our charges are designed to allow end-consumers the opportunity to modify their behaviour to enable the efficient use of network assets. The roll out of advanced metering infrastructure may allow us in future to send a stronger price signal based on peak demand, rather than solely volume as at present.
92. Powerco’s tariff structure in the Eastern region has been designed so that connections with higher connected capacity have a higher fixed component than connections with
Powerco Limited | Electricity Pricing Methodology 2013 28 lower connected capacity. This benefits both Powerco and its customers by making charges more predictable and more closely related to the actual cost of supply. 93. This approach also helps to ensure that no perverse incentives exist for customers to
under or over state their capacity requirements in order to alter their allocated load group. The larger capacity price categories have the bulk of the charges fixed, while lower capacity connections have the fixed component set at around 25% of their total line charge (as shown in Table 5).
94. However, Powerco’s ability to amend the existing fixed and variable rate structure is somewhat restricted by the limitations imposed on residential fixed charges by the Electricity (Low Fixed Charge Tariff for Domestic Consumers) Regulations 2004, the constraint imposed on total revenue by the Commerce Act (Electricity Distribution Default Price-Quality Path) Determination 2010 and Powerco’s own policy of avoiding price shocks to end-consumers. Consequently, Powerco determines the proportion of fixed and variable charges by reference to existing rates while recognising the largely fixed nature of the underlying costs. Regulations have a large influence on the level of the fixed and variable components for residential groups.
Powerco Limited | Electricity Pricing Methodology 2013 29 Table 5: Powerco’s target revenue requirement split by fixed and variable charge components to each consumer group for the relevant financial year
EASTERN REGION Distribution
network
Consumer Group
Price Category Revenue split
Fixed Variable
Tauranga Mass market (Including Unmetered ICPs)
Unmetered (T01/T02) 71.6% 28.4% Low Usage (T05U/T05C) 11.8% 88.2% Standard (T06U/T06C) 20.5% 79.5% 69 – 299 kVA 3 Phase 60 – 3 Phase
250 Amps (T22) 27.6% 72.4% 200 – 299 kVA (T24) 59.1% 40.9% 200 – 299 kVA (T41) 21.7% 78.3% 300 kVA + (including individually price consumers) 300 – 1,499 kVA (T43) 17.2% 82.8% 300 – 1,499 kVA (T50) 97.4% 2.6% 1,500 kVA + (T60) 96.6% 3.4%
Valley Mass market (including unmetered ICPs)
Unmetered (V01/V02) 92.2% 7.8%
Low Usage (V05U/V05C) 10.6% 89.4% Standard (V06U/V06C) 25.6% 74.4% 69 – 299 kVA 3 Phase 60 – 3 Phase
250 Amps (V24) 57.7% 42.3% 200 – 29 kVA (V28) 78.5% 21.5% 300 kVA + (including individually priced consumers) 300 – 1,499 kVA (V40) 95.9% 4.1% 1,500 kVA + (V60) 98.0% 2.0%
TREATMENT OF RENTAL REBATES
95. Transpower’s rental rebates associated with operation of its HVAC network are excluded from the bundled tariffs and are passed through to retailers directly. Further information in regards to this process can be found in Powerco’s electricity pricing schedule (which is available at: http://www.powerco.co.nz/Publications-and-Disclosures/Pricing-Schedules/Electricity/Powerco’s website).
Powerco Limited | Electricity Pricing Methodology 2013 30 SHARING VALUE OF DEFERRAL OF INVESTMENT
96. Powerco recognises that the ability to control and shift load during peak times via load signalling equipment has the potential to defer investment.
97. Because of this potential to defer investment Powerco continues to offer a number of tariff options such as AICO and CTRL in the Valley and Tauranga distribution networks that provide discounts to consumers based on the availability and degree of load control at the consumer’s ICP.
98. Powerco also provides a number of discounted “NITE” tariff options within these networks which are designed to incentivise consumers to shift load from peak to off-peak periods in order to flatten off-peaks and consequently reduce the need for new investment. A detailed description of these tariffs is available on Powerco’s website. 99. Powerco continues to encourage embedded and distributed generation by providing
payments to generators equivalent to Powerco’s avoided costs of transmission (subject to Powerco’s Distributed Generation (DG) Policy).
Powerco Limited | Electricity Pricing Methodology 2013 31 10. WESTERN REGION PRICING METHODOLOGY
CONSUMER GROUPS
RATIONALE FOR CONSUMER GROUPS
100. Powerco uses three price categories of consumer group for cost allocation and charging purposes in the Western Region. The three categories are:
E1, which applies to all connections with a connected capacity of less than 100 kVA connections (which includes unmetered connections);
E100, which applies to all connections with a connected capacity of between 100 and 300 kVA;
E300, which applies to all connections with a connected capacity of greater than 300kVA (which includes connections with individually assessed pricing). 101. These price categories are based around groups of consumers with similar
characteristics relating to their installed capacity and associated demand as these groups place different demands on different components of our network such as sub-transmission, high voltage (11kV) and low voltage (400V) network assets as well as onsite assets such as transformers and associated switchgear. Annex A provides information on the characteristics of the network and consumers in the Western Region.
102. The characteristics of each consumer group are provided in Table 6. Ideally, Powerco would have more information on anytime maximum demand and on peak demand but currently this information is only readily available for connections with half hourly metering. Where this information is not available assumptions have been made about the load profiles of the relevant consumers.
103. The E1 price category is for all connections with a connected capacity of less than 100 kVA which represents all residential and the majority of commercial consumers. The E1 price category has been limited to less than 100 kVA to provide a relatively simple price structure for the vast majority of consumers while excluding all connections which require dedicated on-site and/or up-stream assets.
104. The E100 price category is for all connections with a connected capacity of between 100 and 300 kVA, which equates to medium-large commercial consumers. This price category has been defined because connections with this level of capacity place different levels of demand on different components of our network assets such as sub-transmission, high voltage (11kV) and low voltage (400V) assets and typically require dedicated on-site assets such as transformers and associated switchgear.
105. The E300 price category is for all connections with a connected capacity of greater than 300 kVA which equates to large commercial / industrial consumers. This price category has been defined because connections with this level of capacity place different levels of demand on different components of our network assets such as sub-transmission, high voltage (11kV) and low voltage (400V) assets and typically require a higher level of dedicated on-site and up-stream assets (such as transformers, switchgear and feeders) than the E100 price category.
106. The specification of separate price categories for the E100 and E300 groups makes the underlying costs of supplying these consumers more transparent.
Powerco Limited | Electricity Pricing Methodology 2013 32 107. In addition to these price categories Powerco also has non-standard charges which
apply in cases where our standard charges are not appropriate. This is typically only for connections with capacity greater than 1,500 kVA where there is significant network investment required for the connection and/or unique commercial arrangements that require special consideration. This is discussed in further detail in paragraphs 140 – 143.
RATIONALE FOR PRICING ZONES
108. Within each price category the individual charges are classified by a pricing zone which is a grouping of GXPs with similar characteristics such as rural/urban connection density and geographical location.
109. Pricing zones allow our tariff structure to have the ability to reflect the difference in the costs of supplying consumers within specific regions across the Western network. This allows us the ability to reflect a fairer allocation of the operating costs,
transmission charges and capital costs within each geographical location rather than across the entire network.
110. The E1 price category is split into two zones with Zone A being for all consumers supplied in the high density urban centres of New Plymouth, Wanganui and
Palmerston North and Zone B for all consumers supplied in the remaining low density and typically rural areas (as shown in diagram 3). These two zones have been defined to be based on the similar underlying cost structures across the GXPs within each zone while keeping the tariff structure relatively simple for consumers and retailers. Diagram 3: Map of Western Electricity Network
111. The E100 and E300 price categories are split into ten zones with each zone
representing a grouping of GXPs based on geographical proximity. For example, in diagram 3 the GXPs of Huirangi, Carrington St, New Plymouth, and Stratford are
Powerco Limited | Electricity Pricing Methodology 2013 33 grouped together into zone A. The number of zones represents Powerco’s preference for greater transparency of costs within this price category due to the impact that changes to individual consumer behaviour within these groups can have on the underlying cost structure.
112. The consumer groups and price zones used allow the specific underlying costs of supplying each consumer group and price zone to be more accurately reflected in our charges. these groupings represent a trade-off between the simplicity required to reduce processing costs and the level of complexity required to allocate costs while providing efficiency-promoting price signals to the relevant network users. Powerco regularly consults with customers to ensure that an appropriate balance is reached. METHOD FOR DETERMINING THE ALLOCATION OF CONSUMERS TO GROUPS
113. Consumers are allocated to a region and pricing zone based on the GXP that is associated with their connection (as shown in diagram 3).
114. Consumers are then allocated to a price category based on the installed capacity at their connection.
115. Once allocated, price categories are published for every connection on the Electricity Registry17 to enable retailers and other parties to determine the distribution charges that apply for that connection.
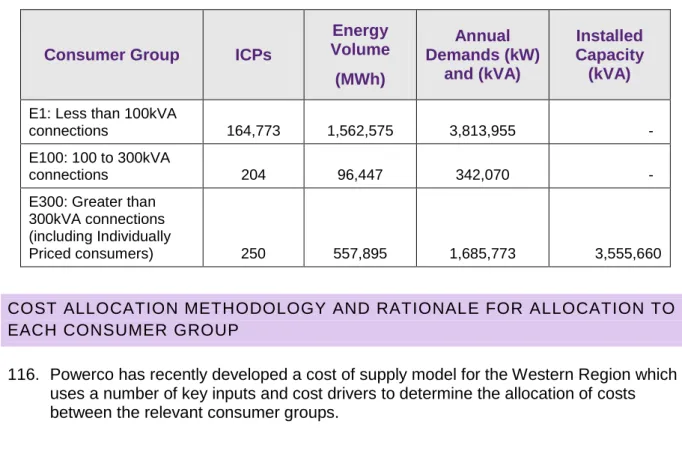
Table 6: Statistics for Western Region Consumer Groups used in the Pricing Methodology
Consumer Group ICPs
Energy Volume (MWh) Annual Demands (kW) and (kVA) Installed Capacity (kVA)
E1: Less than 100kVA connections 164,773 1,562,575 3,813,955 - E100: 100 to 300kVA connections 204 96,447 342,070 - E300: Greater than
300kVA connections (including Individually Priced consumers) 250 557,895 1,685,773 3,555,660
COST ALLOCATION METHODOLOGY AND RATIONALE FOR ALLOCATION TO EACH CONSUMER GROUP
116. Powerco has recently developed a cost of supply model for the Western Region which uses a number of key inputs and cost drivers to determine the allocation of costs between the relevant consumer groups.
17