A Temporal Channel for Information
in Sparse Sensory Coding
Nitin Gupta
1,2,*
and Mark Stopfer
1,*
1
National Institute of Child Health and Human Development,
National Institutes of Health, Bethesda, MD 20892, USA
Summary
Background:
Sparse codes are found in nearly every sensory
system, but the role of spike timing in sparse sensory coding is
unclear. Here, we use the olfactory system of awake locusts to
test whether the timing of spikes in Kenyon cells, a population
of neurons that responds sparsely to odors, carries sensory
in-formation to and influences the responses of follower neurons.
Results:
We characterized two major classes of direct
fol-lowers of Kenyon cells. With paired intracellular and field
po-tential recordings made during odor presentations, we found
that these followers contain information about odor identity
in the temporal patterns of their spikes rather than in the spike
rate, the spike phase, or the identities of the responsive
neu-rons. Subtly manipulating the relative timing of Kenyon cell
spikes with temporally and spatially structured
microstimula-tion reliably altered the response patterns of the followers.
Conclusions:
Our results show that even remarkably sparse
spiking responses can provide information through
stimulus-specific variations in timing on the order of tens to hundreds
of milliseconds and that these variations can determine the
re-sponses of downstream neurons. These results establish the
importance of spike timing in a sparse sensory code.
Introduction
Brain circuits encode sensory information into a variety of
neu-ral representations. These representations range from dense,
time-varying patterns of intense spiking in overlapping sets
of neurons to sparse spikes in just a few selective neurons.
Sparse codes are used by nearly all sensory systems [1],
including vision [2] (but see [3]), audition [4], somatosensation
[5], and olfaction [6]. In dense spiking codes, the precise timing
of spikes has been shown to contain sensory information [7],
but, despite the ubiquity of sparse codes in the brain, the
role of timing in the relatively few spikes in sparse sensory
codes is unknown. Here, we sought to answer the fundamental
question of whether the timing of sparsely firing neurons
con-veys sensory information to their follower neurons.
A remarkable example of sparse sensory coding is found in
the mushroom body, an area of the insect brain investigated
for roles in olfactory coding and associative learning [8–11].
Kenyon cells (KCs), the intrinsic neurons of the mushroom
body, receive olfactory input directly from projection neurons
(PNs) of the antennal lobe (analogous to mitral cells of the
olfactory bulb) (Figure 1A). Whereas any given PN shows
abun-dant spontaneous activity and responds to many odors with
dense patterns of spikes, KCs are nearly silent at rest and
respond selectively to odors, with very few spikes [12]. These
highly sparse responses are thought to be advantageous [1]
for distinguishing odors and learning associations [13].
Although these rare spikes may occur with different timing
relative to the odor presentation in different KCs [14], it is
un-known whether this timing is used downstream [13];
informa-tion in sparse sensory responses is thought to be coded by
the identities of the responding neurons. In motor areas, the
timing of sparse firing may be used to generate timed motor
sequences [15], but in sensory areas, sparse coding is viewed
as an outcome of rather than as a substrate for temporal
pro-cessing [12, 13]. For example, piriform cortex neurons, which
exhibit sparse responses [6] and are morphologically
analo-gous to KCs [16], are thought not to use temporal coding
[17], even though their responses are driven by a temporal
code in the olfactory bulb.
We tested whether the timing of sparse spikes in KCs carries
information to and affects the responses of downstream
neu-rons. We performed our experiments in the locust olfactory
system, which has been characterized in great detail in terms
of anatomy [18, 19], physiology [12, 20], and behavior [21, 22].
By using the types of odors that locusts can discriminate [22],
we observed responses of KCs with extracellular recordings
and found that the sparse spikes in KCs occur with
odor-spe-cific timing. We then characterized the followers of KCs in the
mushroom body by using intracellular dye labeling, mass fills,
and immunostaining. With intracellular recordings, we found
that these followers contain information about odor identity
in the temporal patterns of their spikes. Finally, by using
elec-trical microstimulation of subsets of KCs, we found that the
spike patterns in the followers are strongly affected by subtle
variations in the absolute or the relative timing of KC spikes.
Taken together, our results establish that even the remarkably
sparse spiking responses of KCs provide information through
odor-specific variations in timing on the order of tens to
hun-dreds of milliseconds and that these variations determine
re-sponses downstream.
Results
Odor-Specific Timing in KC Responses
Extracellular recordings from KCs in awake locusts confirmed
very low firing rates (0.05 Hz background, 1.21 Hz during odor
responses, n = 404 cell-odor combinations). Notably, the
timing of odor-elicited spikes relative to odor onset could
vary, sometimes by hundreds of milliseconds, with the identity
of the odor (Figure 1B1). Further, different KCs could respond
to the same odor with different timing (Figure 1B2). These
re-sults raise the possibility that timing carries sensory
informa-tion in the sparse spiking of KCs to downstream neurons.
Followers of KCs in the
b
Lobe of the Mushroom Body
To understand information transfer downstream of KCs, we
first needed to better characterize the projection patterns
and odor-elicited responses of follower neurons. KCs project
to lobes of the mushroom body, where they synapse onto
several types of cells, including
b
lobe neurons (bLNs) [9, 23–
25]. Our intracellular fills revealed several distinct classes of
bLNs (Figures S1
and
S2
available online). Our analysis
focused on the two classes, ‘‘bLN1’’ and ‘‘bLN2’’ (Figure 1C),
2Present address: Department of Biological Sciences and Bioengineering,
Indian Institute of Technology, Kanpur 208016, India
identified most frequently in our survey (19% and 60%,
respectively, of 83 intracellular fills). Immunostains for
g
-ami-nobutyric acid (GABA) were negative for bLN1, but the bLN2
population included both GABA-positive and GABA-negative
neurons (Figure 1D). Our fills of bLN2 showed that it sends
branches into the calyx of the mushroom body; whether these
branches receive input from KCs or provide feedback [9, 25] to
the calyx is not clear. It is unlikely that bLN2s receive direct
input from PNs because activity in bLN2 can be silenced
completely by blocking activity in KCs [20].
Our mass fill stains identified at least one dozen bLN2s in
each hemisphere (Figure S2). In contrast, several results
sug-gest that there is only one bLN1 in each hemisphere. First,
mass dye fills in five brain hemispheres showed only one
bLN1 per hemisphere, even when large numbers of other
bLNs were filled (Figure S2). Second, with intracellular staining
experiments, we never filled in a hemisphere more than one
bLN1, despite its large size; by contrast, we routinely found
multiple bLN2s, either when we injected dye into multiple cells
or on occasions when dye leaked from the electrode (an
example is shown in
Figure S4). Third, paired intracellular fills
of bLN1 with two different dyes revealed the same neuron
(Figure S3).
bLN2 was previously shown to receive direct input from KCs
[24]. Our results suggest that bLN1 also receives direct input
βL αL Calyx MB Lateral Horn KC Somata Antennal Lobe Antennal nerve bLNs PNs KCs Extracellular Intracellular bLN1 GABA Merge bLN2 GABA Merge bLN2 GABA Merge Optic nerve hex 10 chx 10 oct 10 1 2 3 4 5 6 7 8 9 1 s bLN1 bLN1 bLN2 bLN2 hex 10 hex 10 o3l 10 hex 0.1
A
B1
C
1 s KCD
1 sB2
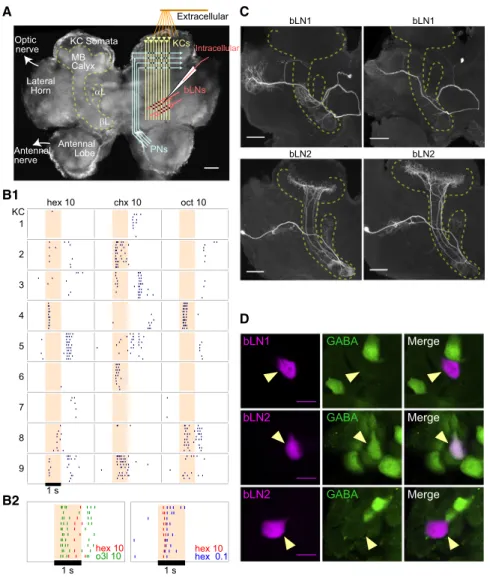
Figure 1. Responses and Followers of KCs (A) Schematic of the locust olfactory system and recording positions. KCs receive input from pro-jection neurons (PNs) in the calyx and send
output toaandblobes of the mushroom body
(MB). KC somata are located superficially to the calyx.
(B1) Extracellular recordings from several KCs show sparse responses with odor-specific timing. (B2) Superimposed rasterized spiking responses of a single KC to two odors (left) and of another KC to two concentrations of the same odor (right) show odor-specific spike timing; hex, chx, oct, and o3l indicate odors, whereas 10 and 0.1
indi-cate percent dilutions (seeExperimental
Proce-duresfor a description of odors).
(C) Intracellular stains show stereotyped mor-phologies of bLN1 and bLN2 neurons in different animals (dashed outline indicates mushroom body).
(D) Immunostains for GABA show that bLN1s are GABA-negative (top, observed >5 times), whereas bLN2s can be GABA-positive (middle, observed 4 times) or GABA-negative (bottom, observed >5 times); observation counts include cells identified from intracellular recordings and mass fills.
Scale bars of (A) and (C) represent 100mm; scale
bars of (D) represent 15mm. See alsoFigures S1,
S2, andS3.
from KCs: bLN1s extended fine and
highly branched, dendrite-like [20]
neu-rites in the
b
lobe (see
Figure 1C) and
showed reliable, short-latency,
excit-atory postsynaptic potentials and
in-creased spiking after brief stimulation
of KCs (Figure 2A; also see
Figure 5
below). Consistent with these results,
paired recordings showed that
acti-vating the giant GABAergic neuron
(GGN), which inhibits KCs [20, 26], inhibited bLN1 (Figure 2B).
Together, these results established the bLNs as suitable
tar-gets for our analysis of KC spike timing.
Temporal Patterns of Responses in Followers of KCs
Contain Odor Identity
To understand how the precise timing of KC spikes affects
bLN responses, we asked how bLNs respond to odors.
Con-firming previous reports from unlabeled neurons in the
b
lobe
[23, 27], we found both bLN1s and bLN2s fired spontaneously
and responded to odors with vigorous bursts of spikes. These
dense responses are consistent with the convergence of KCs
onto the relatively large dendritic arbors of bLNs (Figures 1C
and
S2). In bLNs, the patterns of spikes elicited by odors often
endured longer than the odor and contained alternating
epochs of excitation and inhibition, each lasting hundreds of
milliseconds (Figure 3A). We found that bLNs of all classes
re-sponded to nearly every odor we tested (response probability =
96.9%, n = 262 cell-odor combinations), so the identities of
responsive bLNs could not provide enough information to
specify the odor. However, different odors could elicit
mark-edly different firing patterns from a given bLN (Figure 3A; see
also
Figure S4); thus, using standard statistical classification
methods, we could use these temporal patterns to classify
odor identity (see
Experimental Procedures;
Figure 3B).
Indeed, for both bLN1 and bLN2, within 500 ms of response
onset, the single-neuron classification accuracy for a fixed
set of six odors reached 60%–70%, significantly exceeding
chance (chance level = 1/6 = 17%; bLN1: p = 5
3
10
25, n = 6;
bLN2: p = 9
3
10
25, n = 9; two-tailed t test); response accuracy
continued to improve as longer portions of the response were
included in the analysis. Consistent with our response
classifi-cation results, the odors we used are distinguishable by the
animal; hexanol and octanol, which are among the most
chem-ically similar odorants in our test panel, are readily
discrimi-nated by behaving locusts [22].
Control analysis using a sham response period of 2 s
before the odor presentation yielded performance at chance
level, regardless of the length of the response analyzed
(Fig-ure 3C). The initial
w
500 ms of the response were most
infor-mative, but each point in time during the response also
carried information about odor identity, as shown by a
clas-sification analysis performed on sequential bins made from
the response period (Figure 3D;
Experimental Procedures).
Instantaneous classification accuracy was significantly above
chance even 1 s after odor onset (bLN1: p = 0.035, n = 6;
bLN2: p = 0.006, n = 9; two-tailed t test). We found that a
given odorant could evoke different patterns of spiking in
different bLNs of the same class in the same brain (Figure S4).
We also tested (see
Experimental Procedures) how well
odors could be identified given two other characteristics of
the response: the mean spike rate [17] or spike phase, with
respect to the simultaneously recorded oscillation cycle [28,
29]. Classification attempts using these features were
signif-icantly less successful than classification using temporal
patterning (Figure 3E).
These results show that bLNs contain information about
odor identity in temporally structured patterns of spikes. To
test whether these response patterns are robust to variations
in the number and duration of odor presentations, we
measured responses of bLNs to a set of odors presented in
four different stimulus patterns (Figure 4A). The responses of
bLNs to an odor varied with the presentation pattern of the
GGN
+
GGN -020 40
# spikes during odor presentation
KCs GGN bLN1
+
/
-Current injection Odor+
-Intracellular recording odor 1 s+
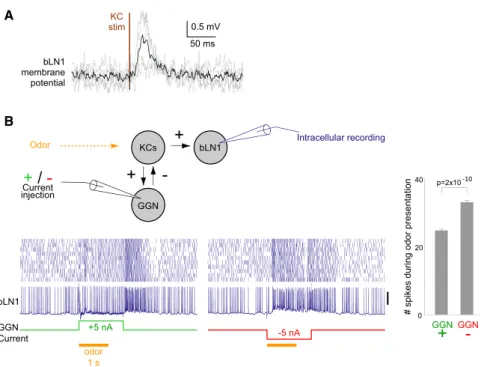
GGN Current bLN1 +5 nA -5 nA p=2x10⁻¹⁰ 0.5 mV 50 ms KC stim bLN1 membrane potentialA
B
Figure 2. bLN1 Receives Direct Input from KCs (A) Average membrane potential of individual bLN1 neurons (n = 5, gray) triggered on KC stimulation pulse shows short-latency excit-atory input. Black indicates the average of all neurons.
(B) GGN inhibits bLN1 activity. Using paired intracellular recordings, we injected positive or negative current in GGN while monitoring re-sponses to odor in bLN1. The morphology of bLN1 was confirmed with intracellular staining. Compared to the injection of negative current, injection of positive current in GGN signifi-cantly reduced the number of spikes in bLN1 during 1 s of odor presentation; n = 10 trials,
p = 2 3 10210
, two-tailed t test. The same result was found in another animal (data not shown). Scale bars represent 20 mV. Error bars show SEM.
odor but retained similarities across
the presentation patterns. Thus, a
classi-fier trained on responses evoked by
odors presented in one pattern could
perform well above chance given
re-sponses to other presentation patterns
(Figure 4B), even when the response magnitude was
normal-ized (Figure 4C).
Temporal Patterns in KC Responses Determine Temporal
Patterns in bLN Responses
To determine whether the precise timing of the sparse spikes
in KCs carries useful information, we tested whether this
timing is actually used by the follower neurons. Our results
show that bLNs contain information about odor identity in
the temporal patterns of their spikes. The precise timing of
spikes in KCs could potentially shape the information-rich
temporal patterns of spikes in bLNs, which would establish
the importance of timing in the sparse responses of KCs.
Yet, it is also possible that the fine details of timing of KC
spikes are ignored by bLNs as they integrate their input [13];
the odor-evoked temporal patterns in bLNs could instead
originate elsewhere, such as with local interactions [27], for
example, between GABA-positive and GABA-negative
neu-rons in the
b
lobe (Figure 1D).
To test for causal links between the timings of responses in
KCs and bLNs, we manipulated the absolute or the relative
timing of spikes in KCs while making intracellular recordings
from bLNs (Figure 5A). To generate sparse [30] and distributed
responses in KCs, we delivered low-amplitude current through
multiple microwires targeting the KC somata layer in the calyx.
Our brief (50 ms, 150 ms, or 300 ms) trains of high-frequency
(100 Hz or 200 Hz) electrical stimulation likely elicited in each
responding KC only one spike or a few spikes because KCs
show strong spike-frequency adaptation, long-lasting
hyper-polarizations following spikes [19], and firing rates that
satu-rate at 10–20 spikes/s in response to current injections [31,
32] (see
Figure S5). Further, bLNs driven by electrically
acti-vated KCs fired at moderate rates matching those evoked by
odors (Figure 5B). Neurons of class bLN2 extend branches
into the calyx region of the mushroom body (see
Figure 1C),
raising the potential concern that electrical stimulation may
have directly activated these cells rather than, as intended,
driven them indirectly via the KCs. However, direct activation
is unlikely for several reasons. First, we positioned the
stimu-lating electrodes in the KC soma layer, which exclusively
con-tains KCs and is separate from the neuropil region of the calyx
[19]. Second, we placed both stimulation anode and cathode
in the somata layer to contain the current path within that layer.
Third, bLN1s, which do not project to the calyx, responded to
electrical stimulation similarly, and as strongly, as bLN2s
(Figure 5C), showing that our results do not depend on direct
stimulation of bLNs. These results show that our electrical
stimulation paradigm evoked activity in KCs and then in
bLNs, well within the spiking range normally evoked by odors.
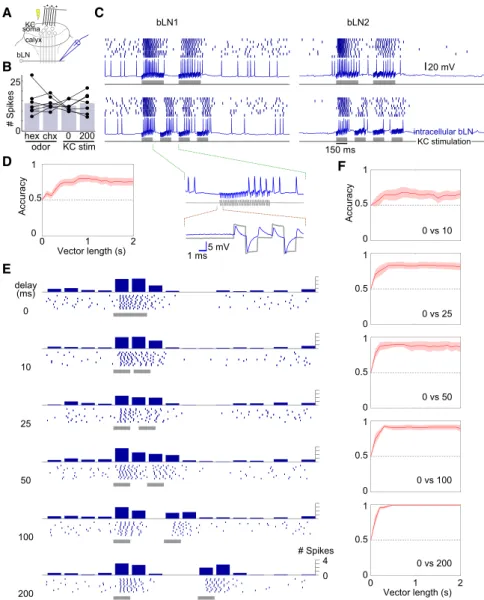
We first varied the absolute timing of KC stimulation while
keeping net stimulation constant by delivering two different
stimulation patterns through all wires: four epochs of 150 ms
stimulation with 100 ms gaps and two epochs of 300 ms
stim-ulation with a 200 ms gap. When KCs were driven this way,
bLNs responded reliably with firing patterns that could be
used to classify the KC stimulation pattern with
w
80%
accu-racy (Figures 5C and 5D). We next tested whether bLNs could
differentiate a 100 ms epoch of KC stimulation from two 50 ms
epochs separated by brief delays ranging from 10 ms to
200 ms. Indeed, the responses elicited in bLNs by these
different patterns could be differentiated with accuracy
ap-proaching 100% for delays of 100 ms or longer,
w
80% for
delays of 25 ms, and
w
65% for delays of 10 ms (Figures 5E
and 5F). These results show bLNs are sensitive to changes in
KC spike timing on a scale of tens of milliseconds.
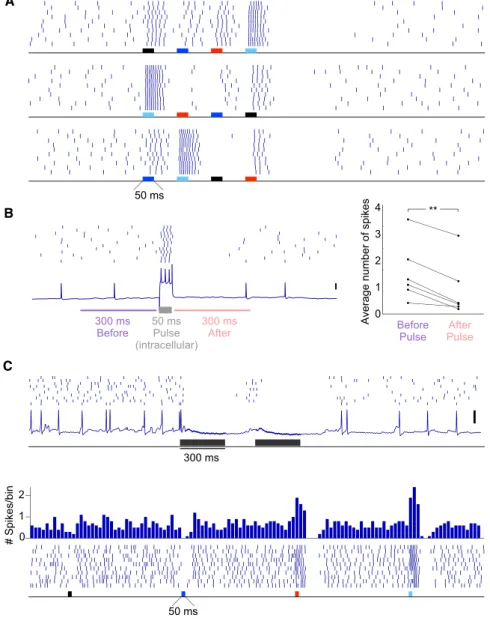
Next, we varied the order in which different KCs were
stim-ulated, keeping the absolute stimulation times and net
stimu-lation unchanged. Using a switching circuit directing the
same electrical stimulus sequentially to four pairs of wires,
we activated four sets of KCs in different orders, with 50 ms
pulses separated by 100 ms delays between sets (Figures 6A
and 6B1). We found that responses evoked in bLNs depended
on the sequence used to stimulate KCs and could be used to
discriminate among four stimulation sequences with >95%
accuracy (Figure 6B2). Discrimination performance remained
well above chance, even when the algorithm was given shorter
or longer response durations for classification. The different
KC stimulation sequences affected not only the response
pat-terns of bLNs but also their firing rates: classification using the
total number of evoked spikes performed less well than
classi-fication using patterning but still better than chance
(accu-racy = 57% compared to 25% chance, p = 0.003 for 500 ms
interval; accuracy = 48%, p = 0.005 for 1 s interval). We then
sought to mimic the smallest realistic change in the relative
timing of KCs, which respond to odors with at most one spike
per
w
50 ms oscillation cycle [12]. We used two sequences of
KC stimulation: first, we activated four sites sequentially for
50 ms each with no delay between sites, and, second, we
used the same first and fourth site but interchanged the order
of the second and the third sites (Figure 6C1). We found even
this subtle change could be decoded from bLN response
pat-terns with >80% accuracy (Figure 6C2); classification
accu-racy using total number of spikes in a 500 ms period was
66% compared to 50% chance, and p = 0.036. These results
show that minimal variations, on a scale of tens of
millisec-onds, in the timing of very sparse spikes strongly influence
the responses of follower neurons and thus establish the
importance of timing in a sparse sensory code.
mja 10 1 s oct 10 oct .1 chx 10 hxa 10 o3l 10 hex .1 hex 10 chx .1 1 s bLN1 bLN2 20 mV temporal pattern rate phase temporal pattern rate phase 0 0.5 1 0 0.5 1 0 0.5 p=.0007 p=.00007 p=.003 p=.0001 p=.002 p=9x10⁻⁷ p=.00002 p=.0007 p=.0005 p=.00008 p=.0003 p=.027 bLN1 bLN2 0 0.5 1 Accuracy 0 1 2 0 0.5 1 Control Accuracy Vector length (s) 0 1 2 Vector length (s) 0 1 2 0 0.5 1 Instantaneous Accuracy Time (s) 0 1 2 Time (s) bLN1 bLN2
A
B
D
E
bLN1 bLN2C
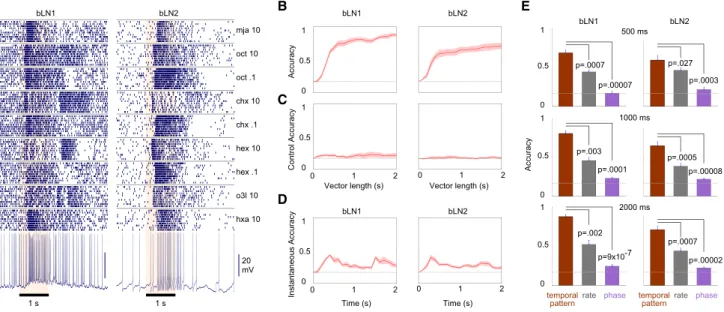
Accuracy 500 ms 1000 ms 2000 ms 1Figure 3. Response Patterns in bLNs Contain Information about Odor Identity
(A) Dense, temporally patterned, and odor-specific responses of representative bLN1 and bLN2 neurons to 0.1% or 10% concentrations of various odors. Note reproducible patterns across ten trials with each odor.
(B) Classification accuracy of many bLNs to a set of six odors (0.1% and 10% concentrations of hex, chx, and oct) exceeded chance (dashed line: 1/6); n = 6 bLN1s, n = 9 bLN2s. Solid line with shading shows the mean (across bLNs) with SEM.
(C) Classification accuracy using bLN activity 2 s before odor delivery is at chance level. This control analysis shows that the above-chance performance observed in (B) depends on odor-evoked response patterns and is not due to differences in background firing.
(D) A modified classification analysis using short instantaneous segments of responses (seeExperimental Procedures) shows performance above chance
throughout the 2 s period.
(E) Although bLN spikes were phase locked to 20 Hz LFP oscillations (for both bLN1 and bLN2), the average phase or the average firing rate of spikes per-formed poorly, compared to the temporal patterns of spikes, in classifying odor identity (bLN1: n = 6; bLN2: n = 9); error bars show SEM. The same result was obtained whether we analyzed responses in intervals of duration 500 ms, 1,000 ms, or 2,000 ms after the onset of odor.
Because the experiments using electrical stimulation were
performed in the absence of odors (and odor-evoked
oscilla-tions), the observed sensitivity of bLNs to KC spike timing did
not depend on oscillatory dynamics. The sensitivity of bLNs
to precise timing may emerge because different KCs make
synapses of different strengths or at different locations [33]
on the dendritic trees of bLNs. For instance, the black
stimu-lation site in
Figure 6B1 and the light blue stimulation site in
Figure 7A appeared to elicit stronger responses than other
sites. Also, a close examination of bLN responses suggests
activating KCs could evoke inhibition, in addition to
excita-tion, in bLNs. The inhibition evoked by one set of KCs could
mask the excitation subsequently evoked by another
(Fig-ure 7A), making bLN responses sensitive to the order in
which KCs are activated. One source of this inhibition may
be intrinsic to bLNs: directly injecting positive current into a
bLN could cause a brief subsequent reduction in its
spontaneous firing (Figure 7B), suggesting a form of fatigue.
In some bLNs, however, inhibition driven by the activation of
KCs could be observed in the apparent absence of preceding
excitation, showing that some inhibition in bLNs arises
through circuit interactions (Figure 7C). The second example
in
Figure 7C shows that the inhibition could depend on
the identity of stimulated KCs, consistent with the idea
that the inhibition in bLNs arises partly through circuit
inter-actions and not exclusively through mechanisms intrinsic
to bLNs.
Discussion
Representations of sensory stimuli can change as they move
from one population of neurons in the brain to the next. In
deeper layers, stimuli are often encoded by relatively few
spikes in selective neurons [1, 13]. Information about sensory
stimuli has been thought to be carried by the identities of these
sparsely responding neurons [13]. However, our results show
that the timing of the sparse KC responses also carries
olfac-tory information and contributes to the information content of
dense codes in follower neurons. Thus, stimulus-specific
var-iations in spike timing provide a useful channel to increase the
coding capacity of neurons, while retaining the benefits of
sparseness.
The presence of information about odors in the timing of
spikes early in the olfactory pathway has been shown in both
vertebrates and insects [17, 34–38]. Studies of the insect
olfac-tory system have shown that odors elicit patterns of spikes
that vary with the odor in receptor neurons and their followers,
the PNs [39, 40]. Our results show that neurons further along in
the olfactory pathway, the KCs and the bLNs, also contain
in-formation about odors in the timing of their spikes. Recently,
the neural targets of PNs in the lateral horn were also shown
to respond with odor-specific temporal patterns of spikes
[41]. Because our results showed that both the firing rates
and the timing of spikes in bLNs are shaped by the timing of
KCs, any mechanism reading the output of bLNs will also be
1000 ms 1000 ms hex oct eiv chxB
A
20 mVOdor
Stimulus patternStimulus pattern onset
C
0 0.5 1 0 0.5 1 0 0.5 1 0 1 2 0 0.5 1 Accuracy Vector length (s) 0 1 2 0 1 2 0 1 2Stimulus pattern used for training
Stimulus pattern used for testing
0 0.5 1 0 0.5 1 0 0.5 1 0 1 2 0 0.5 1 Accuracy 0 1 2 0 1 2 0 1 2 Vector length (s)
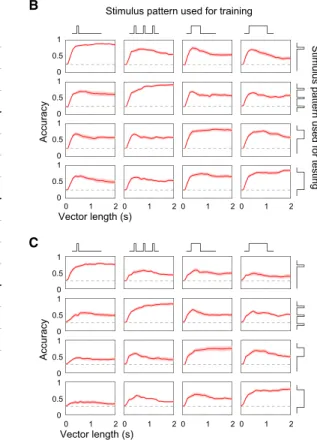
Figure 4. Odor Identity Can Be Extracted from bLN Responses Even when Odor Stimulus Pattern Varies
(A) Rasterized spiking responses of a bLN to four odors, each presented in four different patterns (100 ms, 33100 ms, 500 ms, and 1,000 ms).
(B) Classification accuracy (n = 11 bLNs) exceeded chance (dashed line = 0.25) even when the classifier was trained on responses to odors presented in one pattern and was tested on responses to the same odor set presented in another pattern.
(C) Odor identity can be extracted from normalized bLN responses. The magnitude in each response vector (for each trial) was normalized by the total num-ber of spikes occurring 2 s following the onset of odor. The classification accuracy, although less than that observed without normalization of response vectors in (B), exceeds chance (0.25) in all cases. Shading shows SEM.
sensitive to the timing of the sparse responses of KCs.
Together, these results suggest that temporal coding is used
throughout the olfactory system. This view is different from
one suggested by a study of the mouse olfactory system
[17], which argued that a relative time code in the olfactory
bulb is converted into a rate code in piriform cortex neurons
(which are analogous to KCs). However, other recent reports
suggest the existence of odor-specific timing in this region
[42]. Examining the responses of the follower neurons of
form cortex neurons may be useful in determining whether
piri-form cortex neurons use temporal codes for odors.
Many factors contribute to the generation of temporal
struc-ture in the responses of olfactory neurons early in the olfactory
pathway, including the physical kinetics of odor delivery and
the biochemical chain of events surrounding olfactory
trans-duction [40]. Yet, these factors do not fully explain the
tempo-ral patterning observed in bLNs. Indeed, a given odorant could
generate nearly identical responses in a given bLN over
repeated presentations but very different response patterns
in different bLNs (see responses to 10% hexanol in
Figure 3A;
also see
Figure S4). The temporal patterns of response in
bLNs, therefore, reflect neuron-specific dynamics, determined
by the response patterns of their presynaptic KCs (Figure 6),
bLN1 bLN2 200 100 50 25
A
E
F
150 ms 20 mV 0 vs 10 0 vs 25 0 vs 200 0 vs 100 0 vs 50 delay (ms) 0 10 # Spikes 0 4C
KC soma bLN 0 25 # Spikes hex chx 0 200 odor KC stimB
D
KC stimulation intracellular bLN 5 mV 1 ms 0 1 2 0 0.5 1 Accuracy Vector length (s) 0 0.5 1 0 0.5 1 0 0.5 1 0 0.5 1 0 0.5 1 Accuracy 0 1 2 Vector length (s) calyxFigure 5. bLNs Are Sensitive to Changes in the Absolute Timing of KC Activation
(A) Experiment setup.
(B) KC stimulation (a pair of 50 ms pulses sepa-rated by 0 ms or 200 ms delay; see E) evoked similar numbers of spikes in bLNs (counted in 500 ms from stimulus onset), as did 100 ms pulses of odor (chx or hex) in the same bLNs (n = 7, F(3,24) = 0.14, p = 0.93, one-way ANOVA). Bars show means.
(C) Responses of representative bLN1 and bLN2 neurons to different temporal patterns of KC stimulation (600 ms total stimulation in both pat-terns). Inset: detailed view of the intracellular trace (blue) and the simultaneously recorded trace of the injected current (gray) is shown; note the artifacts caused by crosstalk between the stimulator and the recording instrument. These artifacts do not reflect direct activation of bLNs: the artifacts were precisely time locked with the stimulus trains with virtually no lag (<0.1 ms) but appeared unrelated to spiking; both bLN1 and bLN2 showed similar artifacts even though only bLN2 has branches in the calyx. (D) A classifier can differentiate between the two response patterns in (C) with high accuracy (chance level = 0.5). Results obtained for different bLN classes were similar and were pooled (n = 15 bLNs).
(E) Responses of a bLN to pairs of 50 ms pulses separated by different delays. Peristimulus time histogram of spikes (binned every 50 ms) is shown above rasters.
(F) Accuracy of classification between 0 ms delay condition and other delay conditions (n = 8 bLNs).
Shading shows SEM. See alsoFigure S5.
possibly with contributions from
addi-tional mechanisms within and around
the bLNs or lateral connections among
KC axons [43]. Our results suggest that
both intrinsic and network inhibition in
bLNs may help to make these neurons
sensitive to the timing of KC spikes
(Figure 7). These results also suggest a new functional role
for the lateral inhibition observed among bLNs [27].
Although the responses of bLNs clearly contain information
about odorants, the precise roles these neurons play in
olfac-tory behaviors remain to be determined. The response
pat-terns in bLNs may be helpful for discriminating odors; these
patterns were most informative about odor identity in the first
few hundred milliseconds of odor presentation (Figure 3),
consistent with the fast odor discrimination observed in
behavioral experiments [44]. The response patterns, however,
continued to provide information about odor identity for
dura-tions matching or exceeding the duration of the stimulus. This
additional information may become useful as the difficulty of
the behavioral task increases [45, 46] or when accuracy is
more rewarding than speed. It is also possible that the
response patterns of bLNs are not needed for discriminating
odors per se, but rather for other processes such as encoding
memories in the mushroom body, a process that could occur
relatively slowly: an insect can learn to associate an odor
with a reward, even when the two stimuli are separated by
several seconds [47]. If associative olfactory memories involve
spike timing-dependent plasticity (STDP) at KC-bLN synapses
[27], the odor-specific temporal patterns in KCs and bLNs will
determine which subset of the synapses formed by
odor-responsive KCs undergoes plasticity.
Experimental Procedures Animals and Preparation
All experiments were performed on restrained, unanesthetized locusts, Schistocerca americana, raised in our crowded colony (hundreds of animals per cage), with 12 hr-12 hr (light-dark) cycle. Two-month-old animals (n = 81) of either sex were used in the experiments. Animals were immobilized, and the brains were exposed, desheathed, and superfused with locust saline at room temperature as described previously [41].
Odor Stimulation
Odors were delivered as described previously [41]. Briefly, 20 ml of odorant solutions were placed in 60 ml glass bottles at dilutions of 10%, 1%, or 0.1% v/v in mineral oil. Odorants used in our study were as follows: grass volatiles hexanol (hex), octanol (oct), hexanal (hxa), and 1-octen-3-ol (o3l); synthetic compounds cyclohexanone (chx) and ethyl isovalerate (eiv); and nongrass plant volatiles geraniol (ger), citral (cit), and methyl jasmonate (mja). Sharp Intracellular Recordings
Intracellular recordings were made from bLN dendrites in theblobe [24] by us-ing sharp glass micropipettes (60–200 MU, filled with 0.5 M potassium acetate or an intracellular dye solution). Paired intracellular recordings of bLNs and
GGN were obtained by targeting a bLN in theblobe and GGN near the
pedunculus of the mushroom body with sharp electrodes. The signals were amplified in bridge mode (Axoclamp-2B; Molecular Devices), further ampli-fied with a DC amplifier (BrownLee Precision), and sampled at 15 kHz or 20 kHz (LabView software; USB-6353 DAQ card; National Instruments). Intracellular Staining
The intracellular dye solution consisted of 1% Neurobiotin (Vector Labs) in 0.2 M LiCl or 5% Lucifer Yellow (Invitrogen) filled at the electrode’s tip with 0.2 M LiCl in the shaft. After recording, to identify bLN morphology,
500 ms 50 ms
B1
B2
C1
A
KC soma bLN calyx 0 1 2 0 0.5 1 Accuracy Vector length (s) 0 0.5 1C2
0 1 2 Vector length (s) 50 ms bins 200 ms bins 0 0.5 1 Accuracy 0 0.5 1 100 ms binsFigure 6. bLNs Are Sensitive to the Order of KC Activation
(A) Experiment setup.
(B1) Responses of a representative bLN to four different sequences of KC stimulation. Vertical scale bar represents 20 mV.
(B2) bLN responses can be used to accurately classify the four stimulation sequences in (B1) (top, n = 8 bLNs, chance level = 0.25); similar re-sults are obtained when the bin size used in the classification analysis is changed from 100 ms to 50 ms or 200 ms.
(C1) Response of a bLN to two minimally different sequences; note expanded time base. (C2) bLN responses can be used to classify the two stimulation sequences in (C1) (bottom, n = 7 bLNs, chance level = 0.5). Shading shows SEM.
we sometimes injected dyes into the neurons iontophoretically by using 0.2–2 nA current pulses at 3 Hz for up to 20 min. Neurons belonging to bLN1 class could also be readily identified physiologically; compared to other classes of bLNs, they exhibited relatively high background firing rates, low input resistance, and few subthreshold excitatory postsynaptic potentials.
Mass Fills
Mass fills were used to complement intracellular staining for morphological analysis of bLNs. Neurobiotin or Lucifer Yellow, in the same con-centration used for intracellular staining, was loaded in a blunt glass micropipette (5–25 MU).
The electrode was lowered into theblobe, and
the dye was released using 10–20 nA current pulses at 3 Hz for up to 20 min. During this procedure, the electrode position
was adjusted a few times, mostly in the vertical direction (withinw50mm), to
increase the chances of staining multiple neurons. In some cases, effective mass fills were obtained by sequential intracellular staining of several neu-rons using sharp electrodes as described above.
Histology
After experiments, brains were dissected out, fixed in 4% paraformalde-hyde, and prepared for histology as described previously [41]. Imaging was performed using a confocal microscope (Zeiss LSM 510 or LSM 780),
with a 103(0.3 NA) or 203 (0.8 NA) objective. Confocal stacks were
analyzed using public domain software ImageJ (NIH). Images showing neuron morphology are maximum-intensity projections through confocal stacks, and they were enhanced for clarity by adjusting brightness, contrast, and gamma and by removing noise patches from the brain sur-face. Images showing GABA immunostains are single sections from the confocal stack, and they were minimally enhanced (using only brightness and contrast adjustments, applied uniformly throughout the image). Immunostaining
Anti-GABA immunostaining was performed on whole locust brains contain-ing dye-filled neurons as described previously [41], uscontain-ing rabbit anti-GABA primary antibody (Sigma, A2052) and Alexa Fluor 488 or Alexa Fluor 633 conjugated anti-rabbit IgG secondary antibody (Invitrogen, A-11008 or A-21070). Intracellular staining with Lucifer Yellow was enhanced by anti-body staining using anti-Lucifer Yellow primary (Invitrogen, A-5750) and Alexa Fluor 488 conjugated secondary antibody (Invitrogen, A-11008). Multiunit Recordings
Extracellular multiunit recordings were made from KCs using custom twisted-wire electrodes [12] containing up to eight wires. The signals were preamplified, amplified, and filtered using a 16-channel amplifier (A-M Sys-tems). Data were digitally sampled at 20 kHz. KC spike sorting was per-formed offline using a custom MATLAB (MathWorks) program based on the Spike-O-Matic algorithm [48]. Spike sorting was conservative: we
analyzed only those clusters that were unambiguously defined and well separated from one another throughout the experiment.
Local Field Potential Recordings
Local field potential (LFP) was recorded in the calyx of the mushroom body using either a blunt glass capillary electrode (5–15 MU, filled with saline) or one of the channels of the extracellular twisted-wire electrodes. The LFP was used to estimate the phases of the spikes of bLNs.
Electrical Microstimulation
Because the soma layer dorsal to the mushroom body calyx includes only KC somata [19], we could readily and exclusively target KCs for electrical stimulation. Brief trains of optically isolated current stimulation (IsoStim01-D, NPI Electronic) were delivered at 100 Hz or 200 Hz. We used biphasic stimulation pulses of small amplitude, in either constant
cur-rent mode (1–4mA) or constant voltage mode (0.5–5 V, 100–200 kUelectrode
resistance), with 1–4 ms pulse width. The parameters of stimulation were adjusted for each animal to obtain responses in bLNs resembling those eli-cited by odors but were kept unchanged within an experiment. The positive and the negative terminals of the stimulator were connected to three or four channels each of an eight-channel twisted-wire electrode, splayed among the KC somata (covering 50%–60% width of the calyx) to achieve distrib-uted activation of KCs. The timing of stimulation was controlled by LabView (National Instruments) software. Stimuli were presented in randomized orders. 50 ms 1 2 # Spikes/bin 0 50 ms
A
50 ms Pulse (intracellular) 300 ms After 300 msBefore BeforePulse PulseAfter 0
1 2 3 4
Average number of spikes
**
C
B
300 ms
Figure 7. Inhibition Influences bLN Response Patterns
(A) In this representative example, the inhibition caused by stimulation of one set of KCs (light blue electrode) could diminish the excitatory re-sponses normally evoked by other sets of KCs stimulated subsequently. Compare responses to the red electrode in the middle panel and the black electrode in the bottom panel with corre-sponding responses in the top panel. This mask-ing phenomenon was clearly evident in five cells. (B) Brief, intracellular current pulse injections in bLNs can briefly inhibit subsequent spiking; **p = 0.002, n = 6 bLNs, two-tailed paired t test. (C) Top: a bLN showing inhibition in absence of excitation following stimulation of KCs. Bottom: a bLN in which stimulation of one set of KCs (dark blue electrode) evoked inhibition (in absence of preceding excitation), whereas stimu-lation of other sets of KCs (red and light blue elec-trodes) evoked both excitation and inhibition. Peristimulus time histogram of spikes (binned every 50 ms) is shown on top; inhibition in absence of excitation was observed in four cells. Vertical scale bar represents 20 mV.
Spatially Ordered Microstimulation
Spatially ordered stimulation of KCs was
achieved by routing isolated stimulation to four different sites using four Magnecraft W117DIP-25 reed double pole single throw relays (Newark Electronics). To achieve fine control over the selection of stimulation sites, we used two eight-channel twisted-wire electrodes held by separate micromanipulators (the intracellular recording electrode was held by a third microma-nipulator). Of the eight channels in each bundle, four were selected (quality assessed by their ability to record LFP signals) and connected to the positive or negative terminals of different re-lays. The sequence of activation was controlled by LabView (National Instruments) software. Stimuli were presented in randomized orders. Stimulus-Triggered Averages
To check whether bLN1 receives direct excit-atory input from KCs, we delivered a series
(several hundred per cell) of very brief (150–300ms) pulses of extracellular
stimulation to KCs, while monitoring the membrane potential in bLN1 den-drites by sharp-electrode intracellular recording. We then constructed the stimulus-triggered average for each cell to detect any excitatory or inhibi-tory postsynaptic potentials in bLN1 following stimulation pulses. Note that the observed latency between the stimulus delivery and the onset of the excitatory postsynaptic potential in bLN1 includes the delay in genera-tion of KC spikes after stimulagenera-tion, the delay in the conducgenera-tion of spike from
KC soma in the calyx to neurites in theblobe (estimated [24] to be around
w5.5 ms), and the delay at the synapse.
Data Analysis
All analyses were performed using custom programs in MATLAB. All data in
the manuscript are reported as mean6SEM. Statistical tests were
per-formed using two-tailed t tests or ANOVA. The samples compared were of equal sizes and did not show significant deviation from normality (Anderson-Darling test). Sample sizes were 6–9 for all tests; significant p values were well below 0.05. Phases of spikes with respect to the LFP were estimated by measuring their positions relative to the previous
(0 radian) and the next (2pradians) peak in the simultaneously recorded
LFP (noncausal band-pass filtered, 15–30 Hz). Determination of Odor Responses
Responsiveness of a neuron to an odor was determined by an automated algorithm, using previously published criteria for response amplitude and
reliability [12]. To satisfy the amplitude criterion, the neuron’s instantaneous firing rate (peristimulus timing histogram computed using 20 ms bins and smoothed with a Gaussian of 60 ms SD) during the response period (2 s from odor onset) had to exceed more than 3.5 SD of the baseline firing rate (computed for 2 s before odor presentation). To satisfy the reliability criterion, the neuron had to fire at least one spike during the 2 s response window in more than half of the trials. We validated these criteria by esti-mating the false positive rate: the fraction of cell-odor combinations that qualified as responsive in a sham response period (2 s before odor presen-tation) was small (2.3%).
Classification Analyses
Classification analyses were performed on individual neurons using a standard template-matching algorithm [41] with 2-fold nonstratified cross-validation. Briefly, responses of bLNs were represented by vectors of spikes binned in 100 ms windows (other bin sizes gave similar results; Figure 6B2) when using temporal patterns or by single bins containing the average spike rate or average spike phase (with respect to the simulta-neously recorded LFP) when using these other features for classification (Figure 3E). The classifier first generated a template for each stimulus by calculating the centroid of the vectors from training trials (50% of all trials) and then classified the remaining (test) trials based on Euclidean distance to provide an accuracy estimate. Chance level is given by 1/x, where x is the number of odors or stimulation sequences to be classified (different for different figures). For 0 vector length, accuracy was, by defi-nition, at chance. Control analyses using a sham response period (2 s before stimulus presentation) showed classification accuracy near chance level (Figure 3C). To test information content in different parts of the response, we used a variant of the above algorithm: the Euclidean dis-tance was computed using the values in the individual bin at each time point (Figure 3D).
Supplemental Information
Supplemental Information includes five figures and can be found with this
article online athttp://dx.doi.org/10.1016/j.cub.2014.08.021.
Author Contributions
N.G. and M.S. designed the experiments. N.G. performed the experiments and analyzed the data. N.G. and M.S. wrote the paper.
Acknowledgments
We thank members of the M.S. laboratory and Maxim Bazhenov for helpful discussions; George Dold and Bruce Pritchard for help with the current stimulation setup; and Kui Sun for her excellent animal care. Microscopy was performed at the Microscopy and Imaging Core (NICHD) with the kind assistance of Vincent Schram. This work was supported by an intramu-ral grant from the NIH-NICHD to M.S.
Received: June 25, 2014 Revised: August 11, 2014 Accepted: August 13, 2014 Published: September 25, 2014 References
1. Olshausen, B.A., and Field, D.J. (2004). Sparse coding of sensory inputs.
Curr. Opin. Neurobiol.14, 481–487.
2. Vinje, W.E., and Gallant, J.L. (2000). Sparse coding and decorrelation in
primary visual cortex during natural vision. Science287, 1273–1276.
3. Tolhurst, D.J., Smyth, D., and Thompson, I.D. (2009). The sparseness of
neuronal responses in ferret primary visual cortex. J. Neurosci.29,
2355–2370.
4. DeWeese, M.R., Wehr, M., and Zador, A.M. (2003). Binary spiking in
auditory cortex. J. Neurosci.23, 7940–7949.
5. Jadhav, S.P., Wolfe, J., and Feldman, D.E. (2009). Sparse temporal cod-ing of elementary tactile features durcod-ing active whisker sensation. Nat.
Neurosci.12, 792–800.
6. Poo, C., and Isaacson, J.S. (2009). Odor representations in olfactory
cortex: ‘‘sparse’’ coding, global inhibition, and oscillations. Neuron62,
850–861.
7. Reiter, S., and Stopfer, M. (2013). Spike timing and neural codes for odors. In Spike Timing: Mechanisms and Function, P.M. DiLorenzo and J.D. Victor, eds. (Boca Raton: CRC Press), pp. 273–297. 8. Keene, A.C., and Waddell, S. (2007). Drosophila olfactory memory:
sin-gle genes to complex neural circuits. Nat. Rev. Neurosci.8, 341–354.
9. Mobbs, P.G. (1982). The brain of the honeybee Apis mellifera. I. the con-nections and spatial organization of the mushroom bodies. Philos.
Trans. R. Soc. B Biol. Sci.298, 309–354.
10. Strube-Bloss, M.F., Nawrot, M.P., and Menzel, R. (2011). Mushroom body output neurons encode odor-reward associations. J. Neurosci.
31, 3129–3140.
11. Perisse, E., Burke, C., Huetteroth, W., and Waddell, S. (2013). Shocking revelations and saccharin sweetness in the study of Drosophila
olfac-tory memory. Curr. Biol.23, R752–R763.
12. Perez-Orive, J., Mazor, O., Turner, G.C., Cassenaer, S., Wilson, R.I., and Laurent, G. (2002). Oscillations and sparsening of odor representations
in the mushroom body. Science297, 359–365.
13. Laurent, G. (2002). Olfactory network dynamics and the coding of
multi-dimensional signals. Nat. Rev. Neurosci.3, 884–895.
14. Stopfer, M., Jayaraman, V., and Laurent, G. (2003). Intensity versus
identity coding in an olfactory system. Neuron39, 991–1004.
15. Hahnloser, R.H.R., Kozhevnikov, A.A., and Fee, M.S. (2002). An ultra-sparse code underlies the generation of neural sequences in a songbird.
Nature419, 65–70.
16. Sosulski, D.L., Bloom, M.L., Cutforth, T., Axel, R., and Datta, S.R. (2011). Distinct representations of olfactory information in different cortical
centres. Nature472, 213–216.
17. Haddad, R., Lanjuin, A., Madisen, L., Zeng, H., Murthy, V.N., and Uchida, N. (2013). Olfactory cortical neurons read out a relative time code in the
olfactory bulb. Nat. Neurosci.16, 949–957.
18. Kurylas, A.E., Rohlfing, T., Krofczik, S., Jenett, A., and Homberg, U. (2008). Standardized atlas of the brain of the desert locust,
Schistocerca gregaria. Cell Tissue Res.333, 125–145.
19. Laurent, G., and Naraghi, M. (1994). Odorant-induced oscillations in the
mushroom bodies of the locust. J. Neurosci.14, 2993–3004.
20. Papadopoulou, M., Cassenaer, S., Nowotny, T., and Laurent, G. (2011). Normalization for sparse encoding of odors by a wide-field interneuron.
Science332, 721–725.
21. Simo˜es, P., Ott, S.R., and Niven, J.E. (2011). Associative olfactory
learning in the desert locust, Schistocerca gregaria. J. Exp. Biol.214,
2495–2503.
22. Saha, D., Leong, K., Li, C., Peterson, S., Siegel, G., and Raman, B. (2013). A spatiotemporal coding mechanism for background-invariant odor
recognition. Nat. Neurosci.16, 1830–1839.
23. MacLeod, K., Ba¨cker, A., and Laurent, G. (1998). Who reads temporal in-formation contained across synchronized and oscillatory spike trains?
Nature395, 693–698.
24. Cassenaer, S., and Laurent, G. (2007). Hebbian STDP in mushroom bodies facilitates the synchronous flow of olfactory information in
locusts. Nature448, 709–713.
25. Li, Y., and Strausfeld, N.J. (1999). Multimodal efferent and recurrent neu-rons in the medial lobes of cockroach mushroom bodies. J. Comp.
Neurol.409, 647–663.
26. Lin, A.C., Bygrave, A.M., de Calignon, A., Lee, T., and Miesenbo¨ck, G. (2014). Sparse, decorrelated odor coding in the mushroom body
en-hances learned odor discrimination. Nat. Neurosci.17, 559–568.
27. Cassenaer, S., and Laurent, G. (2012). Conditional modulation of
spike-timing-dependent plasticity for olfactory learning. Nature482, 47–52.
28. Hopfield, J.J. (1995). Pattern recognition computation using action
potential timing for stimulus representation. Nature376, 33–36.
29. Rojas-Lı´bano, D., and Kay, L.M. (2008). Olfactory system gamma oscil-lations: the physiological dissection of a cognitive neural system. Cogn
Neurodyn2, 179–194.
30. Histed, M.H., Bonin, V., and Reid, R.C. (2009). Direct activation of sparse, distributed populations of cortical neurons by electrical
micro-stimulation. Neuron63, 508–522.
31. Demmer, H., and Kloppenburg, P. (2009). Intrinsic membrane properties and inhibitory synaptic input of kenyon cells as mechanisms for sparse
coding? J. Neurophysiol.102, 1538–1550.
32. Tabuchi, M., Inoue, S., Kanzaki, R., and Nakatani, K. (2012). Whole-cell
recording from Kenyon cells in silkmoths. Neurosci. Lett.528, 61–66.
33. Branco, T., Clark, B.A., and Ha¨usser, M. (2010). Dendritic discrimination
of temporal input sequences in cortical neurons. Science329, 1671–
34. Schoppa, N.E. (2010). Spike timing improves olfactory capabilities in
mammals. Neuron68, 329–331.
35. Smear, M., Shusterman, R., O’Connor, R., Bozza, T., and Rinberg, D.
(2011). Perception of sniff phase in mouse olfaction. Nature 479,
397–400.
36. Bathellier, B., Gschwend, O., and Carleton, A. (2010). Temporal coding in olfaction. In The Neurobiology of Olfaction, A. Menini, ed. (Boca Raton: CRC Press), pp. 329–351.
37. Kay, L.M. (2013). Timing at multiple scales in olfactory perception. In Advances in Cognitive Neurodynamics (III), Y. Yamaguchi, ed. (Dordrecht: Springer), pp. 17–22.
38. Balu, R., Larimer, P., and Strowbridge, B.W. (2004). Phasic stimuli evoke precisely timed spikes in intermittently discharging mitral cells.
J. Neurophysiol.92, 743–753.
39. Raman, B., Joseph, J., Tang, J., and Stopfer, M. (2010). Temporally diverse firing patterns in olfactory receptor neurons underlie
spatiotem-poral neural codes for odors. J. Neurosci.30, 1994–2006.
40. Su, C.-Y., Martelli, C., Emonet, T., and Carlson, J.R. (2011). Temporal coding of odor mixtures in an olfactory receptor neuron. Proc. Natl.
Acad. Sci. USA108, 5075–5080.
41. Gupta, N., and Stopfer, M. (2012). Functional analysis of a higher
olfac-tory center, the lateral horn. J. Neurosci.32, 8138–8148.
42. Carlson, K.S., Xia, C.Z., and Wesson, D.W. (2013). Encoding and repre-sentation of intranasal CO2 in the mouse olfactory cortex. J. Neurosci. 33, 13873–13881.
43. Nowotny, T., Rabinovich, M.I., Huerta, R., and Abarbanel, H.D.I. (2003). Decoding temporal information through slow lateral excitation in the
olfactory system of insects. J. Comput. Neurosci.15, 271–281.
44. Vickers, N., and Baker, T. (1996). Latencies of behavioral response to interception of filaments of sex pheromone and clean air influence flight track shape in Heliothis virescens (F.) males. J. Comp. Physiol. A
Neuroethol. Sens. Neural Behav. Physiol.178, 831–847.
45. Wright, G.A., Carlton, M., and Smith, B.H. (2009). A honeybee’s ability to learn, recognize, and discriminate odors depends upon odor sampling
time and concentration. Behav. Neurosci.123, 36–43.
46. Rinberg, D., Koulakov, A., and Gelperin, A. (2006). Speed-accuracy
tradeoff in olfaction. Neuron51, 351–358.
47. Ito, I., Ong, R.C.-Y., Raman, B., and Stopfer, M. (2008). Sparse odor
rep-resentation and olfactory learning. Nat. Neurosci.11, 1177–1184.
48. Pouzat, C., Mazor, O., and Laurent, G. (2002). Using noise signature to optimize spike-sorting and to assess neuronal classification quality.