COST Action 358
Pedestrian Quality Needs
Country Report Switzerland
State-of-the-art in walking policy,
communication and research
Daniel Sauter & Melanie Kunz
Urban Mobility Research
Dominique von der Mühll & Sonia Lavadinho
EPFL Laboratoire CHÔROS
With the support of
Gabrielle Gsponer & Heidi Meyer
Swiss Federal Roads Office (FEDRO)
Financially supported by
State Secretariat for Education and Research (SER)
Swiss Federal Roads Office (FEDRO)
Colophon:
Authors: Daniel Sauter and Melanie Kunz, Urban Mobility Research, Muehlebachstrasse 69, 8008 Zurich, Switzerland; contact e-mail: daniel.sauter@urban-mobility.ch
Dominique von der Mühll and Sonia Lavadinho
EPFL-ENAC-Chôros Bâtiment polyvalent, Station 16, 1015 Lausanne, Switzerland; contact e-mail: dominique.vondermuehll@epfl.ch
Supported by: Gabrielle Gsponer and Heidi Meyer, Swiss Federal Roads Office (FEDRO), Bern, Switzerland; www.langsamverkehr.ch; www.mobilite-douce.ch; www.traffico-lento.ch
Photos title page Daniel Sauter, Urban Mobility Research
Acknowledgments This work has been financially supported by the Swiss State Secretariat for Education and Research (SER) and the Swiss Federal Roads Office (FEDRO) within the frame-work of the Swiss participation in the European COST-Action 358 ‘Pedestrian Quality Needs’.
Distribution: The report can be downloaded from the following websites:
www.walkeurope.org; http://choros.epfl.ch; www.urban-mobility.ch
Content
Content
... 5
1.
Introduction ... 7
2.
Facts and figures: data on walking ... 9
2.1 Introduction ...9
2.2 Land-use and transport infrastructure ...10
2.3 Demography ...11
2.4 Disabilities, personal health, physical activity and body weight...12
2.5 Transport and travel data ...15
2.6 Road danger (safety) and single pedestrian accidents ...21
2.7 Accessibility of services (macro level)...25
2.8 References...28
3.
Publications and research ... 29
3.1 Introduction ...29
3.2 Publications...30
3.3 Current research projects...38
3.4 Websites ...39
3.5 Magazines and journals ...40
4.
Legal framework for walking ... 41
4.1 Intoduction ...41
4.2 The legal system in the federalist Swiss setting...41
4.3 Footpaths and hiking trails ...43
4.4 Traffic regulations and road norms...43
4.5 Equality of persons with disabilities...45
4.6 Spatial and urban planning ...46
4.7 Environmental protection (climate, air, noise, water, soil) ...46
4.8 Health and sports ...47
4.9 Financing and taxing ...47
4.10 Overview of legal enactments relevant for walking ...48
4.11 References...49
5.
Policy-making ... 51
5.1 Walking and „Human-powered mobility“ become a topic ...51
5.2 About the Swiss federal system ...51
5.3 Urban planning and transport policies: at the core of the action to promote walking ...52
5.4 Human-powered mobility in current policies at the federal, cantonal and municipal level ...53
5.5 Road safety policy: rather technical and still pending...60
5.6 Sports policy: developed with enthusiasm but little implementation ...60
5.7 Research policy: still neglected, but improving ...61
5.8 Impulse programs: a shift of focus from environment to health...61
5.9 Organisational and political actors: essential work preparing the ground ...63
5.10 Education and training of professionals: a gap in sensitizing ...64
5.11 Conclusion ...65
6.2 Urban Planning Strategies ...69
6.3 Reallocation of road space, reduction of speed ...73
6.4 Evaluation tools...75
6.5 Communication and sensitizing actions ...76
6.6 Pilot schemes and new proposals ...79
6.7 Cartography ...81
7.
General atmosphere... 83
Annex
... 89
A) Detailed descriptions of publications ...89
Introduction 7
Country Report Switzerland
1.
Introduction
This country report provides an overview of the state-of-the-art in Switzerland. In the past years we have seen an increasing interest in the issues of walking particularly triggered by some new research, the crea-tion of a specialised unit for walking and cycling within the federal roads administracrea-tion, new ideas cre-ated in the model-city Burgdorf and the agglomeration projects which require cities and their surrounding areas to tackle traffic problems in a joint approach. All these efforts have led to a number of publications, new administrative structures and improved provisions and exemplary projects for pedestrians.
This report describes the developments and assembles the relevant information on walking in Switzerland in the past 10 to 15 years. It contains data on walking and deals with the legal framework, policy-making and best practices and innovations, e.g. in terms of strategies, communication, pilot-schemes and evalua-tion. In addition, all relevant publications and research projects of the past ten years have been listed and annotated, providing for the first time an overview of the research performed in the field. This collection, together with the other parts of the country report, will allow researchers and interested persons to get a quick overview of current practices and available information. It will also serve as a monitoring instrument in the longer term allowing comparisons in the future with the state of today.
The report follows the format agreed upon within the COST action for all country reports. Each chapter contains specific data and information providing a kind of reference book supplemented by some per-sonal assessments by the research team. The information was collected to the best of the knowledge of the research team but it is possible that some information was overlooked or can’t be given in the detail desirable. Those persons who would like to get a quick general impression of the Swiss situation should consult chapter 7 on the “general atmosphere” directly.
This is the updated final version of the report being published in autumn 2010. It replaces the first draft released two years earlier.
Chapter 2: Facts and figures: data on walking 9
Country Report Switzerland
2.
Facts and figures: data on walking
2.1
Introduction
This chapter gives a brief overview of the most relevant data on walking in Switzerland, providing an im-pression of the situation and of the developments. Since there is a separate questionnaire and paper dealing with the availability and methodology of data collection (definitions, data quality etc), these issues are not discussed here. The questionnaire information is available as PQN report B4 and as separate annex in the CD-ROM.
In this country report only those dimensions are presented where data is available on the national level and were it has a certain reliability and validity. Only in some parts included are results of single research projects and other sources (e.g. data from specialised associations). Most data refers to the year 2005 and is taken from official statistics. Some own calculations were added, particularly in the field of transport data. The chapter is divided up into six parts:
• Land use and transport infrastructure
• Demography
• Disabilities, personal health assessment, physical activity and body weight
• Transport and travel data
• Road danger (safety) and single pedestrian accidents
• Accessibility of services (macro level)
The Swiss Federal Roads Office has defined a concept to improve the collection of data on walking and cycling (Infras 2005, see publications in chapter 3). It will be implemented step by step allowing more comprehensive and qualitative better data on walking.
2.2
Land-use and transport infrastructure
Land-use
Mountains, lakes and forests take up a substantial part of the Swiss territory. A little more than a third is cultivated land (farming including mountain farming) and about 7% of the territory is used for settlements. These settlements and urban areas have expanded by roughly 13% since the early 1980s, mainly at the expense of agricultural land. This means that, every second, just under one square metre of farming land was developed. Built-up land accounts for half the settled area, and transport infrastructure for one third (the rest consists of industrial sites, parks and recreational areas, landfills, etc.). Woods/forests have also expanded, mainly in fringe areas (brushwood encroaching on isolated alpine pastures). (Source: SFSO, Swiss Federal Statistical Office: Statistical Data on Switzerland 2007, summary booklet)
Figure 1: Land use in Switzerland (based on land use statistics 1992-1997)
km2 % Forest, woods 12,716 30.8 Cultivated land 9,873 23.9 Mountain farming 5,378 13.0 Settlements 2,791 6.8 Rivers/lakes 1,740 4.2
other unproductive areas 8,787 21.3
Total area 41,285 100.0
Source: Statistical Data on Switzerland 2007 (summary booklet), Swiss Federal Statistical Office (SFSO)
Transportation infrastructure: roads and footpaths
Figure 2: Transportation networks in km
Network in km 1970 1980 1990 2000 2005
Rail 4,991 4,982 5,030 5,062 ...
Road 60,139 66,545 70,970 71,132 71,296
of which national highways 651 1,170 1,495 1,638 1,756
Footpaths … … … … …
Source: Statistical Data on Switzerland 2007 (summary booklet), Swiss Federal Statistical Office (SFSO)
The different lengths of the transport networks can be seen in the table above. There are no figures avail-able on the length of footpaths. This is due to the fact that walking provisions have not been given much attention so far, but also due to the federalist system in which information on footpaths is only available on the local level. And last but not least it is difficult to determine how the length of footpaths should be measured. Is it all surfaces which can be used by pedestrians? This would mean all single footpaths and most roads (except for highways). If so, do sidewalks count double if there are on both sides of a street? How do we count hiking trails and non-official paths and trails (short cuts) in urban and rural areas? And what about the fact that the number of destinations and origins for pedestrians is theoretically infinite, meaning the footpath network would be infinite too? What about the fact that walking often is not linear but happens over a whole area (e.g. in pedestrian zones, parks etc.)? Would it be smarter to use km2 instead of just km? And what about the quality of the network? All these issues will have to be addressed during the discussions on harmonising measurements of walking.
There is also no data available on the number and length of streets in speed 30 kph zones, in so called encounter zones (20 kph, pedestrian priority => home zones) or in pedestrianised areas (see also chapter 6).
Chapter 2: Facts and figures: data on walking 11
Country Report Switzerland
2.3
Demography
Switzerland has a population of about 7.5 million. 80% of them are Swiss citizens, the rest have passports from other countries1. In the last 30 years the population grew by more than one million people or 18%.
Figure 3: Population of Switzerland: developments since 1970 according to sex and citizenship
In Thousands Men Women Swiss citizens Citizens of other
countries Total 1970 3 025.3 3 167.7 5 191.2 1 001.9 6 193.1 1975 3 079.8 3 241.2 5 288.4 1 032.6 6 321.0 1980 3 082.0 3 253.3 5 421.7 913.5 6 335.2 1985 3 160.4 3 324.5 5 524.2 960.7 6 484.8 1990 3 298.3 3 452.4 5 623.6 1 127.1 6 750.7 1995 3 448.8 3 613.5 5 698.8 1 363.6 7 062.4 2000 3 523.2 3 682.9 5 783.8 1 422.3 7 206.1 2005 3 652.5 3 806.6 5 917.2 1 541.9 7 459.1
In Percent Men Women Swiss citizens Citizens of other
countries Total 1970 48.9% 51.1% 83.8% 16.2% 100% 1975 48.7% 51.3% 83.7% 16.3% 100% 1980 48.6% 51.4% 85.6% 14.4% 100% 1985 48.7% 51.3% 85.2% 14.8% 100% 1990 48.9% 51.1% 83.3% 16.7% 100% 1995 48.8% 51.2% 80.7% 19.3% 100% 2000 48.9% 51.1% 80.3% 19.7% 100% 2005 49.0% 51.0% 79.3% 20.7% 100%
Source: Statistik des jährlichen Bevölkerungsstandes, BFS 2006a
The age structure is developing as in most other European countries: There are now many more elderly people than 50 years ago. The number of over 64-year-olds has more than doubled since 1950, while the number of 80+ year-olds has even quadrupled. In contrast, the number of under twenties has increased much less and has actually declined since the early Seventies. This aging process is the result of longer life expectancy and fewer births. According to recent population scenarios, this trend will continue over the next few decades. By 2030 it is expected that about one quarter of the population will be over 65 years old (in 2005 this share was at 16%). (Source: SFSO 2007)
Figure 4: Age structure of Swiss population since 1910 and scenarios
until 2050
Source: Statistical Data on Switzerland 2007 (summary booklet), SFSO
1
This proportion is partly due to the restrictive naturalization policies. It is more difficult than in some other European countries to obtain Swiss citizenship.
2.4
Disabilities, personal health, physical activity and body weight
Disabilities
In 2007 about 100’000 people, 1.2% of the population of 15 years and older, were severely visually im-paired, 1.3% had a hearing disability and 1.6% had difficulty to speak. Almost 3% of the population had severe difficulties to walk. In terms of doing their daily activities, 3.4% were not able to independently complete Activities of Daily Living (ADL) such as getting up, getting washed and dressed and 14.1% had impediments with Instrumental Activities of Daily Living (IADL) such as cooking or phoning2. However, not all people that mentioned a disability also perceived it as such: 12.2% of the population felt themselves to be disabled in their daily lives. Among elderly people the share of disabilities is, obviously, higher. In total 250’000 persons (3.2% of the population) received a disability pension in 2009. Of them, almost three quarters have a disability of 70 to 100%.
Figure 5: % of persons with difficulties in their daily lives: Swiss population 15 years and older, 2007
ADL: Activities of Daily Living (getting up, washing, going to toilette)
IADL: Instrumental Activities of Daily Living
(cooking, phoning etc.) Felt / perceived disability
3.4% 14.1% 12.2%
Source: BFS 2009 based on Schweiz. Gesundheitsbefragung 2007
A different national survey shows for the year 2005 that a similar proportion, about 2% of the population of 6 years and older is severely restricted in their daily mobility on foot due to physical disabilities. Again, the proportion is higher among elderly people with 7%. It needs to be taken into account that the number may be underestimated since persons in homes and hospitals were not included in this survey3.
Figure 6: Proportion of population being severely restricted in their daily mobility on foot due to physical disabilities
200 metres or more Can walk but no more
than 200 metres Can not walk at all Gesamt N
6-20 years old 99.8% 0.1% 0.1% 100% 5,575
21-64 years old 98.9% 0.9% 0.2% 100% 20,990
65 years and older 93.0% 6.3% 0.7% 100% 6,815
Total 98.1% 1.7% 0.2% 100% 33,380
Source: own calculation based on Mikrozensus Verkehrsverhalten 2005, BFS/ARE 2007
All these figures focus on persons with severe disabilities. Not mentioned here are people with temporary illnesses and disabilities (e.g. persons with a broken leg walking on crutches) and people with temporary and limited restrictions of their mobility (e.g. persons pushing a stroller, heavy suitcase etc.). It can be assumed that hundreds of thousands of people are affected in this way in addition to the persons with more permanent and severe disabilities.
Personal assessment of health
”In 2002, 88% of men and 84% of women described their health as good or very good and only 3% of men and 4% of women qualified it as bad or very bad. However, temporary physical and mental problems often seem to have a negative effect on work and everyday life”. (Source: Statistical Data on Switzerland 2007, SFSO, p.26). This rate did not change 5 years later when 86.8% of the population over 15 years said they felt good or very good (health survey 2007).
2
ADL and IADL comprise different types of disabilities that include physical, mental and psychological impairments. Only people living in private households were included but not those living in homes for the aged, nursing homes or in hospitals.
3
It is estimated that around 30,000 persons live in institutions. Most of these persons have severe disabilities (16,500 physically disabled, 11,500 with a mental and 2,200 with a sensoric disability. (Zwicky 2003, p. 169).
Chapter 2: Facts and figures: data on walking 13
Country Report Switzerland
Physical Activity
A newly developed indicator allows for refined assessments about the population’s physical activity. It indicates for the year 2007 that nearly 32% of the population is very active and trained. At the other end of the scale, almost one sixth of the population (15.9%) is not active at all. Anyone being at least regularly active fulfils the HEPA recommendations for healthy activity levels.
It appears that the trend towards increased inactivity has been stopped or even reversed in recent years. In 2007, less people are completely inactive and more people are trained compared to 2002. During the 1990’s the share of very active persons remained stable, but the proportion of non active people rose. These proportions were calculated, however, based on an earlier definition of physical activity measured as the number of times people sweated during leisure time activities.
Figure 7: Detailed indicator of physical activity for 2002 (N=18,719) and 2007 (N=17'907)
Activity level 2002 2007 detailed description
Inactive 19.4% 15.9% no activities at all
Partially active 19.1% 18.7% at least 30 minutes moderate intensity per week or 1 day with sweating episode Non-regularly active 25.6% 24.3% at least 150 mins. moderate intensity per week or 2 days with sweating episodes Regularly active 8.9% 9.3% at least 5 days with each day at least 30 minutes of moderate intensity activity
Trained 27.0% 31.8% at least 3 days per week with a sweating episode
Sources: Schweizerische Gesundheitsbefragungen, BFS: Lamprecht/Stamm 2005, p. 10; Observatorium Sport und Bewegung Schweiz, Indikator 1.1.
About a third of the population (34%) walks for a total of more than 30 minutes a day, thus covering the recommended time of physical activity by walking (although they may be additionally active). However, many of these stages or trips may be very short with little health effect. Commonly it is recommended that a walking stage should take at least 10 minutes to have some health effect. If only those people are counted whose walking stages each time consist of at least 10 minutes (in total also walking more than 30 minutes per day), then 30% of the population spend at least the recommended time of physical activity by walking4.
Children, young people and seniors walk more often 30 minutes and longer per day than the rest of the population. It has to be said, however, that many children are far more active running around and playing outside than during goal-oriented mobility (e.g. going to school, shopping etc.). And for children the rec-ommended minimal time for physical activity is substantially longer – in Switzerland it is 1 hour.
Figure 8: Proportion of population walking more than 30 minutes per day, 2005 30 and more minutes
walking per day
30 and more minutes walking per day
with stages of at least 10 minutes N
6-20 years 38.8% 33.8% 5,575
21-64 years 31.5% 27.1% 20,997
65 years & more 41.1% 38.2% 6,818
Total 34.4% 30.2% 33,390
Source: own calculation based on Mikrozensus Verkehrsverhalten 2005, BFS/ARE 2007
Recent research results in Switzerland suggest that people who are physically very active are not neces-sarily those who also walk often. The two groups can be distinguished in a statistically significant manner. Those who do sports and/or are active at work or in their garden are only partially also walking more than 30 minutes a day (see Schad et al., 2008).
4
These figures can not be compared with the ones above since these here are based on the travel behaviour survey which only covers one day per person. The person who walked more than 30 minutes today may not do that the next day as well. The re-sults allow only a general statement about the whole population and not about behaviour patterns of individuals.
24.9 28.1 29.4 29.2 33.1 35.5 37.5 37.8 17.1 21.2 21.8 20.9 5.4 6.8 7.7 8.1 6.1 6.7 7.9 8.6 4.7 7.0 7.5 7.7 0 10 20 30 40 50 60 70 80 90 100 1992 1997 2002 2007 1992 1997 2002 2007 1992 1997 2002 2007
Total population (age 15+) Male pop. (age 15+) Female pop. (age 15+)
overweight (BMI 25-29.9 kg/m2) obese (BMI ≥ 30 kg/m2)
5.3 3.3 12.9 10.6 5.1 3.9 12.5 11.3 5.4 2.6 13.2 9.9 6.6 4.3 7.4 5.4 5.7 3.2 0.4 0.7 0.3 0.8 0.4 0.5 0 5 10 15 20 25 30 35 40 45 50 1960-65 1980-90 2002 2007 1960-65 1980-90 2002 2007 1960-65 1980-90 2002 2007
Total (age 6-12/13) Boys (age 6-12/13) Girls (age 6-12/13) overweight obese
Body Mass Index
The latest figures on the Body Mass Index indicate that the share of overweight people in Switzerland is stabilising. In 2007, 37.3% of the population over 15 years old were overweight (8.1% of them obese). This is about the same share as 5 years earlier, but substantially higher than 15 years ago. In 1992, only 30.3% of the population where overweight (5.4% of them obese).
Figure 9: Body mass index
(BMI) in % of Swiss population over 15 years 1992-2007 according to
gender
Source: Schneider, Venetz & Gallani Berardo, HealthEcon 2009a and 2009b based on
Schweiz. Gesundheitsbefragung 2007
There are substantial differences according to age and gender. But not only obesity is a problem: almost one third of all young women (age 19-34) are underweight.
Figure 10: Body mass index (BMI) in % of Swiss population 2002 according to age and gender
Gender Age underweight
BMI < 20 normal weight BMI 20-24.9 overwheight BMI 25 - 29.9 obese BMI > 30 Men 19-34 6.5% 61.5% 28.1% 3.9% 35-64 2.5% 44.1% 43.4% 9.9% 65+ 2.8% 39.2% 47.0% 11.0% Women 19-34 31.1% 52.1% 12.6% 4.3% 35-64 16.4% 52.1% 23.1% 8.4% 65+ 10.2% 44.2% 34.7% 10.9%
Source: Gesundheitsstatistik BFS 2007 (information booklet 2007)
For children the assessment of overweight is more difficult and can’t just be based on the BMI because there is a constant change of the relation between height and weight. Internationally reference criteria have been developed that allow for the assessment of obesity in children which were also used in Swit-zerland. According to Swiss studies about 15% of the children between 6 and 12/13 years were over-weight (4.3% of them obese). This is down from 2002 when 19.5% were measured as overover-weight (6.6% of them obese). The rate, however, is still higher than in the mid 1960’s with around 5.7% overweight children (0.4% of them obese). The figures have to be considered approximations since the methodologi-cal uncertainties are considerable.
Figure 11: Prevalence of overweight and obese children aged 6 to 12/13 years according to gender
1960/65 and 2007
Source: Schneider, Venetz & Gallani Berardo, HealthEcon 2009a and 2009b based on
Chapter 2: Facts and figures: data on walking 15
Country Report Switzerland
2.5
Transport and travel data
Methodology
The Swiss Travel Survey (microcensus) is carried out every 5 years. In 1994 the so-called stage concept was adopted which means that every single mode of transport on a trip is recorded. This produces sub-stantially more adequate information on walking than the previous type of surveys (trip based). The follow-ing definitions are used:
Every stage is determined by the use of one particular mode of transport. Thus, when the mode changes, a new stage starts (but not a new trip). A stage is only recorded if it is longer than 25 metres; changes of location within private or business spaces are not recorded.
A trip consists of one or several stages and is defined by the purpose, i.e. the activity at the destination. The trip ends when the destination is reached. If the purpose changes on the way, then a new trip starts.
Data is collected of all persons from the age of 6 years for one given day. The person is contacted by phone and is interviewed about the mobility on the previous day. The survey takes place during a full year taking into account all weekdays and seasons.
Characteristics of daily mobility on foot
On average 90% of the people living in Switzerland are mobile on any given day. This share is lower with older people and on weekends. The average number of trips is 3.3 per day; again the elderly population makes fewer trips (2.4). 62% of the population made at least one stage per day on foot. This share is larger with children.
Figure 12: Some characteristics of daily mobility of the Swiss population, 2005
Number of persons sur-veyed
Persons mobile on survey day
Number of trips per day
Share of persons with at least one stage on foot on
day surveyed
6-20 years 5,575 90.3% 3.4 69.8%
21-64 years 20,997 91.2% 3.5 59.7%
65 and older 6,818 79.6% 2.4 62.1%
Total 33,390 89.1% 3.3 61.9%
Source: Mikrozensus Verkehrsverhalten 2005, BFS/ARE 2007
On average, people living in Switzerland walk for 35 minutes a day and cover a distance of 2.1 kilometres. Active pedestrians – i.e. those people who walked on the particular day surveyed – did that for almost an hour, covering a distance of 3.5 kilometres.
Figure 13: Average and median time (left) and distance (right) walked per day 2005 according to age group
59 19 10 66 57 57 35 39 40 33 34 48 31 35 7 15 0 10 20 30 40 50 60 70 6-20 years 21-64 years 65 years & more Total 6-20 years 21-64 years 65 years & more Total
Average population . Walkers only
M in u te s Average Median 3.5 3.6 3.4 3.1 2.1 2.2 2.0 2.2 2.2 2.5 2.1 2.2 1.2 0.4 0.8 0.6 0.0 0.5 1.0 1.5 2.0 2.5 3.0 3.5 4.0 6-20 years 21-64 years 65 years & more Total 6-20 years 21-64 years 65 years & more Total
Average population . Walkers only
K il o m e tr e s Average Median
The average time and distance is, however, somewhat misleading because a small proportion of the population walks quite far and for a long time while the majority does not do that. This fact is expressed with the calculation of the ‘median’. It marks the value which splits the population in half: 50% are above the given value and 50% below. For example: while the average population walks for 35 minutes a day, the median is at 10 minutes meaning that half of the population walks more than 10 minutes and the other half walks less than 10 minutes. The gap is particularly large among the 21 to 64 year-olds. Similarly with the distance walked by active pedestrians: half of them walk for more than 2.2 km a day and the other half less (median) while the average distance is 3.4 km.
Elderly persons have fewer trips in total but they walk for longer and walk further than the average popula-tion. Children make more trips than the elderly but they walk about the same distance and for the same time as they do.
Since 1994, the average time and distances people walk has increased by about a third; children have an even higher increase. It is not clear, however, how much is due to improved methodology. Detailed analy-ses showed that until the year 2000 the short walking stages connecting to other modes of transport (car, bus, train etc.) were not adequately recorded. The figures below just give the average but the picture is similar when looking at the median.
Figure 14: Average time (left) and distance (right) walked per day 1994, 2000 and 2005 according to age group (N= 18,020, 29,407 and 33,390 persons) 0 5 10 15 20 25 30 35 40 45
6-20 years 21-64 years 65 years & more Total
M in u te s 1994 2000 2005 0.0 0.5 1.0 1.5 2.0 2.5
6-20 years 21-64 years 65 years & more Total
K il o m e tr e s 1994 2000 2005
Source: Mikrozensus Verkehrsverhalten 1994, 2000, 2005, BFS/ARE 1996, 2001 & 2007 (own calculation)
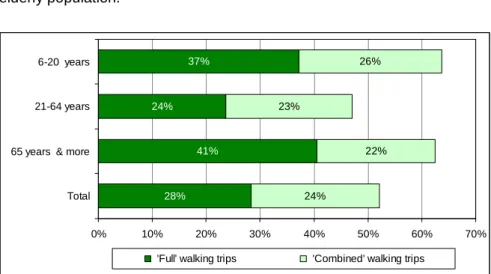
‘Full’ and combined walking trips
28% of all trips are done by walking alone. Additionally 24% are combined trips. This means walking is part of a trip together with another mode of transport. The share of ‘full’ walking trips is highest among the elderly population.
Figure 15: ‘Full’ and
com-bined walking trips according to age group 2005 (N=108,880 trips)
Source: Mikrozensus Verkehrsverhalten 2005, BFS/ARE 2007 (own calculation) 28% 41% 24% 37% 24% 22% 23% 26% 0% 10% 20% 30% 40% 50% 60% 70% Total 65 years & more 21-64 years 6-20 years
Chapter 2: Facts and figures: data on walking 17
Country Report Switzerland
Trip purpose and walking
39% of all work-related stages and about half of all shopping stages are made on foot. In comparison, almost 60% of all stages to and from school are walking stages.
Figure 16: Proportion of walking stages measured against all stages according to purpose 2005 (N=163,870 stages) Proportion of walking stages of all stages
Work 38.6%
Education (to and from school) 58.9%
Shopping 48.4%
Leisure 47.0%
Accompaniment & Service 26.5%
Total 44.9%
Source: Mikrozensus Verkehrsverhalten 2005, BFS/ARE 2007 (p. 41 and own calculation)
Share of transport modes according to number of stages, time and distance
The share of transport modes can be calculated in different ways. Usually this is done on the basis of the daily distance travelled. Because walking trips are usually short, this means that the share of walking is very small based on this calculation. More adequate is the distribution according to time spent or number of stages.
The data for Switzerland 2005 shows that 45% of all stages are done by walking. And 40% of the time spent in traffic is done so as pedestrian while the distance walked makes up only 6% of all distances trav-elled. For all modes see table below.
Figure 17: Share
of transport modes according to number of stages, time spent and daily distance travelled 2005 (N=33,390
per-sons)
Source: Mikrozensus Ver-kehrsverhalten 2005, BFS/ARE 2007 45% 40% 6% 5% 5% 12% 11% 20% 37% 41% 69% 2% 3% 4% 1% 0% 10% 20% 30% 40% 50% 60% 70% 80% 90% 100%
number of stages time spent distance
Figure 18: Share of transport modes in detail according to number of stages, time spent and daily distance travelled 2005 (N = 33,390 persons)
number of stages time spent distance
Walking 44.9% 39.7% 5.5%
Cycling 5.3% 4.7% 2.1%
Total walking & cycling 50.2% 44.4% 7.6%
Moped 0.3% 0.2% 0.2%
Motorcycle 1.2% 1.3% 1.6%
Car driver 27.3% 28.6% 48.1%
Car passenger 8.3% 10.5% 18.8%
Total motorized transport 37.1% 40.7% 68.8%
Railway 3.9% 5.9% 16.1%
Postbus 0.4% 0.4% 0.4%
Tram/bus 7.2% 4.9% 4.0%
Total public transport 11.5% 11.1% 20.4%
Other 1.2% 3.8% 3.2%
Total all 100.0% 100.0% 100.0%
Source: Mikrozensus Verkehrsverhalten 2005, BFS/ARE 2007
Share of transport modes according to trips
The disadvantage of the presentation according to stages or time spent is that it does not reflect the share of transport modes on a full trip since a trip can comprise different modes. One solution is to present the trips divided up into those parts with ‘just’ one mode of transport and those with combination of modes. For the Swiss data it can be shown that relatively few combination types cover most of the daily mobility of people. It is, thus, the following modes/combinations which are used in the presentations below:
Walking: the whole trip is walked (from door to door): ‘full’ walking trip Cycling: the whole trip is cycled (from door to door): ‘full’ cycling trip
Public transport and walking: the trip is a combination of both modes (public transport may include bus, tram, train etc. but not taxi)
Walking, cycling and public transport: the trip is either a combination of all three modes or of cycling and public transport or cycling and walking
Car / motorcycle: the whole trip is made with a motorised vehicle – either as driver or as passenger; ‘full’ motorised trip
Walking, car or motorcycle: the trip is a combination of a motorised mode with walking, most often a walking trip to and from the parking lot and a drive
Other modes/combinations all trips made with other modes (e.g. boat, taxi etc.) or combinations of all kind of modes which are not mentioned above
Choice of transport mode according to age (over a lifetime)
A detailed analysis according to age (measured in single years) shows that the number of trips per day starts to diminish continuously after the age of 50. Children make by far most of their trips on foot. Later on in life motorized trips increase substantially, again until about the age of 50 when they slowly start to diminish. Although the data is recorded for only one day per person and only for the year 2005, the figure can serve as an indication of mobility patterns over a life time.
Chapter 2: Facts and figures: data on walking 19
Country Report Switzerland
It has to be taken into account, however, that this picture is static and not reflecting changes over time, e.g. that people in general are getting older or that more women now drive compared to 20 years ago (so called ‘cohort effect’).
Figure 19: Number of trips according to choice of transport mode and age (N=33,390 persons)
Walking Cycling
Public transport / walking
Car / motorbike
Walking / car / motorbike Other modes / combinations 0.0 0.5 1.0 1.5 2.0 2.5 3.0 3.5 4.0 5 10 15 20 25 30 35 40 45 50 55 60 65 70 75 80 85 90 Age N u m b e r o f tr ip s p e r d a y
Walking Cycling Public transport / walking Car / motorbike Walking / car / motorbike Other modes / combinations
Source: Mikrozensus Verkehrsverhalten 2005, BFS/ARE 2007 (own calculation)
Seen in percentages the proportion of walking is not only high during childhood but also in the older age. From the age of 50 years upward, walking trips increase – as ‘full’ walking trips but also together with public transport. At the same time the proportion of trips with motor vehicles diminishes.
Figure 20: Choice of transport mode according to age (N=33,390 persons) *
Walking Cycling
Public transport / walking
Car / motorbike Walking / car / motorbike Other modes / combinations 0% 20% 40% 60% 80% 100% 5 10 15 20 25 30 35 40 45 50 55 60 65 70 75 80 85 90 Age S h a re o f tr ip s
Walking Cycling Public transport / walking Car / motorbike Walking / car / motorbike Other modes / combinations
Source: Mikrozensus Verkehrsverhalten 2005, BFS/ARE 2007 (own calculation)
* The ‘jagged’ line within the same age bracket is due to the sampling method and not statistically significant. This is particularly true for the ages beyond 80 years where not so many persons are included in the sample.
Choice of transport mode on trips to and from school
Due to the specific characteristics of the Swiss school system, most children go home at lunch time and return to school in the afternoon. This means that during the compulsory schooling years most children have 2 to 4 school trips per day (some afternoons are free depending on the age).
The share of ‘full’ walking trips to school continues to be high in Switzerland. In primary school, on aver-age 70% of all school trips are done by walking only, between the aver-ages of 13 and 15 years, cycling be-comes almost as important and then public transport (combined with walking). Driving children to school by car is still not very common. The largest share is measured in affluent suburban communities and among parents with two and more cars in the household. Driving children to school is also higher in the French speaking part of Switzerland compared to the German speaking areas.
The share of walking has remained fairly stable between 1994 and 2005 while the proportion of cycling has diminished dramatically, by about 40%. School trips by public transport have increased, particularly among young people (16 years and older).
A detailed analysis of school and leisure trips by children and young people in the Swiss context has been undertaken by Sauter 2005 and 2008 (see literature, summaries in English available).
Figure 21: Children and adolescent’s choice of transport mode to/ from school 1994, 2000, 2005 by age
0% 10% 20% 30% 40% 50% 60% 70% 80% 90% 100% 1 9 9 4 ( N = 1 ,1 8 9 ) 2 0 0 0 ( N = 1 ,9 9 3 ) 2 0 0 5 ( N = 2 ,1 8 8 ) 1 9 9 4 ( N = 9 2 8 ) 2 0 0 0 ( N = 1 ,6 7 1 ) 2 0 0 5 ( N = 1 ,9 7 6 ) 1 9 9 4 ( N = 9 8 2 ) 2 0 0 0 ( N = 1 ,7 4 9 ) 2 0 0 5 ( N = 2 ,0 1 8 ) 1 9 9 4 ( N = 3 5 3 ) 2 0 0 0 ( N = 7 6 4 ) 2 0 0 5 ( N = 7 9 0 ) 1 9 9 4 ( N = 2 7 8 ) 2 0 0 0 ( N = 5 6 0 ) 2 0 0 5 ( N = 4 6 3 ) 1 9 9 4 ( N = 3 ,7 3 0 ) 2 0 0 0 ( N = 6 ,7 3 7 ) 2 0 0 5 ( N = 7 ,4 3 5 )
6-9 Years 10-12 Years 13-15 Years 16-17 Years 18-20 Years Total Walking Cycling Pub.transp./walk. Walk./cycling/pub.transp. Car/motorcycle Walk./car/motorcycle Other
Source: Sauter 2008 (based on Mikrozensus Verkehrsverhalten 1994, 2000, 2005: BFS/ARE 1996, 2001 and 2007)
Choice of transport mode according to number of cars in a household
The number of cars in a household has a substantial effect on the modes used. For example on trips to and from leisure activities: Persons living in car free households are by far more often actively mobile (walking and cycling) and use more often public transport than persons living in households with one or several cars. This is true for all age groups.
While 47% of people in car free households walk and 8% of them cycle on their leisure trips, it is only about half of that share for those people who live in a household with three or more cars. They instead have the highest proportion of car-trips. Two thirds of all their trips are made with a motor vehicle. In car free households this share is only 16%. This is true (with only minor differences) irrespective if people live
Chapter 2: Facts and figures: data on walking 21
Country Report Switzerland
in the city or out in the country. Such results call for political action when considering that the number of households with several cars is constantly increasing and that children are as affected by this behaviour as all other age groups. Action is needed particularly in the light of the increasing health problems due to lack of physical activity and the increasing ecological problems in connection with climate change.
Figure 22: Choice of transport mode on leisure trips according to number of cars in a household and age group
2005 Source: Sauter 2008 (based on Mikrozensus Verkehrsverhalten 1994, 2000, 2005: BFS/ARE 1996, 2001 and 2007)
2.6
Road danger (safety) and single pedestrian accidents
General developments: casualties and the problem to measure exposure
Over the five past years about 2,400 pedestrians per year have suffered from injuries of traffic accidents; 700-800 of them were severe injuries and between 60 and 80 pedestrians died. The number of seriously injured and killed pedestrians has decreased over the past 15 years, particularly between 1995 and 2005, not so much since then. The decrease is probably due to a number of reasons. Many cities have intro-duced 30 kph zones in their neighbourhoods and some major roads have been improved for pedestrians. Further, the legal limit for driving with alcohol has been lowered and traffic fines have been increased. Nevertheless, the number of casualties for an everyday activity like walking is far too high. While the se-vere accidents in absolute numbers and per 100,000 inhabitants have been reduced there is no clear indication that the risk in terms of exposure has been reduced as well. Although general statistical figures are lacking, it is, for example, not known how much the fact that parents accompany their children more often has led to a lower risk exposure for children while the danger remained the same (see also below). Measuring exposure in walking is difficult for a number of reasons: It is often not known how much of the walking is done exactly (difficulty to assess exact time spent in traffic walking). And it is in particular often not known how much of the walking is done on roads which are exposed to traffic and how much is done on footpaths, pedestrian zones et cetera away from roads. Furthermore, the risk for pedestrians is highest when crossing a road. There is, however, no data in Switzerland on how many crossings a person per-forms per day on which type of road and under which conditions.
If measured at all then often risk and exposure are assessed by the distance travelled. This figure is, however, not useful for pedestrians. More adequate is the time spent in traffic (with the difficulties tioned above). Although the Swiss data collection of walking time has been improved in 2005 (as men-tioned earlier), it is not clear if this is sufficiently reliable and valid for risk calculations. Due to the changes in methodology certainly no comparisons over time are possible.
0% 10% 20% 30% 40% 50% 60% 70% 80% 90% 100% N o c a r (N = 5 6 0 ) 1 c a r (N = 3 ,8 5 6 ) 2 c a rs (N = 2 ,9 2 9 ) 3 & m . c a rs (N = 6 5 0 ) N o c a r (N = 3 ,9 4 0 ) 1 c a r (N = 1 4 ,1 7 1 ) 2 c a rs (N = 8 ,1 6 0 ) 3 & m . c a rs (N = 1 ,8 6 0 ) N o c a r (N = 2 ,9 6 8 ) 1 c a r (N = 5 ,1 9 6 ) 2 c a rs (N = 1 ,0 1 8 ) 3 & m . c a rs (N = 1 2 6 ) N o c a r (N = 7 ,4 6 8 ) 1 c a r (N = 2 3 ,2 2 3 ) 2 c a rs (N = 1 2 ,1 0 7 ) 3 & m . c a rs (N = 2 ,6 3 6 )
6-20 years 21-64 years 65 and more years Total
Figure 23: Pedestrians injured or killed in road accidents between 1995 and 2009 in absolute numbers and per 100,000 inhabitants
absolute numbers per 100'000 inhabitants
Slightly injured Seriously
injured Killed Slightly injured
Seriously injured Killed 1995 1,788 1,153 126 25.3 16.3 1.8 2000 1,882 901 130 26.1 12.5 1.8 2005 1,647 707 69 22.1 9.5 0.9 2006 1,721 733 76 22.9 9.8 1.0 2007 1,690 793 79 22.3 10.4 1.0 2008 1,717 638 59 22.3 8.3 0.8 2009 1,756 704 60 22.6 9.0 0.8
Source: Strassenverkehrsunfälle in der Schweiz, BFS 2006b; Unfallgeschehen in der Schweiz, BFU 2006; STATUS 2010, BFU 2010.
Road danger according to age: the elderly and children
Going back to ‘traditional’ danger assessments of measuring casualties in proportion to the population we can see that children and elderly pedestrians have a much higher rate of being seriously injured or killed than other age groups. Pedestrians older than 75 years of age are three times more in danger than the average pedestrian and 6 times more compared to the age group of 25 to 44 year-olds. The particular vulnerability of young children and the elderly is also shown in the case fatality rate which measures the number of killed pedestrians per 10,000 victims.
Figure 24: Number of seriously injured and killed pedestrians per 100,000 inhabitants and case fatality rate according to age group 2005 (Case fatality = number of killed pedestrians per 10,000 victims)
0 - 6 years 7 - 14 years 15 - 17 years 18 - 24 years 25 - 44 years 45 - 64 years 65 - 74 years 75+ years Total
Seriously injured and killed
per 100,'000 inhabitants (2005) 9.8 14.8 14.1 7.8 5.4 7.8 15.5 30.8 10.4
Case fatality
average 2001-2005 329 91 204 250 249 746 1,171 2,191 691
Source: Unfallgeschehen in der Schweiz, bfu-Statistik 2006, p. 14 (based on Strassenverkehrsunfälle in der Schweiz, BFS)
How difficult it is to estimate the influences of exposure on accident rates can be seen by looking at chil-drens’ accident rates since 1976. This analysis shows that mainly the rate of children between 5 and 9 years has substantially decreased. Relatively seen (in percent) the rate of children on foot up to 5 years has had a similar decrease. Accidents of all other children (children using a bicycle, travelling as car pas-sengers or older children walking) have decreased much less. Although there are no figures available for Switzerland, those from other countries and general observations show that children, as pedestrians, are being increasingly accompanied and that their outside play is more and more often restricted. These two trends could explain the substantial decrease in accidents rates of children on foot up to 9 years. Other arguments support that thesis: it can be assumed that all the safety measures taken in the last 30 years, such as education, technical measures on roads and vehicles would have had a similar effect on all modes and on all ages, which is obviously not the case. It is only young children on foot who can be ac-companied and whose mobility and play can be relatively easy restricted. Children above the age of nine would not allow that and those on a bike are difficult to accompany.
Chapter 2: Facts and figures: data on walking 23
Country Report Switzerland
Figure 25: Casualties of children between 1976 and 2005 according to proportion of population and mode used
N u m b e r o f c h ild re n c a s u a lt ie s p e r 1 0 ,0 0 0 25 0 1976 1985 2005
22,4 5 - 9 years old on foot
15,1
7,5
7,3
4,7
10 - 14 years old on bicycle
10 - 14 years old on foot
5 - 9 years old on bicycle 0 - 4 years old on foot 7,7 9,1 5,6 2,7 3.3 1995
Source: Hüttenmoser/Sauter 2000 (updated calculation; based on Strassenverkehrsunfälle in der Schweiz (BFS)
Zebra crossings
About 38% of pedestrian accidents occur at a zebra crossing, 17% on pavements or on the side of the road and about 40% while crossing a street outside a regulated crossing. 5% occur at other places. The number of accidents at zebra crossings depends, of course, on the number of such provisions and the number of people using them. No data is available to establish the relevant rate. Elderly pedestrians have a higher probability of getting seriously injured or killed on zebra crossings than the average pedestrian. This could be due to the fact that they use these provisions more often compared to the rest of the popu-lation trusting that they would allow safe(r) crossings.
A study which was done in 1998 (only for that year) found that half of the pedestrian fatalities at zebra crossings happened on the second part of the crossing and had therefore nothing to do with a sudden step onto the road as is often implied. These accidents also involved mostly elderly people. According to police statistics, about 80% of the accident causes at zebra crossings lie with the driver only, about 5% are due to a fault by a pedestrian only and 13% by a fault by both of them. 2% have external causes5.
City and country
A comparison between city and countryside shows that more accidents happen in the city but the acci-dents and the injuries are more serious in smaller villages out in the country. The smaller the community, the larger the proportion of serious injuries and fatalities. This is mostly due to main highways cutting across smaller communities with higher speeds being driven. Along the main streets also lie most of the places pedestrians need to go.
5
In general (not only on zebra crossings) 28% of accidents involving a pedestrian are caused by the pedestrians alone, 54% by other road users and 18% by both parties (bfu 2007, p. 137)
0 5'000 10'000 15'000 20'000 25'000 30'000 35'000 40'000 Others Mopeds Pedestrians Motorcycles Bicycles Passenger cars
injured accident victims registred by police estimated injured accident victims not registered
Pedestrian casualties compared to other road users
Compared to other road users, pedestrians are more likely to get severely injured due to the lack of pro-tection and the age of the accident victims. In 2005 about 17% of all killed persons in traffic had been walking. The proportions are similarly high for seriously injured pedestrians (14%), but lower for slight injuries (8%). This illustrates that pedestrians are particularly vulnerable and are proportionately more often seriously injured or killed.
Figure 26: Number of road users injured and killed 1995, 2000 und 2005
Pede-strians Bicycles Other non-motorised vehicles Mopeds Motor-cycles Passen- ger cars Vehic. for transport of persons (buses) Vehic. for transport of goods (trucks) Other or unknown Total Pede-strians in % of total 1995 126 53 6 29 106 335 2 21 14 692 18.2% 2000 130 48 5 19 92 273 2 15 8 592 22.0% Killed 2005 69 37 3 6 86 178 13 10 7 409 16.9% 1995 1,153 1,006 26 504 1,234 2,807 47 117 39 6,933 16.6% 2000 901 959 27 305 1,364 2,431 45 122 37 6,191 14.6% Seriously injured 2005 707 815 44 190 1,451 1,721 33 75 23 5,059 14.0% 1995 1,788 2,346 76 1,234 2,537 13,100 185 514 46 21,826 8.2% 2000 1,882 2,284 55 935 3,136 14,714 172 606 83 23,867 7.9% Slightly injured 2005 1,647 2,322 106 614 3,519 12,736 176 504 71 21,695 7.6% Source: Strassenverkehrsunfälle in der Schweiz, BFS 1996b
Underreporting
The Swiss council for Accident prevention (Beratungsstelle für Unfallverhütung, bfu) has recently esti-mated that about 2/3 of injured pedestrians are not registered by the police when involved in an accident. Until now there is no regular data collection on the underreporting of traffic victims.
Figure 27: Estimated injured road users not being registered by police com-pared to registered accident victims 2005
Source: Unfallgeschehen in der Schweiz, bfu-Statistik 2006, Beratungsstelle für Unfallverhütung
Single pedestrian accidents
Statistics on single pedestrian accidents are not collected in Switzerland. Some single estimates of hospi-tal data have been made but they are not comprehensive and are, thus, questionable. Because of the international definition of accidents which requires a vehicle to be involved to count as a traffic accident, single pedestrian accidents are not included in the official Swiss statistics either.
A study of elderly people (65 years and older) in 1995 showed that for every accident involving a vehicle, fifteen single pedestrian accidents happen. Reasons for the single accidents are mostly slipping and fal-ling because of snow, ice and uneven surfaces. If all pedestrian casualties including the ones from single pedestrian accidents were counted, pedestrians were to make up three quarters of all casualties, while car drivers and passengers amounted only to about 5%(Hubacher/Ewert 1997).
Chapter 2: Facts and figures: data on walking 25
Country Report Switzerland
Figure 28: Distribution of casualties of seniors according to definition of accidents
and mode of transport 1995
Source: own calculations based on Hubacher/Ewert 1997)
2.7
Accessibility of services (macro level)
Accessibility to services can be measured in different ways. One is the average distance a person has to walk (or travel by other means) to reach certain services6. The following figure shows that public transport stops, restaurants and schools are very close for most people – only a few hundred metres away. Doc-tors’ offices, small food stores, bakeries and banks are all on average about one kilometre away. Hospi-tals (5.2 km), movie theatres (6.5 km) and supermarkets (8.8 km) are on the contrary much further away and generally not in walkable distance anymore.
Figure 29: Average distances to the nearest shops, services and public transport stops, 2001
Source: Dienstleistungen für die Bevölkerung: Erreichbarkeit 1998-2001, BFS 2006c Legend (from top): continued… (1) continued… (2)
food stores: large supermarkets (>2500m2
) pharmacies doctors’ offices
museums food stores: small supermarkets (400-2500m2
) petrol and service stations
movies dentists’ offices post offices
hospitals kiosks food stores (total)
day care facilities banks kindergarten, public and high schools
book stores public administrations restaurants, cafés
schools (secondary level II) bakeries, tea-rooms stops of public transport sports facilities small food stores (<400m2)
6
In this study the distance was calculated as the road distance between the centre of an inhabited hectare and 40 different services based on geo-coded information.
32.3% 2.4% 0.0% 16.7% 23.7% 24.9% 0.6% 5.9% 3.9% 5.5% 7.5% 76.6% 0% 10% 20% 30% 40% 50% 60% 70% 80%
Pedestrians Cyclists Car drivers / passengers Drivers of motorbikes User of public transport Other Single Pedestrian Accidents: not considered as traffic accidents
Single Pedestrian Accidents: considered as traffic accidents
Another way to measure accessibility is to calculate the proportion of the population living 1 kilometre or less from the nearest service facility. The following figure shows that around 90% of the population live within 1 kilometre of a restaurant or public school. Still around 60% live near a bank or their public admini-stration. But only 20 to 30% have a book store or sports facility nearby.
Figure 30: Proportion of population living at 1 km or less from the nearest service facility, 2001
Source: Dienstleistungen für die Bevölkerung: Erreichbarkeit 1998-2001, BFS 2006c Legend (from top): continued… (1) continued… (2)
food stores: large supermarkets (>2500m2) day care facilities pharmacies hospitals food stores: small supermarkets (400-2500m2
) post offices
movies dentists’ offices doctors’ offices
book stores public administrations food stores (total)
small food stores (<400m2) kiosks petrol and service stations schools (secondary level II) banks kindergarten, public and high schools
sports facilities bakeries, tea-rooms restaurants, cafés
Accessibility and distances highly depend on the area a person lives in, particularly the differences be-tween urban, suburban and rural environments. The following figure shows the indexed average dis-tances to the closest service facility according to central (orange), suburban (yellow) and rural areas (green) with the Swiss average being 100.
Chapter 2: Facts and figures: data on walking 27
Country Report Switzerland
Figure 31: Average distance to the nearest service facility according to area, 2001 (index 100 = Swiss average)
Source: Dienstleistungen für die Bevölkerung: Erreichbarkeit 1998-2001, BFS 2006c
While basic services such as food stores, schools, post offices, restaurants are within an index reach of 50 to 150 between the different spatial settings, other services are further apart, e.g. book stores, sports or day care facilities. The latter have in the centre an index of 30 and in rural areas one of around 240, which means these services are on average 8 times further away.
To conclude, the same information as above is presented here as geographical map showing that general food stores are quite well accessible throughout the country – certainly in the main living areas but also in most mountain valleys. Accessibility is lower in some rural areas. The darker the area the higher the pro-portion of the population who can reach the closest food store within 1 kilometre.
Figure 32: Average proportion of population who can reach the nearest food store within 1 kilometre, 2001
2.8
References
BFS, Bundesamt für Statistik, 2009: Behinderung hat viele Gesichter. Definitionen und Statistiken zum Thema Men-schen mit Behinderungen, Neuchâtel
BFS, Bundesamt für Statistik, 2007: Gesundheitsstatistik 2007 (information booklet 2007), Neuchâtel BFS, Bundesamt für Statistik, 2006a: Statistik des jährlichen Bevölkerungsstandes, Neuchâtel BFS, Bundesamt für Statistik, 2006b: Strassenverkehrsunfälle in der Schweiz, Neuchâtel
BFS, Bundesamt für Statistik, 2006c: Dienstleistungen für die Bevölkerung: Erreichbarkeit 1998-2001, Neuchâtel BFS, Bundesamt für Statistik, 2003: Schweizerischen Gesundheitsbefragung 2002, Neuchâtel
BFS, ARE, 2007: Mobilität in der Schweiz. Ergebnisse des Mikrozensus 2005 zum Verkehrsverhalten, Bern & Neu-châtel
BFS, ARE, 2001: Ergebnisse des Mikrozensus 2000 zum Verkehrsverhalten, Bern & Neuchâtel BFS, GVF, 1996: Verkehrsverhalten in der Schweiz 1994. Mikrozensus Verkehr, Bern
BFU, Beratungsstelle für Unfallverhütung, 2010: STATUS 2010: Statistik der Nichtberufsunfälle und des Sicherheits-niveaus in der Schweiz, Strassenverkehr, Sport, Haus und Freizeit, Bern
BFU, Beratungsstelle für Unfallverhütung, 2007: SINUS-Report 2007. Sicherheitsniveau und Unfallgeschehen im Strassenverkehr 2006
BFU, Beratungsstelle für Unfallverhütung, 2006: Unfallgeschehen in der Schweiz, bfu-Statistik 2006, Bern Hubacher Markus, Ewert Uwe, 1997: Das Unfallgeschehnen bei Senioren ab 65 Jahren. bfu-Report 32, Bern
Hüttenmoser Marco, Sauter Daniel, 2000: Wenn da nicht die Hand der Mutter wäre. Eine Analyse der Kinderunfälle der letzten 24 Jahre, Zürich
Infras, 2005: Konzept Langsamverkehrsstatistik, ASTRA (Hrsg.), Bern
Lamprecht Markus, Stamm Hanspeter, 2005: Bewegung, Sport, Gesundheit in der Schweiz. Auswertung der Schwei-zerischen Gesundheitsbefragung 2002 im Auftrag des Bundesamtes für Sport, Magglingen, Zürich
Observatorium Sport und Bewegung Schweiz, 2009: Indikator 1.1: Niveau und Entwicklung des Bewegungsverhal-tens, http://www.sportobs.ch, accessed 21 September 2010
Sauter Daniel, 2008: Mobilität von Kindern und Jugendlichen. Fakten und Trends aus den Mikrozensen zum Ver-kehrsverhalten 1994, 2000 und 2005. Im Auftrag des Bundesamtes für Strassen, Zürich/Bern
Sauter Daniel, 2005: Mobilität von Kindern und Jugendlichen. Vergleichende Auswertung der Mikrozensen zum Ver-kehrsverhalten 1994 und 2000. Im Auftrag des Bundesamtes für Sport, Zürich, Magglingen
Schad Helmut, Ohnmacht Timo, Sonderegger Roger, Sauter Daniel, 2008: Gebaute Umwelt und körperliche Aktivität. Analysen und Empfehlungen für die Schweiz; Studie im Rahmen des Forschungskonzepts „Sport und Bewegung 2004 – 2007“, Hochschule Luzern – Wirtschaft, Luzern
Schneider Heinz, Venetz Werner, Gallani Berardo Carmen, HealthEcon, 2009a: Overweight and obesity in Switzer-land. Part 1: Cost burden of adult obesity in 2007. Report Prepared for the Bundesamt für Gesundheit (BAG), Basel
Schneider Heinz, Venetz Werner, Gallani Berardo Carmen, HealthEcon, 2009b: Overweight and obesity in Switzer-land. Part 2: Overweight and obesity trends in children. Report Prepared for the Bundesamt für Gesundheit (BAG), Basel
Swiss Federal Statistical Office (SFSO), 2007: Statistical Data on Switzerland 2007 (summary booklet), Neuchâtel Zwicky Heinrich, 2003: Zur sozialen Lage von Menschen mit Behinderungen in der Schweiz. In: Schweizerische
29 Chapter 3: Publications and research
Country Report Switzerland
3.
Publications and research
3.1
Introduction
For a long time walking-related research in Switzerland was rare and isolated, mostly done by specialized associations and researchers. It focused mainly on vulnerable users (elderly people, children), on pedes-trian-friendly redesign of roads and on issues of implementation and the legal framework (speed limits, traffic calming, federal law on footpaths and hiking trails, etc.), aiming to inform the experts in the field and to promote best practices.
This situation started to change around the year 2000. More research was commissioned and the in-creasing number of publications started to reflect the growing interest in walking and pedestrians also within official circles (federal offices, research funds). The issues treated widened with recent publications focusing e.g. on strategies to promote walking, on best practices and walking-related health issues, as well as measuring walking.
Despite these positive developments research on walking remains very limited in scope and in terms of funding, particularly compared to research on transport issues in general.
The following list of publications reflects the changes mentioned above. It is structured in chronological order, i.e. according to the year of publication in three main sections:
• Published reports on pedestrian issues
This sub-chapter is divided into part A with reports directly linked to walking and part B on publica-tions “indirectly” linked to walking, e.g. dealing with public space, road safety, urbanism, traffic calm-ing, health issues. While part A tries to be comprehensive, part B is a selection of reports made ac-cording to a (subjective) estimate of relevance
• Current research projects
A list of research projects currently being under way (reference year 2010)
• Websites and magazines
These two sub-chapters contain a list of relevant websites and regular publications on walking reflect-ing two other important ways of sources for information in the field. Only websites and magazines with walking as a main issue were selected. There are, of course, many more websites and maga-zines in which pedestrians are just one of the aspects treated (see also chapter 4.9 for the relevant actors).
In the Annex at the end of the report, the publications of part A as well as the current research projects are described and summarized in detail.
3.2
Publications
List of published Swiss reports on pedestrian issues
A Reports directly linked to walking publication Year of
Building costs for the most common pedestrian and bicycle infrastructure
Baukosten der häufigsten Langsamverkehrsinfrastrukturen
Hofstetter Markus, Farner Christian (KONTEXTPLAN AG), 2010: Bundesamt für Strassen ASTRA (Hrsg.)
2010
Traffic regulation systems – Handicapped and older people at signalized intersections
Verkehrsregelungssysteme – Behinderte und ältere Menschen an Lichtsignalanlagen, Forschungsauf-trag VSS 2007/304
Ferella Falda Mauro, Brugnoli Gianni, Grahl Stefan, 2010: Bundesamt für Strassen ASTRA (Hrsg.)
2010
Slow moving traffic, Part 1: Pre-modern traffic conditions
Der Langsamverkehr, Teil 1: Die vormodernen Bedingungen des Verkehrs
Schiedt Hans-Ulrich (ViaStoria - Zentrum für Verkehrsgeschichte Universität Bern), 2009: Bundesamt für Strassen ASTRA und Via Storia (Hrsg.)
2009
Behaviour at Pedestrian Crossings
Verhalten an Zebrastreifen
Thomas Christian M., 2009: Fussverkehr Schweiz (Swiss Pedestrian Association)
2009
Pedestrian and bicycle traffic in town and in the countryside
Zur Zeit: Eile mit Weile - Fuss- und Veloverkehr in der Stadt und auf dem Land Villiger Simon, 2009: Statistik Stadt Zürich
2009
Hiking in Switzerland 2008
Wandern in der Schweiz 2008
Lamprecht Markus, Fischer Adrian, Stamm Hanspeter (Lamprecht & Stamm Sozialforschung und Bera-tung AG), 2009: Bundesamt für Strassen ASTRA (Hrsg.)
2009
The ABC’s of creating safe ways to school
Das ABC der Schulwegsicherung
Regli Pascal, Zürcher Tonja, Gladow Beatrice, 2009: Fussverkehr Schweiz
2009
Creating shopping areas, easily accessible by walking and cycling
Erschliessung von Einkaufsgeschäften für den Fuss- und Veloverkehr Bernhardsgrütter Andreas, Schweizer Thomas, Fussverkehr Schweiz Merkli Christoph, 2009: Pro Velo Schweiz
2009
Flâneur d’Or 2008 – The award of pedestrian infrastructure
Jurybericht Flâneur d’Or 2008 – Fussverkehrspreis Infrastruktur Schweizer Thomas, 2008: Fussverkehr Schweiz
2009
Mobility of children and adolescents. Facts and trends based on the evaluation of the micro-scensuses on travel behaviour 1994, 2000 and 2005
Mobilität von Kindern und Jugendlichen. Fakten und Trends aus den Mikrozensen zum Verkehrsverhal-ten 1994, 2000 und 2005
SAUTER Daniel (Urban Mobility Research), 2008: Zürich
2008
Crossings for the pedestrian and cycle traffic
Grob Daniel (GrobPlanung GmbH), Pestalozzi Christian (Pestalozzi & Stäheli), Forschungsauftrag VSS 1999/271, Bundesamt für Strassen (Hrsg.), 2008: Bern
2008
Muscle-powered mobility, Base document for Switzerland
Mit Muskelkraft unterwegs, Grundlagendokument
Martin-Diener Eva, 2008: Federal Office of Sport FOSPO, Federal Office of Public Health FOPH, Net-work HEPA Switzerland
Chapter 3: Publications and research 31
Country Report Switzerland
Marked “pedestrian safety islands” – Evaluation of the changing of the behaviour of pedestrians and drivers
Markierte Fussgängerschutzinseln – Evaluation der Veränderungen im Verhalten von Zufussgehenden und Fahrzeuglenkenden
Schweizer Thomas, Zürcher Tonja, Altherr Viktor, Steiner Rolf, Zoth Johannes, 2008: Fussverkehr Schweiz, Kt. Aargau BVU
2008
Temporary use of public areas, recommendations for authorizaton provisions
Vorübergehende Benützung des öffentlichen Grundes, Regelungsvorschläge für Boulevardcafés und Warenauslagen von Verkaufsläden
Schweizer Thomas, Fasciati Janet, 2008: Fussverkehr Schweiz
2008
Baden: Impact analysis about the footbridge over the Limmat river and the elevator on its end
Baden: Wirkungsanalyse Limmatsteg und Promenadenlift Meyer Katharina, Regli Pascal, 2008: Fussverkehr Schweiz
2008
Accidents in “encounter zones” (encounter zones: areas where the speed limit is 20 km/h and
pe-destrians have precedence)
Unfallgeschehen in Begegnungszonen
Schweizer Thomas, Fasciati Janet, 2008: Fussverkehr Schweiz
2008
Pedestrian navigation in public spaces: needs assessment and sketch of solutions
La navigation pédestre dans l’espace public: évaluation des besoins et esquisses de solutions GILLIERON Pierre-Yves, CHAZAL Véronique, DELAVY Thomas (TOPO-EPFL), FLAMM Michael (LA-SUR-EPFL), VON DER MUEHLL Dominique, RUZICKA-ROSSIER Monique (Chôros-EPFL)
2008
Enhancement of GIS through a process of formalizing the concept of pedestrian accessibility
Valorisation des SIG dans une démarche de formalisation du concept d’accessibilité piétonne Lenoir Vincent, Master degree study, 2007: EPFL
2007
Conflict analysis in mixed traffic
Konfliktanalyse beim Mischverkehr
Dörnenburg Klaus (Sigmaplan), Forschungsauftrag 2001/542 SVI, 2007: Bundesamt für Strassen (Hrsg.), Bern
2007
Pedestrian and bicycle traffic on shared spaces
Fuss- und Veloverkehr auf gemeinsamen Flächen
Butz Marlène, Merkli Christoph, Schweizer Thomas, Thomas Christian, 2007: Fussverkehr Schweiz und Pro Velo Schweiz
2007
Burgdorf: Model city for walking and cycling. Final report 1996-2006
FuVeMo Fussgänger- und Velomodellstadt Burgdorf. Abschlussbericht 1996-2006 Renard Aline, Eggenschwiler Heidi, 2007: Stadt Burgdorf
2007
General evaluation of the model city for walking and cycling, Burgdorf
Gesamtevaluation Fussgänger- und Velomodellstadt Burgdorf
Frick Roman (INFRAS), Maibach Markus (INFRAS), Trageser Judith (INFRAS), Rindsfüser Guido (Emch+Berger), 2007: Bern
2007
Reflexions on a marketing approach for pedestrian and bicycle traffic. Methods to analyse, find strategies and create packages for promotion measures
Überlegungen zu einem Marketingansatz im Fuss- und Veloverkehr. Methodik zur Analyse, Strategie-findung und Paketbildung von Fördermassnahmen
Blumenstein Andreas, Wälti Martin (Büro für Mobilität AG), Hasler, Paul (büro für utopien), KISSLING, P. (LP Ingenieure AG), MASCIADRI P. (Masciadri communication & design AG), 2007: Bern
2007
Pedestrian traffic, accident patterns, risk factors and prevention. Safety documentation
Fussverkehr, Unfallgeschehen, Risikofaktoren und Prävention. Sicherheitsdossier.
Walter Esther, Cavegn Mario, Scaramuzza Gianantonio et al. 2007: Beratungsstelle für Unfallverhütung