Final report of the Early Child
Development Mapping Project
(ECMap)
How are our young children doing?
August 2014
abbreviations
ECMap - Early Child Development Mapping ProjectEDI - Early Development Instrument DA - developing appropriately
DA5 - developing appropriately in all 5 areas of development ED - experiencing difficulty
EGD - experiencing great difficulty
EGD1+ - experiencing great difficulty in one or more areas of development EGD2+ - experiencing great difficulty in two or more areas of development SDL - severe delays involving language
M/MD - mild/moderate disabilities or delays SD - severe disabilities
SES - socio-economic status SEI - socio-economic index
Introduction
Community
boundaries
Early Development Instrument (EDI) results
The EDI as a measurement tool
Five areas of development
Three categories
Reporting results in Alberta
Collecting and analyzing the EDI in Alberta
EDI baseline results Summary of EDI baseline results for Alberta
Provincial results
Demographic results
Analysis by sex
Analysis by age
Analysis by age and sex
Analysis for ESL/non-ESL
Summary of EDI findings for children with special needs
Summary of EDI baseline results for communities and regions
Geographic trends
Community results
Environmental contexts of early development
Socio-economic factors Community resources
Community
engagement
Building community capacity
Successes
Sharing results
Mobilizing results
Raising awareness about early development and community resources Linking and leveraging
Providing input into public policy
Challenges
Observations
and
interpretations
Policy
recommendations
Table of contents
2
3
5
5 5 6 6 7 8 8 8 10 11 12 1314
15
16
16 1620
20 2426
26 28 28 28 28 29 29 2930
33
In 2009, the Government of Alberta launched the Early Child Development (ECD) Mapping Initiative as part of a five-year plan to gather information on the development of kindergarten-aged children in Alberta. The purpose of the initiative, led by the Ministry of Education, was to study children’s developmental progress by the end of the formative first five years and to learn more about the environmental factors that may be influencing their development. As a large body of scientific research shows, children’s early experiences are “biologically embedded” in their rapidly developing brain and nervous systems and have lifelong consequences on learning, health, productivity and well-being.1
To ensure that young children have the supports and opportunities they need to thrive and do well, it helps to know how they are doing and how the environments in which they are being raised are affecting their development both positively or negatively. Having this kind of research data provides evidence for sound policy- and decision-making. A number of pilot studies of early development have been conducted in Alberta in the past, but these were limited in size and scope. The ECD Mapping Initiative was the first population-based study of preschool children to encompass the whole province. The Early Development Instrument (EDI), created by the Offord Centre for Child Studies at McMaster University in Hamilton, Ontario and used by other provinces in Canada, was selected as the tool to measure early development. The EDI was collected by school authorities under the supervision of Alberta Education. The analysis, other data collection and community engagement was contracted out to the Community-University Partnership for the Study of Children, Youth and Families (CUP), based at the University of Alberta. CUP built a team and in the summer of 2009, the Early Child Development Mapping Project (ECMap) began its research and
community-engagement work. Community-based research, which fully engages community members, was a central aspect of the study. As with most community-based research, the study used mixed methods to gather and analyze both quantitative and qualitative data. Over the five-year period 2009 to 2014, ECMap completed the following functions:
• analyzed EDI data on more than 70,000 kindergarten-aged children at the provincial and community level,
• calculated EDI baseline results for Alberta, • mobilized 100 early childhood development (ECD)
community coalitions in Alberta,
• analyzed socio-economic status (SES) data for communities and Alberta as a whole,
• assisted coalitions in collecting information on their community resources,
• created provincial and community maps displaying EDI results and information on socio-economic status and community resources,
• studied the impact of socio-economic factors and community resources on early development, and • built the capacity of communities to tap into local
knowledge and expertise to share, interpret and respond to the data.
This report summarizes the key findings and
recommendations that have emerged from the ECMap Project. It draws on the detailed analysis described in three reports, which will all be available in the fall of 2014:
• How are our young children doing? Community profiles of early childhood development in Alberta, • How are our young children doing? A provincial
analysis of early childhood development in Alberta,
and
• How are our young children doing? Children with special needs in Alberta.
Community boundaries
Research information had to be broken down and reported by geographic areas to provide insights into how children are doing in different parts of the province and how the environments in which they are being raised are affecting their development. Data was analyzed and reported at the community level in accordance with the study’s community-based focus. Community boundaries had to be established first, however. This was a particular challenge in Alberta where there are no common administrative boundaries that encompass the entire province. School districts, health zones, federal and provincial constituencies, municipalities and regional bodies overseeing the operation of programs and services at the local level (Family and Community Support Services, for example) all have their own sets of administrative boundaries.
To create boundaries that would be meaningful to the people actually living and working in communities, community members and groups were asked for their input into determining the boundaries for their community’s geographic area.
Some of the following questions were considered during this process:
• What are the natural geographic dividers that separate your community from other ones nearby (e.g. highways, rivers, county lines)?
• Where do people go to access programs, services and supports?
• From how far away do people come to access the resources in your community? • How do others define your community?
Through this process, 100 communities, or early childhood development (ECD) communities as they are known, were identified and mapped, covering the entire land area of Alberta. Many communities — 63 out of 100 — were also subdivided into subcommunities by the community members to reflect the diversity of their populations. Reporting results at the subcommunity level made it possible to capture the variations that exist within communities. A total of 300 subcommunities were identified across Alberta. (Please go to http://www. ecmap.ca for an interactive version of the community map.)
Edmonton City Centre Edmonton Mill Woods Edmonton North Central Edmonton Northeast Edmonton Southeast Edmonton Southwest Edmonton West Edmonton Calgary
Early Development
Instrument (EDI) results
The EDI, which was developed in Canada and finalized in 2000, has become a standard population-based tool for measuring and monitoring early childhood development across Canada. The EDI is administered at the kindergarten level, the first opportunity to collect data on large numbers of young children in Canada efficiently and cost effectively. The EDI provides an overall sense of children’s development before they start school and enables provinces to compare their results with a Canadian norm that is based on a cohort of 175,000 children (from Ontario, British Columbia, Manitoba, Saskatchewan, Quebec, New Brunswick and Alberta).The EDI is a questionnaire that is completed by kindergarten teachers based on their observations of children’s behaviour after children have spent several months in the classroom. Teachers receive training in using the questionnaire beforehand, and the tool itself has been tested for validity and reliability. A questionnaire is filled out for each child, but the information is aggregated and reported for groups of children. The EDI is not a diagnostic assessment tool.
The EDI as a measurement tool
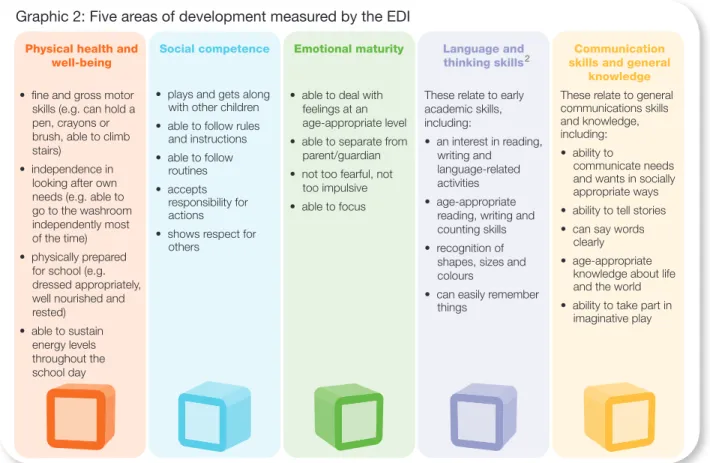
Physical health and well-being
• fine and gross motor skills (e.g. can hold a pen, crayons or brush, able to climb stairs)
• independence in looking after own needs (e.g. able to go to the washroom independently most of the time) • physically prepared for school (e.g. dressed appropriately, well nourished and rested) • able to sustain energy levels throughout the school day Social competence
• plays and gets along with other children • able to follow rules and instructions • able to follow routines • accepts responsibility for actions
• shows respect for others
Emotional maturity
• able to deal with feelings at an age-appropriate level • able to separate from parent/guardian • not too fearful, not too impulsive • able to focus
Language and thinking skills
These relate to early academic skills, including: • an interest in reading, writing and language-related activities • age-appropriate reading, writing and counting skills • recognition of shapes, sizes and colours
• can easily remember things
Communication skills and general
knowledge
These relate to general communications skills and knowledge, including: • ability to
communicate needs and wants in socially appropriate ways • ability to tell stories • can say words clearly
• age-appropriate knowledge about life and the world • ability to take part in imaginative play
Five areas of development
Graphic 2: Five areas of development measured by the EDI
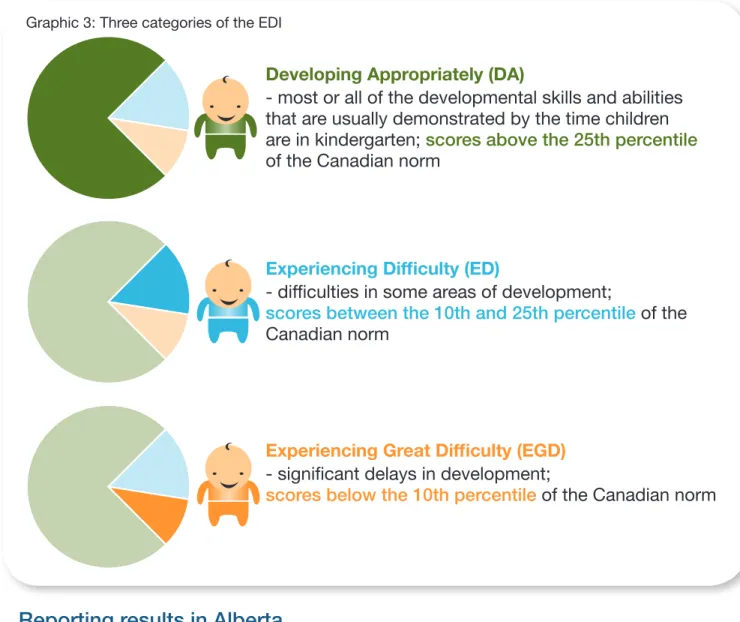
Once questionnaires are scored, they are compared to the Canadian norm and grouped into one of the following three categories:3
Three Categories
Developing Appropriately (DA)
- most or all of the developmental skills and abilities
that are usually demonstrated by the time children
are in kindergarten;
scores above the 25th percentile
of the Canadian norm
Experiencing Great Difficulty (EGD)
Experiencing Difficulty (ED)
- difficulties in some areas of development;
scores between the 10th and 25th percentile
of the
Canadian norm
- significant delays in development;
scores below the 10th percentile
of the Canadian norm
Three main statistics are used to report EDI results in Alberta:
• developing appropriately (DA5) in all five areas of development,
• experiencing great difficulty in one or more areas of development (EGD1+), and • experiencing great difficulty in two or more areas of development (EGD2+). Alberta results for developing appropriately cannot be compared with the Canadian norm, however, because a Canadian norm has not been established for this category.
Reporting results in Alberta
School authorities were invited by Alberta Education to collect EDI data twice between 2009 and 2013, in whichever years they chose. A small number also chose to collect a third round of data. Active parental consent was required for children’s information to be included in the study. The parental consent rate for EDI collection between 2010 and 2013 in Alberta was 86 per cent.4
EDI questionnaires were sent to the Offord Centre, which prepared result reports for each school authority. ECMap analyzed and reported EDI results at the provincial, community and subcommunity levels. Children’s names were removed from the questionnaires to protect the children’s privacy. Children’s postal codes were used to sort questionnaires and analyze data based on the communities where children live (not where they went to school).
Collecting and analyzing
the EDI in Alberta
Data All EDI
Collection questionnaires
Waves received:
* Reduced to 86,564; 1,160 questionnaires were unusable due to errors.
2009 9,614 2010 21,976 2011 20,881 2012 14,492 2013 20,734 Total: 2009-2013 87,724*
Graphic 4: Five waves of EDI data collection in Alberta
A total of 87,724 questionnaires were completed in five waves of data collection from 2009 to 2013.5
Out of the total questionnaires completed, 1,160 were set aside due to unresolvable errors.The remaining 86,564 were then checked to see if they met the criteria for baseline analysis. Questionnaires did not meet the criteria if:
• The child was diagnosed with severe disabilities. EDI results for children with severe disabilities were analyzed separately. (2,154 questionnaires).
• There was no active parental consent (10,353 questionnaires).
• The child was in class for less than one month, which meant that the teacher did not have sufficient time to get to know the child.
• The child was under four years of age or over seven, and therefore outside the age range of the study.
• Information was missing or incomplete; i.e. a large number of questions were unanswered for one or more areas of development.
Out of all the questionnaires collected, 70,206 — or approximately 80 per cent — met the criteria for analysis. The same criteria were used to determine the usability of questionnaires as those used by the Offord Centre, except for active parental consent, which was required in Alberta.6 Using the same standards
ensured that Alberta results were comparable to the Canadian norm.
*Reduced to 86,564; 1,160 questionnaires were unusable due to errors.
EDI data collected between 2009 and 2013 was combined and analyzed to establish an EDI baseline for Alberta and its ECD communities and subcommunities. The merged data yields much more comprehensive and reliable results than a single wave of data collection and avoids the pitfalls of short-term anomalies, which can distort findings. The EDI baseline, which is based on a cohort of 70,206 children, lays a solid foundation for comparing EDI results in the future and monitoring young children’s development in the province over time.
The Canadian norm does not include children with diagnosed severe disabilities. Children with mild and moderate disabilities and severe delays involving language are included, however. The Alberta EDI baseline follows the same approach in its analysis of children with disabilities as that established in the Canadian norm. Results for Alberta children with diagnosed severe disabilities are analyzed separately and reported in How are our young children doing? Children with special needs in Alberta. A summary of the report findings are presented further in this document. EDI baseline results also do not include children who attend kindergarten in First Nations schools.
EDI baseline results
EDI results were not compared by year in Alberta, because the data was collected
in different years by different school authorities.
Summary of EDI baseline
results for Alberta
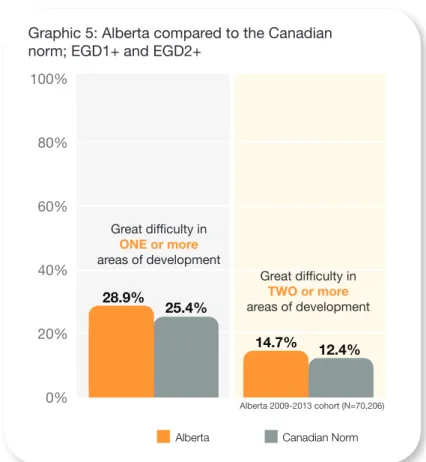
Nearly 29 per cent of kindergarten-aged children in Alberta are experiencing great difficulty in one or more of the five areas of development, a higher proportion than the Canadian norm of 25.4 per cent. In two or more areas of development, 14.7 per cent of Alberta’s kindergarten children are experiencing great difficulty, which is higher than the Canadian norm of 12.4 per cent.
Provincial results
28.9% 25.4% 14.7% 12.4% 100% 80% 60% 40% 20% 0%Alberta Canadian Norm
Great difficulty in ONE or more areas of development Great difficulty in TWO or more areas of development Alberta 2009-2013 cohort (N=70,206) Graphic 5: Alberta compared to the Canadian norm; EGD1+ and EGD2+
What percentage of children are doing well? Graphic 6 shows the number and percentage of children developing appropriately by the number of areas of development from five to none. The most striking result is that 46.4 per cent — or less than half — of kindergarten children in Alberta are developing appropriately in all five areas of development.
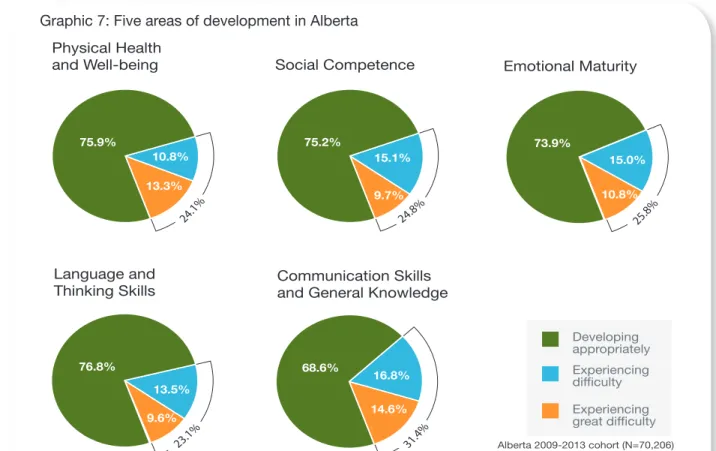
When the results are examined for each area of development, the data shows a significant percentage of young children in Alberta struggling in each of the five
Developing Appropriately
(DA) in: Number Per cent
Alberta 2009-2013 cohort (N=70,206)
Four areas 13,313 19.0% Three areas 8,955 12.8% Two areas 6,117 8.7% One area 4,788 6.8% Not DA in any area 4,457 6.3%
All five areas 32,576 46.4%
Graphic 6: Developing appropriately in all areas in Alberta
areas. The area of development that appears to be the biggest challenge is communication skills and general knowledge. More than 31 per cent of kindergarten-aged children are experiencing difficulty or great difficulty in this particular area of development.
When considering the different areas of development, it is important to keep in mind that they are interdependent and each contributes to overall development.
Developing appropriately Experiencing Experiencing
Communication Skills and General Knowledge
31.4% 68.6% 14.6% 16.8% Physical Health and Well-being 24.1% 75.9% 13.3% 10.8% Social Competence 24.8% 75.2% 15.1% 9.7% Emotional Maturity 25.8% 73.9% 10.8% 15.0% Language and Thinking Skills 23.1% 76.8% 9.6% 13.5%
Please note: Percentages may not always add up to 100% due to rounding or missing data
Alberta 2009-2013 cohort (N=70,206)
Graphic 7: Five areas of development in Alberta
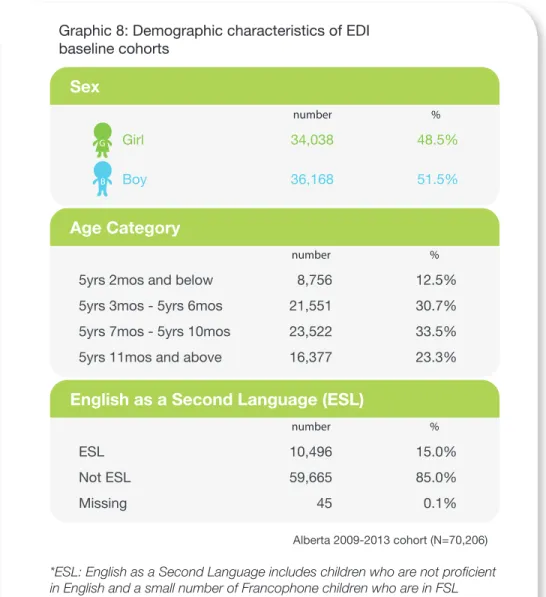
EDI data for Alberta has been analyzed by sex, age and language proficiency in English to provide additional insights into how particular groups of children are doing. Research studies have found that these demographic factors are linked to early childhood development and EDI results. This appears to be the trend in Alberta as well.
Demographic results
Sex Sex G B Girl 34,038 48.5% Boy 36,168 51.5% number % Age Category5yrs 2mos and below 8,756 12.5%
5yrs 3mos - 5yrs 6mos 21,551 30.7%
5yrs 7mos - 5yrs 10mos 23,522 33.5%
5yrs 11mos and above 16,377 23.3%
number %
English as a Second Language (ESL)
ESL 10,496 15.0%
Not ESL 59,665 85.0%
Missing 45 0.1%
number %
Alberta 2009-2013 cohort (N=70,206) *ESL: English as a Second Language includes children who are not proficient in English and a small number of Francophone children who are in FSL programs in order to build proficiency in French.
Graphic 8: Demographic characteristics of EDI baseline cohorts
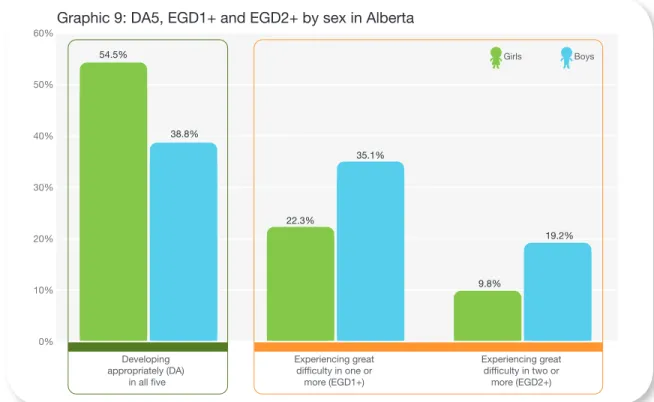
More girls tend to score high on the EDI than boys. This holds true for all areas of development, although the difference between boys and girls is smaller in the area of language and thinking skills. This is an unexpected finding given the number of studies that have shown a large difference between boys and girls in language development.
Analysis by sex
0% 2% 4% 6% 8% 10% 12% 14% 16% 18% 20% Physical Healthand Well-being CompetenceSocial EmotionalMaturity Language andThinking Skills and General KnowledgeCommunications Skills
10.3% 16.1% 6.0% 13.1% 5.7% 15.7% 7.4% 11.6% 11.3% 17.7% Girls Boys Alberta 2009-2013 cohort (N=70,206) Graphic 10: EGD in each of five areas of development by sex in Alberta
Girls 0% 10% 20% 30% 40% 50% 60% Boys 38.8% 54.5% 22.3% 35.1% 9.8% 19.2% G Developing appropriately (DA) in all five Experiencing great difficulty in one or more (EGD1+) Experiencing great difficulty in two or more (EGD2+) Graphic 9: DA5, EGD1+ and EGD2+ by sex in Alberta
Although the results show that more girls do well on the EDI than boys, not all boys are struggling in comparison to girls. As Graphic 9 shows, nearly 40 per cent of boys are doing well in all five areas of development.
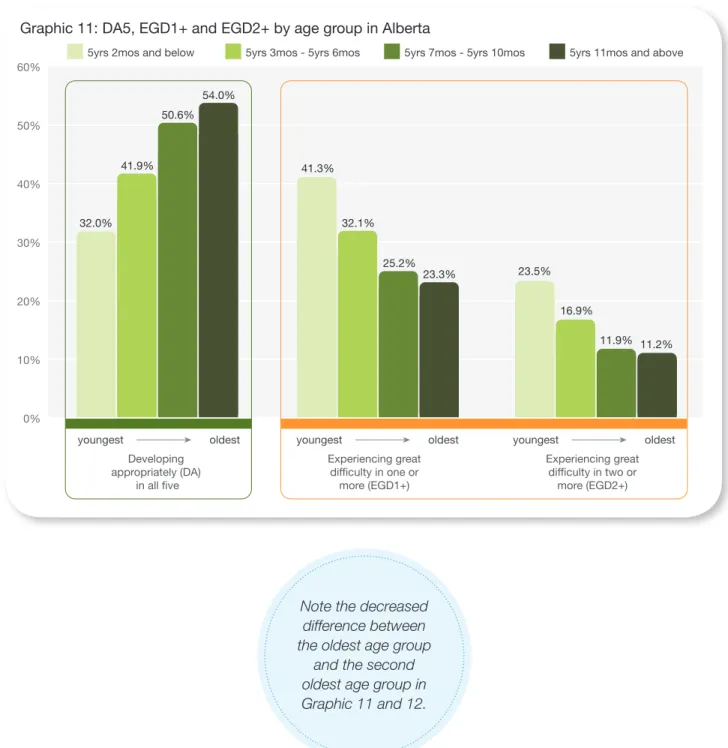
EDI data was collected on kindergarten children as young as four years of age and a few as old as seven. Children were divided into four age groups and EDI results were reported for each group. A larger percentage of children in the youngest group scored poorly. The percentage of children scoring poorly decreased as age increased, except for the oldest age group. The decrease did not continue in the group of children who were older than 5 years, 11 months. This remained the case even when the data for the group of children repeating kindergarten was removed from the analysis.7
Analysis by age
0% 10% 20% 30% 40% 50% 60%5yrs 2mos and below 5yrs 3mos - 5yrs 6mos 5yrs 7mos - 5yrs 10mos 5yrs 11mos and above
41.3% 32.1% 25.2% 23.3% 23.5% 16.9% 11.9% 11.2% youngest oldest youngest oldest youngest oldest 54.0% 50.6% 41.9% 32.0% Developing appropriately (DA) in all five Experiencing great difficulty in one or more (EGD1+) Experiencing great difficulty in two or more (EGD2+)
Graphic 11: DA5, EGD1+ and EGD2+ by age group in Alberta
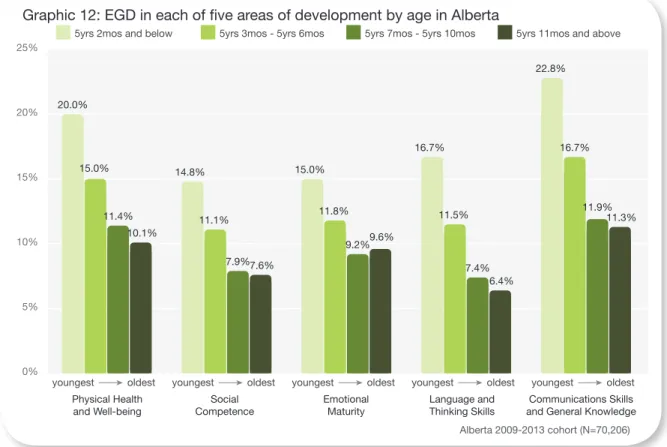
Note the decreased difference between the oldest age group
and the second oldest age group in Graphic 11 and 12.
5yrs 2mos and below 5yrs 3mos - 5yrs 6mos 5yrs 7mos - 5yrs 10mos 5yrs 11mos and above youngest oldest 0% 5% 10% 15% 20% 25%
youngest oldest youngest oldest youngest oldest youngest oldest
10.1% 7.6% 9.6% 6.4% 11.3% 11.4% 7.9% 9.2% 7.4% 11.9% 15.0% 11.1% 11.8% 11.5% 16.7% 20.0% 14.8% 15.0% 16.7% 22.8% Physical Health
and Well-being CompetenceSocial EmotionalMaturity Language andThinking Skills and General KnowledgeCommunications Skills
Alberta 2009-2013 cohort (N=70,206) Graphic 12: EGD in each of five areas of development by age in Alberta
When EDI results were analyzed by age and sex, the gap between girls’ and boys’ scores appeared to decrease as age increased, except for the oldest age group.
Analysis by age and sex
0% 10% 20% 30% 40% 50% 60%
5yrs 2mos and below 5yrs 3mos - 5yrs 6mos 5yrs 7mos - 5yrs 10mos 5yrs 11mos and above
youngest oldest Girls Boys 32.9% 50.7% 25.0% 39.1% 19.2% 31.0% 16.5% 28.6% Alberta 2009-2013 cohort (N=70,206)
A higher proportion of children in the ESL category score poorly than those who are fluent in English. 0% 10% 20% 30% 40% 50% 60% 29.3% 49.4% 46.1% 25.9% 23.4% 13.2% ESL Not ESL Developing appropriately (DA) in all five Experiencing great difficulty in one or more (EGD1+) Experiencing great difficulty in two or more (EGD2+) Graphic 14: DA5, EGD1+ and EGD2+ by ESL in Alberta
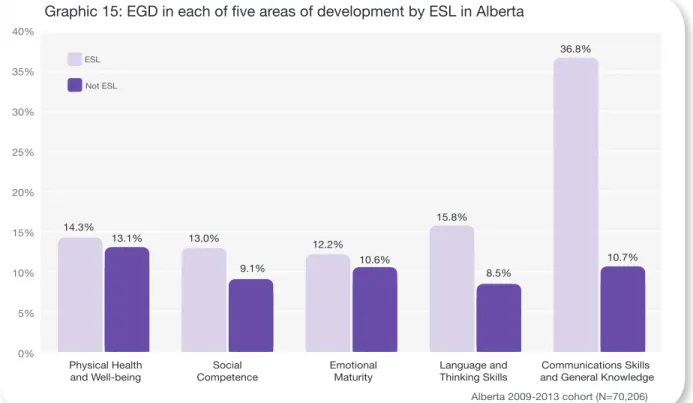
0% 5% 10% 15% 20% 25% 30% 35% 40% Physical Health and Well-being Social Competence Emotional Maturity Language and Thinking Skills Communications Skills and General Knowledge 14.3% 13.1% 13.0% 12.2% 15.8% 10.6% 36.8% 10.7% Alberta 2009-2013 cohort (N=70,206) ESL Not ESL 9.1% 8.5%
Graphic 15: EGD in each of five areas of development by ESL in Alberta
As can be expected, the two areas of development in which non-English speaking children struggle the most are: communications skills and general knowledge and language and thinking skills.
For the purposes of the study, children with special needs were grouped into three categories:
• severe disabilities,
• severe delay involving language, and • mild/moderate disability or delay Results were reported differently depending on the category, following the same
approach as the one used in establishing the Canadian norm. Questionnaires on
Summary of EDI findings for
childen with special needs
Graphic 16: Children with disabilities included in Alberta EDI baseline
This shows the proportion of children in the two categories that were included in Alberta baseline results out of the total cohort of 70,206 children.
Category Number Per cent Children with severe delays
involving language (SDL) 3,164 4.5% Children with mild/moderate
disabilities or delays (M/MD) 11,179 15.9%
children with severe disabilities (2,154 questionnaires) were not included in Alberta EDI baseline results. Questionnaires on children with severe delay involving language and mild/moderate disability or delay were included, however.
Results for children with severe disabilities were analyzed and reported separately (How are our young children doing? Children with special needs in Alberta). More detailed results for children with severe delay involving language and mild/moderate disability or delay were also included in this report, which will be released in the fall.
EDI results for Alberta indicated that 28.9 per cent of kindergarten children are experiencing great difficulty in one or more of areas of development and 14.7 are experiencing great difficulty in two or more of areas. This does not include children with severe disabilities, but it does include children with SDL and M/MD designations. When children in the latter two categories were removed from analysis, the results still showed that the remaining 21.7 per cent of kindergarten-aged children are experiencing great difficulty in one or more areas and 9.1 per cent are experiencing great difficulty in two or more areas of development. This would appear to indicate that the current processes used for identifying children with special needs are not effective in the majority of cases in Alberta.
Category Range across Alberta communities per cent Children with severe
disabilities (SD) 0 to 5.8% 2.5%
Children with severe delays
involving language (SDL) 0 to 21.5% 4.5% Children with mild/moderate
disabilities or delays (M/MD) 0 to 44% 15.9%
Graphic 17: Range of children with disabilities by communities
The percentage of children with special needs in three categories was examined in every community. The percentages vary widely across the province.
When EDI results were broken down for children with severe delays involving language (SDL), the SDL group not only scored
poorly in language and thinking skills and communication skills and general knowledge, the two areas most closely connected with delayed language, but in all five areas of development. The close interrelation between all the different areas of development is underscored by these results.
Summary of EDI baseline results for
communities and regions
EDI results were reported at the community level providing the following criteria were met to ensure sufficient representativeness:
• a minimum of 30 usable EDI questionnaires were available, and
• the number of usable questionnaires represented at least 74 per cent of the children who were enrolled in kindergarten and resided in the area.8
Ninety-seven out of 100 ECD communities met these criteria. Results could not be reported for Drumheller and Area, Wood Buffalo North and Forty Mile County because of an insufficient number of usable EDI questionnaires. EDI results were also reported for the subcommunities that met the above criteria. Full details on community and subcommunity results can be found in the report How are our young children doing? Community profiles of early childhood development in Alberta (https://www.ecmap.ca/Findings-Maps/ Community-Results/complete2014/Pages/default.aspx).
Every community has children experiencing difficulties. A large majority of communities is doing less well than the Canadian norm. Sixty-six had a greater percentage of children experiencing great difficulty in one or more areas of development as compared to the Canadian norm, while 62 per cent had a greater percentage of children experiencing great difficulty in two or more areas when compared to the Canadian norm.
A comparison of local EDI results indicated great differences among communities and subcommunities. The percentage of children experiencing great difficulty in one or more areas of development ranged from a high of 53 per cent in one community to a low of 12 per cent in another community, as compared to the Canadian norm of 25.4 per cent.
The full list of community results for EGD1+ and EGD2+ can be seen in Graphic 18 with a line showing the Canadian norms.
Community results
Statistics Canada data shows that 83 per cent of Albertans live in urban centres. Out of the 70,206 EDIs included in the Alberta analysis, 89 per cent had urban postal codes. Young children make up a much smaller proportion of the rural population than of the urban population.
Although EDI results varied a great deal among communities, no differences were found between rural and urban areas, densely populated and more sparsely populated areas or northern, central and southern regions. Type of geography did not appear to be a factor in EDI outcomes.
Edmonton West (2976) Edmonton Southwest (2942) Edmonton Southeast (910) Edmonton Northeast (1964) Edmonton North Central (2757) Edmonton Mill Woods (2907) Edmonton City Centre (727) East Red Deer County (95) East Grande Prairie County (310) Cypress County (249) Crowsnest Pass and Area (88) Cochrane and Area (568) Clearwater County (405) Chestermere - Southeast Rocky View (595) Central Peace (115) Cardston County - Warner County North (482) Camrose and Area (608) Calgary West (1247) Calgary Southwest (2458) Calgary South Central (1569) Calgary Northwest (1493) Calgary North of McKnight (2538) Calgary North Central (2830) Calgary East (1661) Calgary Downtown (1258) Calgary Deep South (3088) Calgary Bowness Montgomery (179) Brooks - Newell County (556) Brazeau County (404) Bow Valley (386) Big Lakes - Smoky River (384) Beaumont (405) Barrhead - Fort Assiniboine (193) Athabasca and Area (331)
16.9% 10.4% 14.6% 22.4% 16.8% 19.1% 16.8% 10.1% 11.4% 26.3% 11.9% 20.4% 10.0% 13.0% 9.5% 7.5% 12.3% 11.0% 18.3% 11.8% 12.3% 18.1% 15.9% 11.2% 10.3% 7.4% 24.9% 17.4% 17.3% 22.7% 13.4% 11.6% 18.3% 29.0% 23.3% 23.2% 37.8% 25.4% 33.7% 32.7% 33.5% 21.8% 23.1% 45.8% 24.5% 39.7% 22.5% 26.6% 20.3% 16.8% 26.0% 23.7% 33.9% 24.7% 28.1% 30.5% 28.4% 31.7% 26.5% 26.3% 42.5% 34.3% 33.9% 41.2% 25.7% 24.1% 32.9% 16.9% 10.4% 14.6% 22.4% 16.8% 19.1% 16.8% 10.1% 11.4% 26.3% 11.9% 20.4% 10.0% 13.0% 9.5% 7.5% 12.3% 11.0% 18.3% 11.8% 12.3% 18.1% 15.9% 11.2% 10.3% 7.4% 24.9% 17.4% 17.3% 22.7% 13.4% 11.6% 18.3% 29.0% 23.3% 23.2% 37.8% 25.4% 33.7% 32.7% 33.5% 21.8% 23.1% 45.8% 24.5% 39.7% 22.5% 26.6% 20.3% 16.8% 26.0% 23.7% 33.9% 24.7% 28.1% 30.5% 28.4% 31.7% 26.5% 26.3% 42.5% 34.3% 33.9% 41.2% 25.7% 24.1% 32.9% Canadian Norm
EGD2+ Canadian NormEGD1+
8.0% 8.0%
EGD1+ EGD2+ Graphic 18: EGD1+, EGD2+ by community
Ponoka and Area (256) Pincher Creek and Area (119) Northwest Peace (390) North Rocky View (1397) Mountain View County (649) Medicine Hat (1192) Manning and District (88) Mackenzie District (486) MD of Provost (105) MD of Foothills (1387) MD Taber - Warner County South (500) Lloydminster and Area (138) Lethbridge County (547) Lethbridge (1785) Leduc County (1134) Lamont County (164) Lakeland Region (897) Lacombe County (744) Lac Ste. Anne and Area (261) Lac La Biche (297) Kneehill Area (232) Innisfail (206) Hinton - Jasper (317) Hanna and Area (84) Grande Prairie (1481) Grande Cache (127) Fort Saskatchewan (390) Fort McMurray (1302) Fort Macleod and Area (68) Flagstaff - Beaver County (189) Fairview - Clear Hills (183) Elk Point and Area (92) Edson (324) 14.2% 6.5% 20.2% 10.6% 14.7% 19.7% 15.4% 16.5% 18.1% 14.3% 11.7% 18.4% 6.5% 26.9% 10.3% 14.9% 18.7% 9.8% 13.8% 15.3% 9.3% 2.2% 12.0% 11.5% 8.6% 16.7% 14.8% 15.1% 13.4% 14.8% 20.0% 13.4% 22.3% 17.4% 38.8% 30.2% 26.5% 37.9% 30.8% 33.1% 31.5% 20.2% 29.3% 31.6% 16.4% 44.4% 25.3% 28.4% 32.4% 23.2% 29.9% 29.5% 20.5% 11.6% 27.0% 23.6% 22.9% 34.0% 30.7% 29.1% 27.6% 31.3% 37.9% 27.7% 39.8% 14.2% 6.5% 20.2% 10.6% 14.7% 19.7% 15.4% 16.5% 18.1% 14.3% 11.7% 18.4% 6.5% 26.9% 10.3% 14.9% 18.7% 9.8% 13.8% 15.3% 9.3% 2.2% 12.0% 11.5% 8.6% 16.7% 14.8% 15.1% 13.4% 14.8% 20.0% 13.4% 22.3% 17.4% 38.8% 30.2% 26.5% 37.9% 30.8% 33.1% 31.5% 20.2% 29.3% 31.6% 16.4% 44.4% 25.3% 28.4% 32.4% 23.2% 29.9% 29.5% 20.5% 11.6% 27.0% 23.6% 22.9% 34.0% 30.7% 29.1% 27.6% 31.3% 37.9% 27.7% 39.8% Canadian Norm EGD2+ Canadian Norm EGD1+
0% 10% 20% 30% 40% 50% 60% Wood Buffalo South (51)
Whitecourt - Swan Hills - Fox Creek (403) Wheatland County (421) Wetaskiwin and Area (646) Westlock - Thorhild County (294) West Red Deer County (161) West Grande Prairie County (256) Wainwright and Area (264) Wabasca (223) Vulcan County (109) Vermilion and Area (166) Vegreville and District (139) Valleyview and Area (117) Two Hills County (146) Sylvan Lake and Area (318) Sturgeon County (830) Strathcona - Sherwood Park (1447) Strathcona - Rural (527) Stony Plain - Wildwood (754) Stettler County (248) St. Paul and Area (268) St. Albert (1258) Spruce Grove (890) Special Areas 3 and 2 East - MD of Acadia (48) Special Area 4 - Paintearth County (126) Smoky Lake and Area (87) Slave Lake (150) Rimbey and Area (122) Red Deer and Area (1871)
13.3% 15.6% 17.3% 18.4% 20.6% 6.3% 11.6% 7.5% 16.0% 16.9% 14.5% 10.6% 9.3% 10.7% 10.4% 5.5% 16.2% 7.2% 12.7% 15.6% 27.8% 17.0% 22.3% 14.9% 8.8% 16.9% 14.0% 17.9% 27.5% 24.1% 24.6% 33.3% 33.3% 31.7% 22.9% 25.1% 17.8% 29.5% 31.0% 28.6% 21.4% 18.4% 21.3% 28.9% 51.4% 34.2% 22.3% 22.3% 27.5% 53.8% 30.3% 36.3% 29.2% 22.4% 32.2% 24.9% 34.0% 51.0% 13.3% 15.6% 17.3% 18.4% 20.6% 6.3% 11.6% 7.5% 16.0% 16.9% 14.5% 10.6% 9.3% 10.7% 10.4% 5.5% 16.2% 7.2% 12.7% 15.6% 27.8% 17.0% 22.3% 14.9% 8.8% 16.9% 14.0% 17.9% 27.5% 24.1% 24.6% 33.3% 33.3% 31.7% 22.9% 25.1% 17.8% 29.5% 31.0% 28.6% 21.4% 18.4% 21.3% 28.9% 51.4% 34.2% 22.3% 22.3% 27.5% 53.8% 30.3% 36.3% 29.2% 22.4% 32.2% 24.9% 34.0% 51.0% Canadian Norm EGD2+ Canadian Norm EGD1+ Porcupine Hills - Willow Creek (140)
11.4% 20.7%
11.4% 20.7%
Environmental contexts
of early development
Socio-economic factors
Higher or more favourable socio-economic status (SES) is generally linked to more positive early childhood development and long-term life outcomes. Socio-economic status is often associated with income levels, but it is also made up of other factors, including social, cultural and economic conditions. A socio-economic index (SEI) based on 26 variables was created to measure socio-economic status for this study.9
The variables were drawn from data in the Statistics Canada 2006 national household survey and included such things as employment, family size, income disparity and unpaid child care. Data from the 2011 voluntary national household survey could not be used because it did not contain enough information on the 26 variables and underrepresented some geographic areas and certain populations, including the poor, wealthy, immigrants and First Nations people.
Every community’s socio-economic status was graded using the SEI. The results indicated that Alberta communities vary in their SEI scores. Out of a possible score of 100, the average SEI score is 39.9 and the range is from 23.6 to 47.7. When looking at SEI scores, it’s important to keep in mind that the scores do not capture 100 per cent of the socio-economic status, which is complex and difficult to measure.
The socio-economic characteristics of communities were found to be related to EDI results. The correlation between the SEI and the EDI (using the percentage experiencing great difficulty in one or more areas) was calculated to be -0.59 (relatively high). Low socio-economic levels were associated with poor early development outcomes. Where positive socio-economic levels were present, the proportion of children doing well was greater. This social gradient mirrors what has been found in other studies.
The scatter plot in Graphic 19 displays the social gradient using Alberta data. Although most communities are relatively close to the ‘best fit line’, there are several communities that do not conform to the general trend. In some communities, the high SES level is not as closely associated with positive early childhood development as expected. Conversely, some of the lower SES communities have more positive early childhood outcomes than the trend would indicate. Other factors than the SES are influencing these results.
50 45 40 35 30 25 20 55 0 10% 20% 30% 40% 50% 60% SEI scores Per centage of EGD1+ less
positive positivemore
mor
e
positive
less
positive
Graphic 19: The relationship of communities to SEI and EDI (EGD1+)
The 26 variables of the SEI were grouped into five categories or factors (economic stability, social mobility, cultural similarity, vulnerability and child care) in order to drill deeper into the impact of different aspects of socio-economic status. When the three most important factors of the SEI – economic stability, social mobility and cultural similarity – were considered separately, the socio-economic gradient was still present. However, the SEI as a whole was a better predictor than any of the factors alone.
10% 20% 30% 40% 50% 60%
Economic Stability (A)
0 5 10 15 20 25
SEI scores
Per
centage of EGD1+
less
positive positivemore
mor
e
positive
less
positive
Graphic 20 A to C: The relationship of communities to economic stability, social mobility, cultural similarity and EDI (EGD1+)
10% 20% 30% 40% 50% 60% Social Mobility (B) 0 5 10 15 20 25 SEI scores Per centage of EGD1+ less
positive positivemore
mor e positive less positive Graphic 20 A to C: continued 10% 20% 30% 40% 50% 60% Cultural Similarity (C) 0 5 10 15 20 25 SEI scores Per centage of EGD1+ less
positive positivemore
mor e positive less positive Graphic 20 A to C: continued
Although large percentages of children who live in low SEI scoring communities are experiencing poor EDI scores, the largest number of children experiencing difficulties is found in the middle socio-economic level communities. This is because middle-class households predominate in Alberta and so the largest overall number of children falls into this group. Out of the total number of 20,116 young children who are experiencing great difficulty in one or more areas of development, 16,552 live in middle SEI communities.
0 1000 2000 3000 4000 5000 6000 7000 8000 Number of EGD1+ Number of EGD1+ = 16,552 50 45 40 35 30 25 20 55
Total cohort EGD1+ (N=20,116)
SEI scores
less
positive positivemore
Graphic 21: Number of children EGD1+ by SEI score
In other research, economic disparity is linked to poorer early childhood development outcomes.10 Studies have shown that the greater the difference between the highest and
lowest income groups (that is the greater the economic inequities), the greater are the problems in early development and the years that follow at school and in adulthood. Testing this hypothesis using the Alberta data was difficult due to lack of data on the disparities at the community level. However, the preliminary analysis using data that was available indicates a weak relationship (correlation of .35) but is worth testing with more complete income data.
Community resources
Community resources, including programs, facilities, services and many other kinds of supports, can contribute to positive early development. Coalitions were invited to identify the assets and resources in their communities that support young children and families. A tool kit was developed to help them in this process. Coalitions identified a total of 23,106 assets and resources in their communities.11
The number of community assets and resources identified by communities vary across the province with the frequency being understandably higher in densely populated areas. (Please go to www.ecmap.ca for interactive maps of community resources.)
Preliminary analysis indicated that the frequency of the resources within a community does not appear to correlate with the early childhood outcomes. A significant positive correlation was found, however, between the SEI and the frequency of resources. Higher socio-economic status communities have more ECD resources.
Community assets and resources were further grouped and analyzed by two categories: those directly related to children and families and those more broadly related to the general community. The number of resources that communities identified as directly related to children and families was about 10,184, less than half of the total of 23,106. Without user rates and other measures of quality, it was not possible to determine if particular types and quantities of resources make a difference to early childhood development. A great deal more research is needed on the relationship between community resources and early development outcomes.
Legend
Number of resources
by community
ECD resources
4 - 63
64 - 98
99 - 165
166 - 408
409 - 1027
Community
engagement
Communities are part of the early environments in which young children grow and develop. They play an instrumental role in shaping early development and in supporting families to create the nurturing, rich and stable environments children need to learn, grow healthy and strong and flourish. Community engagement was recognized as vital to improving developmental outcomes for young children in Alberta and was
incorporated into the mandate of the ECD Mapping Initiative and the ECMap Project right from the beginning.
Building community capacity
ECMap community development coordinators were based in ten zones throughout the province to facilitate the development of community coalitions and collaborate with existing coalitions to promote positive early development locally and further the work of the project. One of the first tasks of coalitions was to define the geographic areas of their communities and map their boundaries. One hundred communities, covering the entire land mass of Alberta, and 300 subcommunities were identified through this process. (See page 3 for more details.)
Coalitions assumed responsibility for receiving and disseminating ECMap research data on early childhood development for their communities. They worked with community members in planning and coordinating responses to the findings. Their goal was to involve a broad cross-section of the community and tap into local knowledge and expertise to improve local child development outcomes. In the period between September 2010 and June 2014, coalitions built a total membership base of about 4,345 people, including a core group of about 1,130 people who regularly attend meetings and 3,215 affiliates who are kept informed of coalition activities.12
The size and makeup of each coalition was unique to the community. A number of sectors tended to be more often represented at coalition tables, however. The five sectors most frequently represented were: health (85 per cent of coalitions had representatives from health), schools (78 per cent), parents and
community members (73 per cent), libraries (70 per cent) and Parent Link centres (69 per cent). First Nations people were represented in 13 per cent of the coalitions and Francophones in nine per cent.13 In many
communities, coalitions brought together multiple sectors in the community to focus on early development for the first time.
0% 20% 40% 60% 80% 100% Post Secondary Per centage of coalitions Businesses Recr eation Politicians Mental Health
Child and Family Service Playschools Literacy City / T own Child Car e ECD Pr ograms FCSS Family Support Parent Link Libraries
Parents / Community School Health
Graphic 23: Community coalitions - Who’s at the table
An enormous amount of volunteer time was invested in ECD communities. A conservative estimate of the volunteer hours put in by coalition members is more than 40,000 hours a year once coalitions were up and running across the province. This includes the hours spent in regular coalition meetings, but not in subcommittee work or organizing community events.14
Coalitions were eligible to apply for one-time seed grants of up to $50,000, with the bulk of the funding coming from Alberta Education and a portion from Alberta Health. The grants were created to assist coalitions in raising local awareness about the importance of early childhood development, coordinating community resources and promoting community initiatives and cohesion to support positive development. Ninety-eight coalitions applied for the grants and 91 per cent of those chose to use part of their funding to hire local coordinators to help with the work of community-building.
The impact of coalitions on their communities and early development outcomes have not been documented comprehensively thus far. Many insights can be gained into the scope of their work and their accomplishments and challenges, however, from seed grant reports, community stories that have appeared on ECMap’s website and in the newsletter and research interviews. Reports submitted by ECMap community development coordinators and a study on the sustainability of coalitions in Alberta, Harvesting the Wisdom of Coalitions also provide invaluable information.15
Successes
Coalitions shared their community results widely with town and city councils, MLAs, school authorities and teachers, parents, libraries, local government recreation departments, early learning and care providers and organizations, health professionals, Parent Link centres, literacy groups, chambers of commerce, businesses, charitable groups, ethnic and faith-based organizations, and post-secondary early learning and care
programs. Results were communicated through one-on-one conversations, presentations, display booths at community and professional events, media interviews and creative, fun events to attract the whole family (e.g. beach parties, movie nights, kite flying competitions, family festivals). Coalitions also produced a wide variety of plain language, colourful materials, including display banners, posters, booklets, brochures, bookmarks and disposable table placemats for restaurants. In some communities with high ethnic populations, the information was translated into other languages. (Calgary’s North of McKnight coalition, for example, had its booklets translated into Punjabi, Hindi, Farsi, French, English, Arabic and Urdu.)
Sharing results
By publicizing local results and sparking community conversations around them, coalitions have been instrumental in mobilizing the data. Many school divisions now use the research results to guide their
planning and programming, including where to locate preschool and full-day kindergarten programs. Working with the EDI has also prompted many school divisions to adopt a more wholistic approach to learning that incorporates all five areas of development in their preschool and kindergarten classrooms. Libraries, like schools, have not only been strong partners in supporting the work of their local coalitions, but many have responded to the data by expanding their preschool programming and broadening their focus from early language acquisition and literacy to encompass all areas of development. Local parks and recreation departments have found the data useful in their decision-making, from making major investments (e.g. Strathcona County’s launch of a $350,000 state-of-the-art, play-based program for preschoolers in the fast-growing young hamlet of Ardrossan) to meeting basic needs (e.g. the installation of washrooms in Lethbridge city parks) and partnering on smaller, practical projects (the collaboration of the coalition, county and parks and rec in Ponoka to erect toy bins and ECD signs in playgrounds).
Raising awareness about early development and community resources
Raising awareness about the importance of early development and how brain development works was a crucial aspect of coalition work. Coalitions adopted many different strategies, from displaying key messages about early development on ‘bus’ benches (e.g. Lloydminster) and park signs (e.g. Rimbey), cards handed out in public places (Strathcona County) and employee pay stubs (e.g. Hinton) to organizing conferences on brain development (Crowsnest Pass) and parenting (e.g. Edmonton Mill Woods), and hundreds of workshops and talks on play-based learning, neuroscience and the impact of stress on preschoolers throughout the province. Many coalitions compiled booklets on community resources, programs and services after surveying community members and discovering that many were unaware of the family supports that were available to them in their community.
Coalitions throughout the province got together regionally and in the large urban centres to share resources, strategies and ideas and to approach regional and municipal elected officials and program administrators collectively to discuss their early development results and explore ways of moving forward with the data. Coalitions in Edmonton and Calgary have established more formal networks (Edmonton Early Years Coalitions and Calgary First 2000 Days Network) with their own websites and approaches to collaboration. Coalition members had opportunities to network provincially during two provincial gatherings organized by ECMap. Both were well attended (by 91 coalitions in the spring of 2014 and 83 coalitions in the fall of 2012) and highly rated by participants in follow-up surveys. The majority of participants supported the creation of a provincial umbrella group to promote sustainability and leverage resources.
Linking and leveraging
Coalitions are uniquely positioned to identify and communicate their communities’ needs and aspirations for children to local and provincial government. Coalitions provided their input into discussions about the Alberta Social Policy Framework and led 87 public conversations (Together We Raise Tomorrow) into the Alberta Approach to Early Childhood Development in the summer and fall of 2013. Over the past four years they have gathered a wealth of information about their communities, children and families through hundreds of meetings and one-on-one conversations, surveys of community members and by identifying and mapping their community resources.16
Providing input into public policy
Challenges
Along with the successes came the challenges. High turnover of local coordinators was an issue for many coalitions. Thirty-seven per cent of those that hired a coordinator went through two or more coordinators during their two-year grant period. The part-time positions were often designated as .2, or one-day per week positions, a factor that was largely blamed for the high attrition rate. Turnover of membership and leadership was also an issue for many coalitions.
The Harvesting the Wisdom of Coalitions study, undertaken by ECMap, Alberta Culture and Alberta Education, listed three factors that were identified by coalitions as important to their sustainability. The three factors identified most frequently were: clarity and commitment of members to a common vision, a representative and stable membership and an inclusive style of leadership in the coalitions.
Observations and
interpretations
1. Alberta children could and should be doing much better. They are currently falling below the Canadian norm for early childhood development. Alberta EDI baseline data indicates that less than 50 per cent of young children are developing appropriately in all five areas of development when they reach kindergarten. A large portion, nearly one third, is experiencing great difficulties when compared to the Canadian norm for vulnerability. When each area of development is considered separately, between one quarter and one third of the children are reported to be experiencing some or great difficulties. These statistics do not include kindergarten-aged children with severe disabilities (approximately 2.5 percent of the total).
2. Clearly many children in Alberta are experiencing difficulties by age five. Research on early childhood development would suggest that many of these delays are already evident by age three. The prenatal months to age three are a critical period for laying the foundation for healthy development. It would appear that many children in this province are not getting the support they need during their crucial early development years.
3. Every community in Alberta has a percentage of children experiencing great difficulty in one or more of the areas of development. The percentages range from a low of 12 per cent to a high of 53 percent, compared to the Canadian norm of 25.4 per cent. Sixty-six communities in Alberta have a higher percentage of children experiencing great difficulty than the Canadian norm. The percentage of children experiencing great difficulties in two or more areas of development range from two per cent to 28 per cent in communities, compared to the Canadian norm of 12.4 per cent. Every community has children who are struggling in their development. No single geographic characteristic (density, urban/rural, north/ south) appeared to make a difference to EDI results. Improving ECD population outcomes requires a strategy that encompasses all communities.
4. Each of the five areas of development had a slightly different pattern of reported outcomes. The area of development that appeared to be the greatest challenge was communication skills and general knowledge. The five areas of development are inter-related, however, and difficulties that appear in one area tend to be indicative of difficulties in other areas as well. A wholistic approach to development is an essential element in planning and programming.
5. The correlation between socio-economic status (SES) and early childhood outcomes (EGD1+) is relatively high. The more positive the socio-economic status of a community, the more likely the early childhood outcomes will be positive. Alberta communities vary widely in their overall socio-economic levels and in the patterns of economic, social and cultural factors. Some communities also vary widely within their boundaries. Economic stability stands out as the most important factor in Alberta as a whole, but at the community level, social mobility and cultural similarity are more prominent influences in many communities. Targetting services only to low-income areas will miss other important factors.
6. Although a higher percentage of children in low socio-economic communities experience great difficulty compared to higher SES communities, the largest number of children who are struggling is found in middle income/class communities. Targetting supports only to communities with low SES will miss the majority of communities where the largest number of children are having difficulty.
7. More than 23,000 community resources (services, programs, community characteristics) were identified and mapped by communities. Analysis at the community level indicates that the number of ECD resources did not appear to be related to EDI results. One possible explanation for this is that there was no information available during this first round of resource data collection about the quality of the resources and user rates. These are important factors that could affect results. Resources that are not used long enough or by enough children may also not have an impact on the population levels of EDI results.
8. Communicating results to communities through geographic maps proved to be a highly successful strategy. Maps established a sense of “common ground” during local coalition and community gatherings, engaging people from all backgrounds in conversations about the early years. Maps also provided a provincewide overview that related the local community to other communities and to Alberta as a whole.
9. Engaging community members in early childhood development coalitions proved to be valuable in a number of ways. Coalitions provided a link to communities and their unique features. They became an avenue for communicating community results to groups committed to the well-being of young children who could in turn communicate the information to the rest of the community. They became central to planning responses to the data and were a valuable source of information on local needs, strengths and gaps for policy-makers and decision-makers.
10. In many communities, coalitions brought together many sectors from their communities to work together on issues related to ECD for the first time. Coalition members reported that they were able to learn more from each other about their own communities and the programs, resources and services available about which they had been unaware.
11. In surveys from two provincial gatherings, coalition members indicated they strongly support the creation of regional networks and a provincial network to exchange views, share resources and learn from one another. The need for continued local autonomy was also expressed. 12. ECMap community development coordinators have played an important role in supporting
the work of coalitions. Seventy-five per cent of respondents to an ECMap 2014 spring survey indicated that their support was very important. Coalition members listed a number of other factors as important to their sustainability: a commitment to a common vision for ECD, representativeness of the community in the coalition membership and an inclusive style of leadership. Turnover in membership and staff and limited leadership capacity at the local levels were cited as problems by many coalitions.
13. Community coalitions found many ways to use the research information from the reports provided them through the mapping project. Local groups and agencies collaborated with ECD coalitions to use the data for planning and implementing new or enhanced services and programs, and needed policy changes.
14. Provincial and local authorities in different sectors have begun using the evidence from the study to improve existing programs and conduct research on the links between their work and EDI outcomes. 15. As with all research, this study has limitations:
• EDI data from about 20 percent of the population of kindergarten children was missing due to a number of factors, including the absence of data from First Nations federal schools, missing data or errors in the questionnaire, and lack of consent from parents.
• SES data from the Statistics Canada voluntary national household survey of 2011 could not be used to update the SEI to reflect more recent changes at the community level.
• More detailed information about community resources would have allowed a closer look at possible links between local resources and population level early childhood outcomes.
Policy
recommendations
Drawing upon the research knowledge and community engagement experience gained over the past five years, the ECMap Project puts forward the following recommendations to help Alberta succeed in building a strong foundation for the early years:
1. “What gets counted, counts.” Clyde Hertzman (Human Early Learning Partnership, University
of British Columbia)
Recommendation: Continue to gather, analyze and share EDI data as part of a comprehensive early childhood development monitoring system for Alberta
The EDI provides a population measure of early development outcomes that can be cost effectively implemented across the entire province, providing broad information at the local, regional and provincial levels. The EDI can play a major role in supporting evidence-based planning and decision-making at the community and provincial levels. Continued use of the EDI links Alberta to the Pan Canadian EDI network and provides a Canadian context for early development outcomes in Alberta. EDI data has served as a compelling focal point for bringing local ECD coalitions together to work on behalf of young children in their communities. The results have enabled communities to identify common goals and plans despite different cultural and social backgrounds and different agency affiliations.
Better coordination is needed, however, among the various agencies and departments that currently collect data that is related to early childhood, including health data. The implementation of a high quality monitoring system that can assess the collective impact of initiatives intended to support positive development is
essential. Such a system goes beyond simple data sharing. It requires agreement on a joint or common set of measures. A comprehensive system is key to improving outcomes for all children in this province.
2. “If it’s about us, don’t do it without us.” Chris Corrigan (Civic Engagement, Simon Fraser
University)
Recommendation: Refine and use the ECD community and subcommunity boundaries as a base for
mapping results and engaging families and community members; and support the continuation of community coalitions in utilizing research data for community and provincial action planning for ECD in Alberta
With community boundaries in place, all kinds of data, in addition to EDI data, can be grouped, analyzed and shared according to geographic location. A common set of community and subcommunity boundaries makes it possible to link data from different local and provincial administrative units to the families and citizens in a community and lead to community action planning and engagement. Mapping data is a powerful means of engaging communities in the meaningful use of research data for planning effective actions.
of their young children, spreading word about the importance of the early years and ECD results for their communities, and working on plans to improve outcomes and improve programs and policies. Community development coordinators positioned throughout the province played a vital role in supporting the growth and development of coalitions and assisted them in the first steps of their long-term planning.
3. “ A rising tide lifts all boats.” J.F. Kennedy, (Speech, 1963)
Recommendation: Ensure that healthy, supportive, nurturing environments are available for all children regardless of socio-economic status, disabilities, family circumstances, cultural backgrounds or geographic location in the province
Up until now, the approaches to early childhood development in Alberta have not achieved the results we would have hoped for. A high percentage of young children in Alberta are not developing to their full potential, and large numbers of children are experiencing great difficulty socially, emotionally, physically and intellectually. The question is: Why? Why are the results not better? Why are so many children running into difficulty despite living in a province so rich with promise? Why are children struggling developmentally in all communities and at all socio-economic levels? Why are the initiatives and efforts that have been underway for decades not achieving better results?
Part of the answer may be the overall approach being used in Alberta. Most of the attempts to improve young children’s well-being have been individual level approaches. The goal of these approaches is to treat or prevent the disorder at the individual level. This addresses the problems or suffering of individual children or families but does little to reduce the overall number of children experiencing difficulty. This could be because programs targeted at individual children wait until the developmental delay is evident, when it’s too late to take preventative measures. Or they identify a vulnerable group — such as boys or a particular low socio-economic community — and then develop intervention programs, thus missing the many children who are experiencing difficulties, children that are not members of those groups. Children in Alberta exhibiting great difficulties are to be found in all communities and in all social and demographic groups.
A different approach is needed to reduce the numbers of vulnerable children in Alberta. Population approaches provide universal access to broad services, paying particular additional attention to children in need of special support. This approach is sometimes referred to as “proportionate universality” and its success has been documented in many reports in research studies of OECD countries.17
4. “It takes a knowledgeable and caring village to raise a child.” An African proverb,
reframed
Recommendation: Develop a strategy to increasethe general knowledge and understanding of early childhood development throughout the general population in the communities of Alberta
Improving early childhood outcomes will not happen without full support across each community. The well-being of the whole community influences the well-being of its children, whether through the direct daily contact or through indirect influences, such as family- and child-related policies. Increasing public understanding about the importance of early childhood development and the instrumental role communities play in promoting positive outcomes encourages community engagement around the early years. As coalitions worked to raise awareness in their communities, support grew for local action around families and children from community leaders, businesses, parents, non-profit organizations and service agencies, and others.
There is still a long way to go. The recent ‘Benchmark Study ’ surveying general knowledge of early childhood development indicated that the average Albertan’s knowledge about early development is still quite low.18 5. Leadership, the critical ingredient.
Recommendation: Re-examine the current qualifications and education requirements for professionals in the early education fields; and create a strategy to improve and align the requirements and increase the depth of knowledge about ECD in related professional fields
In-depth knowledge in early childhood development and strong leadership capabilities are needed across the province. Over the course of the mapping project, it became evident that hiring knowledgeable and experienced early childhood development leaders and practitioners at the local and provincial levels has been a challenge. Post-secondary programs in early childhood development in colleges and universities have been graduating relatively few people to fill the leadership roles. Rapid growth in the need for both leaders and practitioners in the early childhood field is one of the bigger challenges facing our communities and governments.
Early childhood knowledge is not included as part of the qualification requirements for most of the professions that serve young children and their families. Family practices in medicine, law and social work; child
care, nursery or kindergarten programs; and community-based services such as libraries, recreation and community planning do not have universal requirements for specific ECD preparation or qualifications. Even kindergarten teachers are not required to study early childhood development.
In British Columbia, thought is being given to developing an institute to foster community-based knowledge and practice in early childhood development. At the University of Alberta, the Community-University
Partnership has begun an initiative to build an ECD evaluation network, and is looking at developing an ECD policy unit. Initiatives such as these represent a response to a pressing problem, but can hardly fulfill the great need evident in the province. Government leadership in early childhood across all departments is key to moving forward.
6. “Governance in ECD: Patchwork, perils and promise …” from Howe and Prochner (2012)
Recent Perspectives on Early Childhood Education in Canada
Recommendation: Establish a permanent provincial secretariat of Human Early Learning and Development (HELD) with a cross-departmental mandate and budget to set out and implement strategies that enhance the collective impact of government activity on early childhood development
Alberta rates poorly compared to other provinces in its policies, supports and governance of early
childhood.19 The focus on early childhood services and supports is diluted by the multiple and often conflicting
acts, regulations, portfolios, funding strategies, levels of governance and service/program guidelines. Even the definition of the word ‘child’, so fundamental to an effective governance framework, differs across departments of government. Centralizing the ECD roles of government in one department alone will not overcome the fragmentation that currently exists. Led by a minister or an associate minister, HELD would have a unique early childhood development mandate and would be responsible for the following;
• engaging every provincial department in identifying and owning its own aspect of influence in ECD,