PhD THESIS
UNIVERSITY OF KAPOSVÁR
FACULTY OF ECONOMICSINSTITUTE OF ECONOMICS AND ORGANIZATION DEPARTMENT OF MARKETING AND QUALITY
MANAGEMENT
Head of programme:
Dr. Gyula Széles
Doctor of the Hungarian Academy of Sciences University professor
Supervisor:
Dr. habil. Zoltán Szakály
Candidate of agricultural sciences Assistant professor
The structural change of dairy products consumption plotted
against customers’ behaviour
Author:
Péter Huszka
Kaposvár
1.
THE ANTECEDENTS OF THE RESEARCH, AIMS
Factors affecting food consumption came into the limelight of the scientific researches in the last decades of the 20th century. The participants of the agricultural market, from the primary producers to the leaders of the government offices, face the fact that the carefully worked-out and adopted marketing for the production process can establish the efficient work of the food industry. According to KOTLER (2000): “Marketing is too important to entrust it to one department.” Marketing accompanies the life of the product, puts forward a proposal for the improvement of the products’ characteristics and attraction evaluates the turnover of the product and points out the experiences of the distribution.The experiences of the developed countries verify that that kind of market strategy can be successful which can handle the product improvement, the price strategy and the claims of the consumers accordingly and can be guided by the changing home market.
As a consequence it is important for the marketing strategies to know the characteristics and the processes of the home food market which leads to the scientific establishment of the marketing work of the companies.
The manufacturers have to get to know the consumption and buying habits of the inhabitants, different target groups have to be determined for the different products and they have to adjust to the newest nutrition habits and trends to increase the sales.
It is supported by the fact that the market shares of the dairy products with low fat content and high content mineral substances are increasing significantly, and the consumption of the fruit yoghurts is increasing, too.
On the other hand, it can be experienced that the consumption of basic dairy products like liquid milk stagnates at low level, and it looks impossible to reach the 240-250 kg per capita dairy product consumption of the developed countries (SZAKÁLY S., 2000).
Some of food companies still think that if they spend enough money on marketing, their investment will cover quickly. The managers think that marketing is the same as the sale, and they think it is more important to get a new consumer than to keep an old one. Instead of trying to satisfy their real claims, they put in the centre of the strategy the sale of the product (SZAKÁLY Z., 2001).
It is necessary to examine the buying and consumption habits to get to know the opinions of the Hungarian consumers about dairy products. Some surveys have already been made in the last years. They examined some fields of
my knowledge no scientific research in the field of the buying and consumption habits in the dairy market has been done yet. So the research behind this thesis fills a long-felt gap.
The most important aims of the research are the following:
1. The working-up of the relevant Hungarian and foreign technical literature.
2. Analysis of the consumers’ and buyers’ behaviour with primary research method in Hungary.
3. The analysis of the result of the effective demand and prices on the Hungarian food – within this the dairy product - consumption habits. 4. The demonstration of the changing consumption habits of the dairy
products and revealing the future trends.
5. Making a proposal for the dairy companies about how to develop a useful marketing strategy.
The following tasks were set to reach the mentioned aims:
– The demonstration of the Hungarian milk and dairy product consumption circumstances and volume.
– The examination of the different factors which have influence on the buyers’ and consumers’ decisions.
– To get to know the characteristics of the milk and dairy product consumption frequency, the consumed quantity in the course of the different meals, the popularity of the different kinds of dairy products.
– How often are milk and dairy products consumed in the course of different meals and what kind of dairy products are the most characteristic.
– To get to know the consumption frequency of the dairy products, what quantities are bought in the different kinds of groceries.
– Make a comparison between the buying and consumption frequencies. – What kind of factors affect the consumers during their choice of the
products.
The given answers may include important information about the buying and consumption habits for the experts who work in the field of food industry, mainly in the dairy industry. We can get some other important information about the separation of the different target groups, the popularity of the different dairy products and some anomalies (etc.: butter, margarine).
2.
MATERIALS AND METHODS
During my research the two basically methods of the marketing research, the secondary (so called ecoscopic) and the primary (so called demoscopic) methods were applied. Secondary market research means the systematic collection, processing and analysis of existing information. Primary research means an original data recording about the behaviour and opinion of the actors of the market.
2.1. Applied methods of the secondary research
In case of the ecoscopic examination I viewed with using of domestic and internationally specialist literature the characterise of food consumer behaviour, and the main factors, which influence the consumer behaviour. Also with this method I examined the human health and food consumption of different nations. I focused on the role of milk and dairy products in food consumption and in healthy nutrition.
The data regarding the consumption of dairy products, milk, butter and cheese were provided by the FAO internet database and the IDF BULLETIN. 2.2. Applied methods of the primary research
According to the interpretation of the modern marketing the primary market research can be divided into two main groups: qualitative and quantitative researches. The first is an unstructured, revealing method, which is based on a small, not representative sample, the results are informative and in generally are followed by further researches. The qualitative research is a “revealing“ survey, which tries to recognise the reasons behind the consumers’ behaviour, because it focuses on the “why”-s.
The fundamental goal of quantitative research is to give as reliable numerical answers as possible on the questions. During my work I applied the method of quantitative research.
In majority the research was based on quantitative survey within it on
personal interviews. At setting up the samples was the basis the last national
census of KSH in 2001. The preparation and the national representative interviews were carried out according to the following plan of sampling.
During the sampling a thousand individuals were chosen. This size of the sample provided on the one hand that the subgroups formed by different background variables will provide sufficient members to receive statistically reliable results, on the other hand that this number is general in the international
The personal interviews were carried out between October 2003 and December 2004, the incorrect data were supplied in summer 2004.
At setting up the samples the primary aim was to ensure the representativeness of the sample. A many-stage sampling method was created to provide multiple representativeness. Its steps are the followings:
• The ground crowd was divided according to the seven region of the country.
• It was determined according to the population data of each region, that out of the 1000 how many consumers should be made to fill out the questionnaire in the given region.
• In every region a county was chosen, then with the help of the latest publications of KSH the number, respectively the ratio of the inhabitants living in the county seat, in the cities and in the villages was calculated. • Besides this, we examined the three types of settlements concerning the
distribution of the inhabitants by sex, by age and by school qualification. • Finally, a quote system was worked out, and the questionnaire was
distributed according to this.
The basis of the reliable results – over the representativeness – is, that possibility of chance choice has to be provided. To this was applied the method of “random walking”, which has characterise, that all people has the same chance, to came into the sample. The method “random walking” I combined with the method “birthday key” in home, so providing the chance in the second step, too. The essence of the method is, that those family member has to fill in the questionnaire, whose birthday is the nearest to the day of question.
For the easier processing the questionnaire made by me contains closed questions. In the most case the responders had to write their answers on a five-graded scale. This was easy to understand, and the results show good the opinion of the responders.
The questionnaire deal basically with two area, they are the followings: The examination of the consumption habits, where I analysed, how often
and in what quantity the responders consume the products. I also examined the likely of the products, the changes in the past 5 years, and that during meals how often and what quantity we consumed from the different products.
During the examination of the purchasing habits I analysed, how often
the responders buy dairy products. It was also important, what quantity from the different dairy products and margarine the responders buy in the certain case. I also examined, in what kind of shop type the responders buy, as well as the quality of dairy products, and the choosing considerations during the shopping.
At the questions about the quantity of the purchase and consumption I applied open questions. The responders had to write the values with number into the tables. Then I recoded the answers, and wrote this codenumbers into the statistic program.
The processing of numerous data happened with the SPSS for Windows 9.0 mathematical-statistical program. The software calculated the distribution of frequency, cross tables were used to analyse the connections of all the variables with the background variables and the relations among the variables. Besides calculating the averages, significance testes were conducted with Chi-square test, and for multiple analyses ANOVA, cluster and factor analyses were used.
With the rework of the method created by SZAKÁLY Z. (1994) was shown the frequency of the consumption of dairy products. The frequency of the consumption had to marked on an eight-graded frequency scale. With using of the method was shown also the annually frequency of the products, that is how many times a given product is consumed annually in Hungary. If we divide the number of days in a year with the number of consumption cases in a year we can get, on which day we consume a given product.
In this form the values of the frequency scale can be summarized in one number so the measure of the purchase and consumption can be expressed graphic.
3.
RESULTS
During the statement of our current results we present at first on the basis of the domestic and international statistical data the change of milk and dairy product consumption. We found important the detailed presentation and treatment of a consistent international database. The consumption data in the literary outlines complete with the price and income relations each other. The results and connections are summarized on basis of new organizing principles and completed with new ideas.
3.1. Change of milk and dairy products consumption
The milk and dairy consumption worldwide similar to many other foods was characterised by stagnating and also in the next few years can be expected
only a little increase. Considering longer time is the production more or less same with the consumption, too. But in the different region in the world is the picture not so unified. While the consumption of some product increased considerably, the demand to other products reduced.
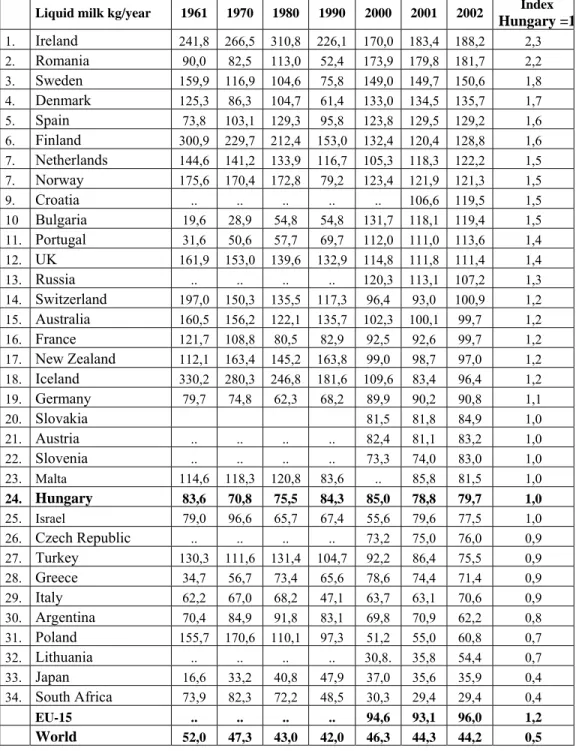
In my thesis I present just the dairy product consumption in liquid milk (here was increase) and the change of cheese consumption in the table 1 and 2.
The consumption in liquid milk reduced between 1961 and 2002 internationally with 15%, but this passed off in the certain countries not unified.
Basically can be found, that in the case of developed countries was big consumption increase, but from a low level, as can be seen in the table 1. It
means, that in the developing countries was the average liquid milk consumption in 1961 19,6 litre, which increased to 2002 with 58,1% and reached 31 litre. In the developed countries in the same time the 120,9 litre consumption per person per year reduced to 92,9 litre (www.fao.org., 2002).
Table 1
The liquid milk consumption in different countries in decreasing order in 2002 Liquid milk kg/year 1961 1970 1980 1990 2000 2001 2002 Index
Hungary =1 1. Ireland 241,8 266,5 310,8 226,1 170,0 183,4 188,2 2,3 2. Romania 90,0 82,5 113,0 52,4 173,9 179,8 181,7 2,2 3. Sweden 159,9 116,9 104,6 75,8 149,0 149,7 150,6 1,8 4. Denmark 125,3 86,3 104,7 61,4 133,0 134,5 135,7 1,7 5. Spain 73,8 103,1 129,3 95,8 123,8 129,5 129,2 1,6 6. Finland 300,9 229,7 212,4 153,0 132,4 120,4 128,8 1,6 7. Netherlands 144,6 141,2 133,9 116,7 105,3 118,3 122,2 1,5 7. Norway 175,6 170,4 172,8 79,2 123,4 121,9 121,3 1,5 9. Croatia .. .. .. .. .. 106,6 119,5 1,5 10 Bulgaria 19,6 28,9 54,8 54,8 131,7 118,1 119,4 1,5 11. Portugal 31,6 50,6 57,7 69,7 112,0 111,0 113,6 1,4 12. UK 161,9 153,0 139,6 132,9 114,8 111,8 111,4 1,4 13. Russia .. .. .. .. 120,3 113,1 107,2 1,3 14. Switzerland 197,0 150,3 135,5 117,3 96,4 93,0 100,9 1,2 15. Australia 160,5 156,2 122,1 135,7 102,3 100,1 99,7 1,2 16. France 121,7 108,8 80,5 82,9 92,5 92,6 99,7 1,2 17. New Zealand 112,1 163,4 145,2 163,8 99,0 98,7 97,0 1,2 18. Iceland 330,2 280,3 246,8 181,6 109,6 83,4 96,4 1,2 19. Germany 79,7 74,8 62,3 68,2 89,9 90,2 90,8 1,1 20. Slovakia 81,5 81,8 84,9 1,0 21. Austria .. .. .. .. 82,4 81,1 83,2 1,0 22. Slovenia .. .. .. .. 73,3 74,0 83,0 1,0 23. Malta 114,6 118,3 120,8 83,6 .. 85,8 81,5 1,0 24. Hungary 83,6 70,8 75,5 84,3 85,0 78,8 79,7 1,0 25. Israel 79,0 96,6 65,7 67,4 55,6 79,6 77,5 1,0 26. Czech Republic .. .. .. .. 73,2 75,0 76,0 0,9 27. Turkey 130,3 111,6 131,4 104,7 92,2 86,4 75,5 0,9 28. Greece 34,7 56,7 73,4 65,6 78,6 74,4 71,4 0,9 29. Italy 62,2 67,0 68,2 47,1 63,7 63,1 70,6 0,9 30. Argentina 70,4 84,9 91,8 83,1 69,8 70,9 62,2 0,8 31. Poland 155,7 170,6 110,1 97,3 51,2 55,0 60,8 0,7 32. Lithuania .. .. .. .. 30,8. 35,8 54,4 0,7 33. Japan 16,6 33,2 40,8 47,9 37,0 35,6 35,9 0,4 34. South Africa 73,9 82,3 72,2 48,5 30,3 29,4 29,4 0,4 EU-15 .. .. .. .. 94,6 93,1 96,0 1,2 World 52,0 47,3 43,0 42,0 46,3 44,3 44,2 0,5
Table 2
The cheese consumption per head in different countries in the decreasing order in 2002 Cheese consumption kg /year 1961 1970 1980 1990 2000 2001 2002 Index Hungary =1 1. Greece 13,3 17,5 20,5 25,0 25,4 26,6 27,5 3,1 2. France 9,8 14,1 18,1 21,7 25,3 25,8 25,9 2,9 3. Iceland 7,3 10,9 11,9 9,3 20,6 22,8 22,3 2,5 4. Italy 7,5 10,2 14,4 20,2 22,3 21,4 21,8 2,4 5. Germany 7,3 9,8 12,9 17,5 21,2 21,6 21,7 2,4 6. Denmark 9,4 9,3 10,7 14,6 15,1 21,6 21,5 2,4 7. Switzerland 8,1 9,8 13,4 14,5 17,8 18,2 18,3 2,1 8. Austria 5,4 5,8 8,2 11,8 18,0 17,5 17,8 2,0 9. Sweden 8,3 8,9 13,8 15,6 17,0 17,3 17,6 2,0 10. Finland 3,3 4,3 5,7 13,3 16,3 16,5 16,6 1,9 11. Norway 9,1 9,5 13 14,9 15,1 15,3 15,3 1,7 12. USA 5,7 7,3 9,8 12,6 14,6 15,1 15,3 1,7 13. Netherlands 9,1 8,8 15,1 14,7 14,5 14,7 14,7 1,7 14. Malta 4,5 5,7 7,5 11,4 13,0 12,6 12,9 1,4 15. Australia 2,9 3,4 7,2 8,3 11,4 11,6 12,0 1,3 16. Poland 5,8 7,3 10,9 9,4 10,4 10,9 11,8 1,3 17. Slovakia .. .. .. .. 6,7 8,0 11,0 1,2 18. UK 4,6 5,3 6 7,7 9,9 10 10,8 1,2 19. Czech Republic .. .. .. .. 10,5 10,2 10,7 1,2 20. Slovenia .. .. .. .. 5,2 10,2 10,7 1,2 21. Ireland 1,3 2,1 3,1 4,5 10,3 10,3 10,3 1,2 22. Portugal 2,4 2,4 3,7 6 9,3 10,0 10,1 1,1 23. Spain 1,7 2,7 4,2 5,2 9,0 8,7 9,1 1,0 24. Hungary 1,4 3,3 5,4 6,7 10,1 8,7 8,9 1,0 25. Estonia .. .. .. .. 13,1 10,2 8,5 1,0 26. New Zealand 4,2 3,4 7 8,4 7,3 7,3 7,1 0,8 27. Croatia .. .. .. .. 5,2 6,4 7,1 0,8 28. Latvia .. .. .. .. 5,0 5,0 5,8 0,7 29. Russia .. .. .. .. 4,8 5,3 5,5 0,6 30. Lithuania .. .. .. .. 3,9 .. 4,7 0,5 31. Albania 2,3 2,8 3,6 4,1 4,1 3,6 4,4 0,5 32. Ukraine .. .. .. .. 1,4 .. 2,3 0,3 33. Turkey 2,5 2,7 3 2,4 2 1,8 1,7 0,2 34. Romania 2,8 3,7 5,6 4 1,8 1,7 1,5 0,2 EU-15 .. .. .. .. 18,3 18,8 18,7 2,1 World 1,7 2,1 2,6 2,8 2,6 2,6 2,8 0,3
From: International Statistical Annual, (2001); www.fao.org., (2002); IDF Bulletin (2004);
Seeing the total milk consumption of Hungary, the country is on the 24th place from the 34 countries. So we are in the last third part. On the 1st place is Ireland with a 2,3 times greater consumption. On the 2nd place stands Rumania with a 181,7 liter consumption, before some well developed countries. The high total milk consumption is probably based on the culture and knowed the economic state of development this is maybe the only product, which they can afford to buy or to produce at home. Turned back to the domestic consumption, it is very spectacular, that the increase of milk consumption stopped in 2001. For example we consumed in 2002 with 6,2% less than on turn of the millennium. Its cause mainly was, that the increase of price was much greater than the inflation.
If we see only the statistical data, it can seem favourable, that an average consumer in the EU consumes only with 20% more liquid milk than in Hungary, and there are some Union country, where is the liquid milk consumption with 5-10% less. It is also important, that in these countries –similar to developed region of the world– the liquid milk consumption reduced in the examined period in big measure, sometimes with 50%. Parallel wit this the milk “infiltrate” more and more in other foods and so it comes to consumers as dairy products with bigger additional value. This is shown by data of table 2.
In case of cheese the consumption grown overall the world, but in a very
different rate. The greatest change happened in the well-developed countries,
where the consumption doubled, while in the developing countries the
consumption grown only with 50% from a very low level (0,4 kg) (www.fao.org., 2002).
In the last few years the tendency of consumption changed and a new rule will stand out, that the higher is the consumption the smaller is the growing.
The cheese consumption of Hungary similar to the other milk products is not sayable to satisfactory, sith we take place out of the 34 countries the 24th place. At the same time we can experience slow increase. The tempo of the increase is hopeful. But the volume of domestic consumption is even so under the average of EU and on macro level is the same with the developed countries.
3.2. Examination of the frequency of the consumption of milk, dairy products and margarine
The responders had to mark the frequency of consumption of the certain products on an eight-part scale as in the abovementioned. The results in the Figure 1 show, that the certain dairy products and the margarine in which day come to the table of the consumers, which is the measure number of the frequency of the consumption.
1,9 2,1 2,4 2,5 3,0 3,5 3,7 4,0 4,5 6,6 7,2 7,9 8,1 9,7 11,0 13,6 14,2 0 2 4 6 8 10 12 14 16 Ma rg ar in e M ilk in p la sti c b ag Bu tte r Mi lk c ar ton R ipe d c he es e B ut ter cr ea m Fr ui t yogur t Sour c re am M ilk d esse rt s Pr oc esse d c he ese Mi lk pow de r Ke fi r Fl avour ed m ilk Cr ea m Cu rd s Y ogur t of na tu ra l t as te Ic e cr ea m
Figure 1: Consumption frequency of different diary products and margarine yearly, in terms of days (n=1000)
Our results show, that we consume the cheaper milk in a plastic bag average per two days, which stands nearest to the consumption of margarine.
The butter and the more expensive, but best quality founded canned milk we take on our table per two and a half days. It follow the more and more liked
ripened cheeses, butter creams, fruit yoghurts and sour cream.
This means consumption per thee-four days. We consume the milk desserts, processed cheeses and milk powder minimum once a week. The last one use the responders fast only to coffee.
The row end curds, nature yoghurt and ice lolly. The last one we consumed per two weeks.
In the mirror of the extremely high value of butter consumption we must call attention to this, that the big part of the population is not aware of differences between the butter and margarine. The big part of the consumers consumes margarine in the belief that he consumes of milk origin product.
I asked also different opinion of buyers. With the question “the margarine is also an of milk origin product” was full agree the 27,1% of the responders, 9,9% was some agree, and 19,0 % said I agree and I do not agree, too. The 56,0% of the buyers has incorrect knowledge.
Only the one third (37,8%) of the responders knew surely that the
margarine is not dairy product. Thus the extremely high value of the
consumption of butter is not so shocking, which is essential information for the dairy companies. The population should be informed about this, which can lead to the increase of butter consumption. The mentioned I show in the Table 3.
Table 3
Agreement of asked consumers with statement „margarine is a dairy product”, in % (n=1000)
Value of agreement
Agree fully
Agree partly Yes and no Do not agree partly
Do not agree fully
Altogether 27,1 9,9 19,0 6,2 37,8
Regarding the above is thinkable also the data, that the 59,4% of the responders consume margarine daily or much times per week, thus it is before the butter and butter cream. It is the question, what kind of product want to consume eventually the consumers, when they eat margarine!
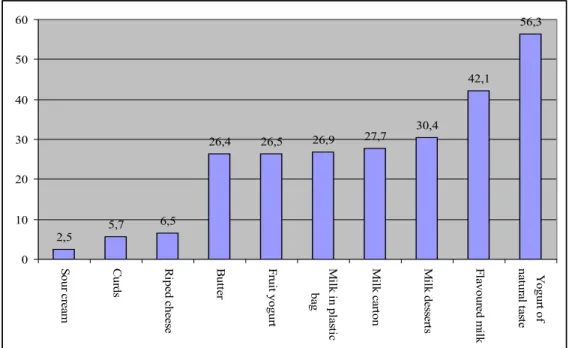
The rate of non-consumers of different products in case of most important dairy products shows the Figure 2.
2,5 5,7 6,5 26,4 26,5 26,9 27,7 30,4 42,1 56,3 0 10 20 30 40 50 60 So ur cr eam Cu rd s R ip ed ch ees e B utte r Fr ui t yogur t M ilk in p la stic ba g M ilk c arto n M ilk d es se rts Fl avour ed m ilk Y ogur t of na tu ra l ta ste
Figure 2: Percentage of non-consumers plotted against frequency (n=1000)
I can be found, that 56,3 percent of the answerers said they never
consume any yogurt of natural taste and 42,1 percent was the non-consumption of flavoured milk from the most frequent diary products, as can be seen in Figure 1. It is in harmony with the popularity value of these two products. At the other end of the pole there are the sour cream with a value of 2,5%, the curds of 5,7%, riped cheese of 6,7%. This goes to show that the rate of non-consumers in case of these products is low, that we can explain with a Hungarian national dish, noodles with cottage cheese as well as the Hungarian nutrition habits.
The rate of those who do not consume butter and liquid dairy products is
26,9% in case of milk in plastic bag, 27,7% milk carton, 26,4% butter.
The reason for this is Hungarian nutrition habits, because plenty of consumers eat these much liked dairy products for breakfast or supper.
If milk and diary products are examined together, and we want to know how many people do not consume any diary products, we practise that this number is 25,9%. However, it can be proved that the overwhelming majority of
3.2.1. Examination of consumed quantity of milk and dairy products
The next question of my survey concerned the quantity of dairy products and margarine consumed during each meal. To become acquainted with the
dairy product consumption habit is not enough just to know, how often we consume the products, but we have to know the consumed quantities, too. From the table 4 can be read some important results.
Table 4
Percentage division of quantity of some products consumed during meals
Never 1dl 2-3 dl 4-5 dl 6 dl +
%
Milk in plastic bag 26,9 6,9 41,9 18,5 5,8
Milk in carton 27,7 6,1 44,3 15,4 6,5
Flavoured milk 42,1 4,7 35,7 16,4 1,1
Never 1/2packaging 1 packaging 2 packaging 3 packaging +
Fruit yogurt 26,5 5,6 60,1 5,6 2,2
Never 1-4 dkg 5-10 dkg 11-15 dkg 16 dkg +
Riped cheese 6,5 13,3 60,3 6,4 13,5
Processed cheese 16,9 32,2 41,4 3,5 6,0
From the data of table can be seen, that the consumed quantity if liquid milks and flavoured milks is decisively 2-3 dl. 40% of the population consume this quantity. Regarding that only the 7,5% of the population consume the liquid milks several times a day, we can find: that milk quantity, which we consume, is not enough nutrition biological.
In connection with fruit yoghurts we can observe, that the big part of
population likes it, so the big part of population consumes it, too. The share of not consumer is little.
From the table 4 can we also find, that the big part of cheese consumers eat between 5 and 10 dkg.
Quantity of Consumption Name of product
3.3. Popularity of milk and dairy production
The next question of my survey was aimed at popularity of the dairy products. The responders had to mark on a scale 1-5, how they like the products (1: I like it at all, 3: I also like, and also do not like it, 5: I like it expressly). On the basis of the answers formed the following order (Figure 3).
4,49 4,16 4,03 4,03 4,02 3,97 3,90 3,70 3,69 3,60 3,57 3,56 3,54 3,25 3,13 2,56 2,06 0,0 1,0 2,0 3,0 4,0 5,0 R iped c hees e C ream Ice c ream M ilk d e sse rt s F rui t y ogurt Cu rd s P roc es s ed c hees e M a rgari n e B u tterc ream Mi lk i n c a rt o n Bu tte r S our c ream M ilk i n pl as tic bag F lav our ed m ilk Ke fir Y ogurt of nat ur al t a s te M ilk pow der
Figure 3: Popularity of various dairy products, in decreasing order of popularity (n=987)
Our results partly support, partly oppose respectively complete the results of BERKE (2003). On the basis of the data of diagram the popularity of riped cheese can said proper, as it reach the low limit of category “I like it expressly” (4,5). We think important, that the dispersion 0,8 is the lowest under the products, which indicates us, that the consumers are the least divided regarding the popularity of product.
It is worth remarking, that the main part of products belong to category “liked”, if we the value of category explain between 4,5 and 3,5. To this yet acceptable category belong our most important basis dairy foods and the margarine, too.
4 out of the 17 products came to the category ‘I like it and do not like it, too’, which fall behind the required level: the flavoured milk product, the kefir, the nature yoghurt and the milk powder. The popularity of kefir and nature
yoghurt is low belike because of the acidulated taste. The one part of flavoured products – for example cocoa - can be made also at home a la gusto of the consumer. This can give explanation to the low popularity of the product available in trade. In some responders opinion is the cocoa available in shop not enough sweet.
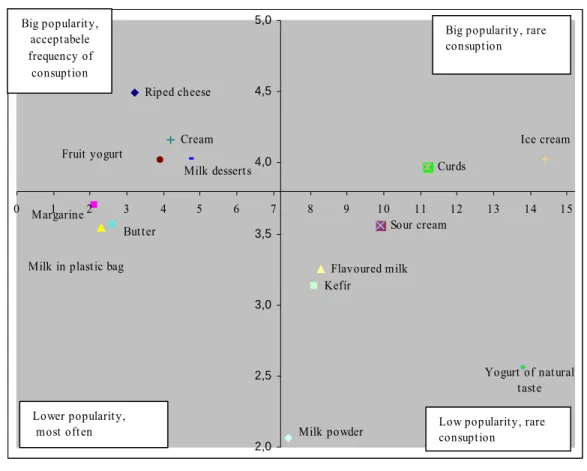
We get clearer picture (Figure 4) if we compare the frequency of consumption and the popularity of the products.
Riped cheese Cream Kefír Flavoured milk Sour cream Curds Margarine
Milk in plastic bag Butter Fruit yogurt Milk desserts Milk powder Yogurt of natural taste Ice cream 2,0 2,5 3,0 3,5 4,0 4,5 5,0 0 1 2 3 4 5 6 7 8 9 10 11 12 13 14 15 Big popularity, acceptabele frequency of consuption Lower popularity, most often
Big popularity, rare consuption
Low popularity, rare consuption
Figure 4: The consumption/popularity map of certain products according to frequency of consumption and rate of (n=987)
It can be found generally, that it can be considerable differences between the popularity and the effective consumption. The first group is characterised by large popularity and relatively frequent consumption. In the second group are
the most frequent consumed products (for example the butter and liquid milks), which are consumed per two days, but its popularity is not satisfactory. The
third and fourth group is very different from each other. To the former belong the products with big popularity, but rarely consumption (e.g. ice lollies), while the letter is represented by products with low popularity and low frequency of consumption (e.g. flavoured milk).
3.4. Change of the frequency of the consumption of milk, dairy products and margarine
It has been found the research that 48% of the population felt that certain changes have occurred in their consumption. Analyzing the data, the products can be divided into two groups. In the first group consumption has changed into a negative direction, i.e. the product was consumed more rarely. In the other group the consumption of the products was more frequent. Eight of the seventeen products have been consumed more rarely recently, and seven products –including margarine- have been consumed more often. Examining kefir and processed cheese I have found, that the rate difference between the more and less frequent consumers has not reached 5% thus I have not put them into either of the groups.
In Figure 5 those most important dairy products can be seen which are consumed more rarely. Thus recently the structure of consumption has changed into an unfavourable direction.
Figure 5: The changes in the frequency of consumption of certain dairy products given in percentage (n=480)
It can be seen in the figure, that the rate of the more and less rarely consumed dairy product is negative. This means that consumption in all has
-45,1 -49 -44 -33,6 -35,3 -44,1 -30,6 8,6 22,9 23 24,5 26,9 36,2 24,2 -36,5 -26,1 -21 -9,1 -8,4 -7,9 -6,4 -60 -50 -40 -30 -20 -10 0 10 20 30 40
50 Milkpowder Flavoured milk
Yogurt of
natural taste Curds Ice cream Milkin plastic bag Butter
Rarer consumption More frequent
decreased. This decrease and the increase (which was calculated whit the same method in Figure 6) are marked as the ‘difference’.
From Figure 5 it can be deducted that 49% of the consumers who consume flavoured dairy products have consumed the product quite or more rarely in the past five years. This value is above 40% in the case of unflavoured yoghurt, liquid milk in a plastic bag and milk powder. With other dairy products it changes between 30-35%.
In the case of unflavoured yoghurt a significant difference has been found in the income. In the frequency of consumption the change has not been outstanding with those who have higher income, while with people with lower income there has been a decrease in the frequency of consumption.
In the case of milk in a plastic bag the effective consumption frequency decrease was 7,9%. I have found significant differences while examining the qualification, region and income. Together with the higher qualification and income the number of those who have refused to consume the product in the past five years has grown.
The frequency of ice cream consumption has decreased according to the survey but considerable differences could only be noticed in particular segments. Notable decrease could not be detected with people with lower income but those earning 26.000-40.000 HUF the recession in the frequency of ice cream consumption is significant. The poorer segment most probably used to consume ice cream more rarely anyway. People with average or somewhat less than average income – as their income has changed only slightly – have reduced the consumption of the product as an answer to the unfavourable effects
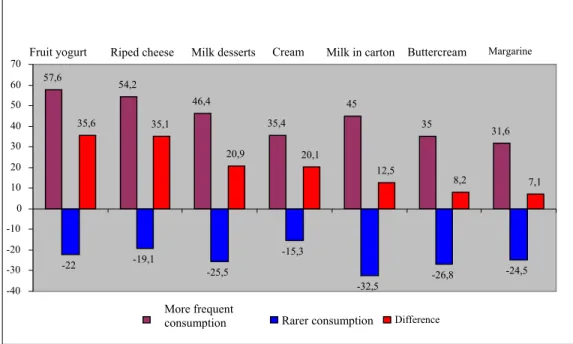
In figure 6 products of more frequent consumption can be seen. Whit these products the consumption structure has gone into a favourable direction, i.e. we consume them more often.
Figure 6: The changes in the frequency of consumption of certain dairy products given in percentage (n=428)
Analysing the data of Figure 6 it has turned out that the ‘winners’ of the changes in the past five years considering the frequency of consumption are fruit yoghurts and the ripened cheeses. These products have been consumed more often by 35% of the population. Similarly, more frequent consumption can be detected in the case of sour cream and milk desserts, the growth of which reaches 20%. It is harmony with the favourable tendency in the consumption of the product in the recent years.
At the milk carton examining the age we found signification. At the age-class 30-39 was the rate of rarely consumer 20,5%, at the elder then 60 year-olds 40,3%.
Also at the riped cheeses there is significant difference between the age-classes regarding to the change of consumption.
The reason of the decrease of frequency of consumption is not the low popularity, but rather the incoming status, where we found also significant difference. 57,6 54,2 46,4 35,4 45 35 31,6 -22 -19,1 -25,5 -15,3 -32,5 -26,8 -24,5 35,6 35,1 20,9 20,1 12,5 8,2 7,1 -40 -30 -20 -10 0 10 20 30 40 50 60
70 Fruit yogurt Riped cheese Milk desserts Cream Milk in carton Buttercream Margarine
More frequent
3.5. Consumption frequency of the milk and dairy products and of dairy products consumed in the course of different meals
We focused on the consumption frequency of the consumed diary products and the products consumed at the different meals - breakfast, lunch, supper. We considered important how the diary products are divided between meals or how often consumers consume them.
It can be stated that dairy products are consumed for breakfast most frequently (average per 1,5 days), any rarely (per 2 days) we eat they for supper . For lunch we eat only every 6th day milk products.
We finish demonstrating our consumption habits by showing the consumed dairy products for different meals. We considered important to ask consumers of what kind of products are consumed in the course of different meals. The question ran as follows: „Please, specify what kind of dairy products you consume most frequently.” There are two reasons for this question being highlighted. One is because some answerers named more than one product, so the sample volume is more than 1000. The other reason is that margarine and imitated dairy products were identified as dairy products (morning drink is mentioned 51 times, the fresh cream 6 times). The percentage division of the consumed dairy products for breakfast and lunch is demonstrated on Figure 7 and 8. 3,2 46,3 9,9 8,3 8,1 7,2 7,0 3,1 2,4 2,4 1,1 0 5 10 15 20 25 30 35 40 45 50 Do not consume Liquid milk Cheese Flavoured milk p roduct Butter M argarine Yogurt Butter cream M ilk dessert Kefir Curds
19,0 31,2 18,4 11,8 7,7 3,7 3,5 1,2 1,0 0 5 10 15 20 25 30 35
Do not cons ume Sour cream Curds Chees e Liquid milk Milk des s ert Yogurt Butter Kefir
Figure 8: Percentage distribution of products consumed for lunch (n=1150) The data of Figure 7 show that the most popular product is the liquid milk for breakfast. Very high proportion of the consumers (46,3%) said that they consumed this kind of dairy product most frequently for breakfast. The answerers did not distinguish the milk carton from the milk in plastic bag, so this number means the different milks together.
The second frequently mentioned product which is consumed for breakfast is the cheese with a share only of ca. 10%. If we take into consideration that cheese is not affordable for an „average Hungarian citizen” then this value cannot be considered low.
The proportion of the non-consumers is really favourable, only 3,2%, which means that most inhabitants consume some kind of dairy products for breakfast.
The most important dairy products, which are consumed for lunch, are shown on Figure 8. The most important difference is that the rate of the non-consumers is higher (19%) than in case of those non-consumers who consume dairy products for breakfast. On the other hand less products are mentioned due to the determined 1% limit. Sour cream (31,2%) and curds (18,4%) are consumed most often for lunch according to the results of the survey. It may be caused by different kind of Hungarian dishes or dairy products for different milk origin.
Milk desserts and yogurts can appear as an additional product to the main meal but the titbit eaters and gourmets play a role, too.
3.6. Examination of buying habits
In the second part of my research I asked the responders about their buying habits. Namely next the cognition of consumption habits I was curious, how change the buying inclination of inhabitants.
3 4 4 4 5 6 7 8 8 8 9 10 12 12 14 18 43 0 5 10 15 20 25 30 35 40 45 50 M il k i n pl as ti c bag F rui t y ogur t M ilk in c a rt o n C ream M ilk d e s s e rt s R iped c hees e K e fír M a rgar in e B u tte r F lav our ed m il k P roc es s ed c hees e B u tte rc re a m Y ogur t of nat ur al t a s te Cu rd s Ic e c ream S our c ream M il k pow der
Figure 9: Per how many days we buy the certain dairy products and the margarine? (n=1000)
From the Figure we can make the following more important statements. Most often we buy liquid milk in bag, average every third day. This follow the fruit yoghurts, the milk cartons and sour cream with four days frequency. We buy minimum once a week the milk desserts, riped cheeses and kefir. The buying frequency of the butter and margarine is the same, average every 8th day. I think also this backs up my hypotheses, that they can not difference the two very dissimilar products like butter and margarine.
From the figure 9 we can also find out, that we buy most rarely milk powder, every 43rd day.
If we compare these values with the consumption frequency of the products, the data confirm each other. The products whit short warrant we consume on the day or latest on the other day of buying.
The next question of my survey concerned the quantity of bought products on occasion of buying.
It could be found out that the average consumer buy around the same quantity from milk in bag and milk carton, i.e. 1 liter. From flavoured milk we take half liter into our basket. In the case of kefir and nature yoghurt is bought one glass. Whereas both products have very advantageous physiological effect it is not advisable particularly in case of kefir. But regarding the popularity of these products we could not expect higher value. Both the fruit yoghurt and sour cream are beloved products by the inhabitants, which is backed up by their consumption frequency. During our buying we take average 2 glasses from this into our basket. We buy from riped cheeses occasionally 30 dkg.
3.6.1. Influential factors of choice of dairy products
During my survey the answerers had to mark on an five-graded scale, how much they are influenced by the difference aspects at the choice of dairy products. I found important to examine, by what product characteristics and/or external und internal impression the buyer makes decision, when he take a product in his basket.
On Figure 10 I demonstrate the influential factors in decreasing order. I complete my results with certain more important statements of the background variables. 4,5 4,4 4,3 3,9 3,8 3,6 3,5 3,2 3,0 2,9 2,9 2,4 2,3 0 1 2 3 4 5 F lav our of pr oduc t C ons tant qual ity M edi c a l as pec t P ric e of pr oduc t A s pec t v iew of pr oduc t H abi tuat io n A ll fa m ily c a re C u rr enc y of pr odu c t P a c k agi ng of pr oduc t M indenhol k aphat ó M a rk of pr oduc t M anuf ac tu re r f irm P rom ot ion of pr oduc t
Figure 10: Order of the factors which influence the choice of dairy products in average of opinions of answerers (n=1000)
From the results can be found, that the most important influential factor for the responders is the flavour (on five-grade scale 4,5) and quality (4,4) of products. The buyer chooses firstly the product, which has good taste and is characterised by constant good quality. In the order follow the healthiness (4,3) and the price (3,9) of product. For the buyers are more important the factors belong to quality than to price. This means, that the healthy nutrition becomes for the inhabitants more and more important factor.
It is regrettable at the same time, that the function of the image factors influence the buying (name of manufacturer, advertising, trade name) is the lowest.
In the middle of the order stand the subjective attributions as the looking of the product (3,8), if the family like it (3,5), or the packaging (3,0). If we could enhance the image of the dairy products, would change the consumption positive, too.
3.7. The segmentation of milk consumers by factor and cluster analysis For planning a more effective marketing strategy in the milk sector, it was found to be important to segment the consumers asked on another way, too. The traditional segmentation methods (age, sex, qualification etc.) give in many cases not to the demands of the modern age proper results (TÖRŐCSIK, 2003). I carried out the segmentation of consumers with factor and cluster analysis. With this we can to class the responders not only by consumption, but psychological characteristics.
Based on the selected 25 variables 6 very different factors were created. After the cluster analysis of the 6 factors, finally four clusters were created, with
938 censurers. These 938 consumers gave 100 percent, leaving out those who
did not belong to any clusters.
“Consumers with traditional thinking” is considered as “Group A”. 28,3% of the participants in the questioner belong to this group, most of them are women and older people. (over 60 years of age). This group could be described as average income families, with average education from villages and small towns. On a daily base this group consume the most from the milk in bag (33,9%). The consumption of curd and sour cream of “Group A” is somewhat higher than the consumption of these products by the other groups. On the other hand their consumption of cheese, milk powder, ice lolly and milk dessert is the lowest among all the other groups. The member of “Group A” prefer milk in bag, kefir and sour cream over the average of the other groups. During the last couple of years the regularity of other consumption habit could be considered the most stable.
“Group B” is the group with “consumers who are sensitive to the price” of the products. Mostly single or divorced, young or middle age males with smoking habits from the lower income segment of society. This group does not emphasize healthy eating habits as well. In this group prices of the products are the most important and they are the most likely to buy products on sale not showing any consistent preference fro any brand names. They consume almost equal amount from milk in bag and milk carton. Their consumption of cheese is lower than the average. The consumption of milk powder is the lower in this group. In regards of the quantity of the milk consumption, it shows similarity to
The third, “Group C” could be described as the “segment of society with low social-economist status”. Only 7% of the participants in the survey belonged to this group. Most of them are divorced and unemployment rate is the highest in this group (68,1%). Their undesirable place in society reflects their consumer habits. The selection of milk products is highly influenced by the packaging and advertisement of items. According to 32,7% of the participants in this group do not think that there is any relation between healthy eating and the amount of milk they consume. They strongly believe that the bacterial culture in yoghurt is not healthy for human consumption. The members of this group do not like kefir, curd and sour cream, prefer to buy milk 1 or 2 times a week mostly half a liter packaging.
32,1% of the participants in the questioner belong to “Group D”. This group could be described as a “people open for new concepts, and people with progressive thinking”. Most often they are women from younger (16-25 years old) and older age (40-59 Years old) category. Their income is above average mostly from Budapest or from cities. 16,2% of them are with university degrees. For this group the most important is the continuous quality of the products and the least important the price of the products. 67,3% of them think: Milk consumption will enhance the quality of health. The members of this group are open to try any new products and we could conclude that this is exceptional among the other groups. More than 70% of them consume fruit yogurt. Their consumption of nature yoghurt , riped cheese, ice lolly, milk dessert, cream and butter is higher than any of the other groups.
4.
CONCLUSIONS, SUGGESTIONS
The processing of the secondary data and evaluation of primary data results the following conclusions and suggestions. The conclusions can be applied on the one hand to cognise deeper the consumption and buying habits of domestic dairy products, helped to plan the marketing strategic of dairy companies.
1) During my work I examined, what kind of effect have the factors influential the food consumption on the construction of dairy product consumption. I found out, that the globalisation more and more appear in Europe and in the developed region of the world, the nutrition becomes homogeneous, at the same time the traditional differences between the countries influence the nutrition often stronger, than the economic stand of the country.
2) During the comparative statistical analyse of the price of dairy products and margarine I found out , that the price of margarine increased between 1989 and 2002 only 5,9-fold, in the case of physiological advantageous butter the price increase exceeded the 11-fold.
3) The results of my dissertation show regarding the domestic dairy product prices, that in the conscience of big part of consumers the milk and dairy products are still such basis foods that should be aided by the state, therefore everybody can they buy.
4) The dairy companies must achieve with more intensive marketing work and means of market segmentation the increase of domestic consumption of dairy products. They have to do this so, that in the following 2-3 years can not be expected considerable increase of measure of domestic market. Regarding the domestic consumption can be expected rather restructuring towards higher processed products.
5) The buyers would like to get during their buying the possible best quality at the possible favouring price. In a long time will be those products competitive, which have excellent quality, particularly in the globalised European markets.
6) The big part of the population is not aware of differences between the butter and margarine. The big part of the consumers consumes margarine in the belief that he consumes of milk origin product. It is right similarly in the
7) We can be witness of change of consumption habits more and more. The demand increases for the products in smaller packaging because of the economization, at one part of buyers come more and more higher processed products in the centre of buying, the demand increases for the commercial brands, too. Parallel with this becomes the enviromentconsciousness more and more determining.
8) In the consumption of some dairy products can be experienced considerable decrease in the last time because of the change of nutrition habits, so at the milk powder and cream. The milk imitations as the breakfast beverages, “frissföl”, “cream” from vegetable oil deceive the buyers in great measure. These products appear in the market as substitutive products, influenced the consumption frequency of the true dairy products.
9) In case of some dairy products can be observed great differences in consumption frequencies and quantities regarding mainly the sexes, age and qualification. For example the younger generation likes expressly the flavoured milk products, while the elders not yet. If the marketing experts size up these differences, they can cognise better the consumer groups, and thereby increase the consumption.
10)In case of many milk products is high the rate of non consumers. If we could these consumer groups with marketing work, advertisement, enlightenment actuate to consume, would increase the frequency and quantity of consumption of dairy products.
On the grounds of the results of my research could be outlined the marketing strategic elements, which can offer effective means to the increase of market sharing of dairy products. They are the followings:
The possible implements of product- and price strategic
The domestic dairy industry has the basic role to increase the consumption frequency of the different milk products. The prices of the dairy products in the near future prospectively rather increase, therefore the increase of the real income can give a basic to the advance of the consumption frequency. Some consumer groups are ready to pay more, if their additional outgoing appears in the attribution of the product. In this aspect is the first the healthcare function. The survey shows, that the name of producer and the brad name do not influence the buyer’s attitude. It was also found, that the effect on the health of the product is an important factor at the buying. The companies can connect therefore their brand strategy with the healthy of milk product, so they can make materially better the consumption level and also the acceptance of brands with the intensification of the health consciousness.
The possible implements of distribution strategic
It was found, that from the distribution channels of dairy products have the hipermarkets and the bigger groceries prominent importance. In these can be found the dairy products in deep and wide choice. Parallel with this the smaller groceries and „ABC”-s have importnat role –mainly in the country.
The possible implements of marketing communication
The careful planning of the integrated communication can be a key factor in the increase of the consumption frequency of the milk products. Actually means the biggest care, that the consumers do not know the nutrition biological advantage of the dairy products. It is the bigger problem that they are not clear also about that, which products are really from milk and which are only milk imitate. In this situation is the most important communication task the objective information and training. It can be also important, that not products, but life style shall be advertised so, that it shall be realized already in youth: It is a good thing to consume milk and dairy products, and this is a model to be followed for everybody!
Finailly it can be stated that in case of some product groups the consumption frequency increased, while in case of others it decreased. In the structure of dairy product consumption a change can be foreseen.
5.
NEW SCIENTIFIC RESULTS
1. On secondary data based comparative examination, during it were presented samenesses and differences between the domestic milk and dairy product consumption tendencies.
2. The detailed examination and evaluation of the quality and frequency of the national buying and consuming milk and dairy products (total and
occasional), moreover analysing the structural characteristics of
consumption (and purchase) by general and basic variables, according to an own primary data collection.
3. Separation of buyer and consumer segments characterised by product market with application of factor and cluster analysis, hereby working out of the basis of a differentiated marketing strategy is guided by the demand of the certain segments.
6.
PUBLICATIONS
1. Berke Sz., Pósa O., Huszka P., Szakály Z.: Az élelmiszer-kiskereskedelem
helyzete Magyarországon nemzetközi összehasonlításban I. Élelmiszermarketing-tudomány 1 (3) 11-24 (2000)
2. Pósa O., Berke Sz., Huszka P., Szakály Z.: A Marketingcsatorna elemei
kecsketej-alapú termékek esetében. XXVIII. Óvári Tudományos Napok - Az élelmiszergazdaság fejlesztésének lehetőségei, Nyugat-Magyarországi Egyetem, Mezőgazdaságtudományi Kar, Mosonmagyaróvár, 101-106 2000 3. Berke Sz., Szilvási M., Huszka P., Szakály Z.: Marketing gyakorlat a
funkcionális élelmiszerek piacán. XXVIII. Óvári Tudományos Napok - Az élelmiszergazdaság fejlesztésének lehetőségei, Nyugat-Magyarországi Egyetem, Mezőgazdaságtudományi Kar, Mosonmagyaróvár, 152-157 2000 4. Pósa O., Szilvási M., Huszka P., Szakály Z.: Kvalitatív piackutatás a
kecsketej-termékek fogyasztói preferenciáinak elemzésére. XXVIII. Óvári Tudományos Napok - Az élelmiszergazdaság fejlesztésének lehetőségei, Nyugat-Magyarországi Egyetem, Mezőgazdaságtudományi Kar, Mosonmagyaróvár, 200-205 2000
5. Huszka P.: Magyarország tejelő állatállományának és a tehénállomány
laktációs hozamainak alakulása. Előadás, XXIX: Óvári Tudományos Napok Mosonmagyaróvár, 2002, 46
6. Szakály Z., Tápler H., Huszka P., Berke Sz.: Sajtfogyasztási szokások,
preferenciák és attitűdök vizsgálata primer piackutatás alkalmazásával II. Tejgazdaság, 62 (1) 40-49 (2002)
7. Huszka P., Polereczki Zs.: Analysis of the consumption frequency of dairy
produts in Hungary. Acta Agraria Kaposváriensis, (1) 2005
8. Huszka P., Polereczki Zs.: The consumption frequency of consumed dairy.
Acta Agraria Kaposváriensis, (2) 2005 (under edition)
9. Huszka P.: Faktor-és klaszterelemzés a hazai tejtermékpiacon Élelmiszer,
táplálkozás, marketing. 2 (1-2) 39-44 2005
10.Huszka P., Polereczki Zs., Szakály Z.: A tej és tejtermékek, valamint a
margarin vásárlási gyakoriságának vizsgálata Magyarországon. Tejgazdaság, 65 (1) 8-14 (2005)