Human Mobility Patterns for Different Regions in Myanmar
Based on CDRs Data
Kyaing
1,*, KoKo Lwin
2, Yoshihide Sekimoto
31
Lecturer, Department of Civil Engineering, Yangon Technological University
Insein Road, Gyogone, Insein 11011, Yangon, Myanmar
2
Project Assistant Professor, Institute of Industrial Science, The University of Tokyo
3
Associate Professor, Institute of Industrial Science, The University of Tokyo
*Corresponding author: [email protected]
AbstractSustainable urban and transportation planning depends greatly on understanding human mobility
patterns in urban area. Myanmar is one of the developing countries in ASEAN. It develops more rapidly as compare past years due to its international trade policy change and faces serious traffic problem in major cities. To solve these problem, human mobility pattern need to know for improvement. Therefore, this paper focuses to analyze different human mobility patterns for the different regions in Myanmar by using Call Detail Records (CDRs) Data. Such studies could be useful for creating transport model of mobility pattern. The numbers of trip generated are obtained by using CDRs over seven days period. CDRs of each region can be used to generate trip numbers of townships within certain time frame and time windows. In this study, average distance travelled, preferred days of long distance users and human mobility patterns at different times of weekdays and weekends in Yangon and Mandalay were analyzed. People living in Yangon area are generally more travelled than Mandalay on weekdays and weekends. The results indicated the similarities and differences in mobility patterns for both cities. This information is very useful for transport planning and future transportation developments.
KeywordsOrigin and destination matrix , Daily Range, Transport Planning I.INTRODUCTION1
M
yanmar is one of the memberships of ASEAN countries. The government began to launch the market oriented economy after 1988 and practice trade opportunity which attention to encourage international trade investment. Therefore, industry zones were developed in major cities of Myanmar. Many people were migrated from rural to these developing major cities for their employment opportunity, education and better life. As a result of it, these major cities are more crowded and it is need to provide systematic transportation planning which is essential to know behaviors of people movement pattern. Therefore, this paper concentrated to analyze different human mobility patterns for the different regions in Myanmar by using Call Detail Records (CDRs) Data. Understanding human mobility pattern will support a lot to transportation planning and management. For example, evaluating people movement can know which townships or cities are the most attracted or produced in weekday and weekend, and what the typical distance and which day of the week is the most preferable for long distance travel.In order to evaluate the people movement pattern, base data are essential. In traditional way, base data are collected through questionnaires survey that are expensive and take long time and also need to update these data. The census data is also hard to obtain as the first census data was collected in 1973 and the second
time was collected in 1983. After 30 years, the third census data was collected in 2014. Mobile phones are becoming pervasive in both developed and developing countries and they can be a precious source of data and information, with a significant impact on research in behavioral science. Mobile phone usage data on the other hand can apply as the base data for transportation analysis due to its enormous quantity of data source, cheap, wide coverage, real-time production and automated data collection. It is possible to use CDRs data as a data source because mobile phone usage is increased in these days all over the world. CDRs data contained unique caller id (anonymized), the time and date of the call, the duration of the call, latitude and longitude of the Base Transceiver Station (BTS). Therefore, people location can be traced through CDRs data in evaluating people movement pattern. However, in the CDR data, a mobile user’s location information is lost when he/she does not make any phone call but still retain a large portion of the actual origin and destination (O-Ds).
A. Related Works
The research community has been increasingly using cellular network data to study in various fields such as human mobility, urban planning, mobility modeling, social relation inference, and healthcare.
Isaacman et al. [9] compare the moving patterns of two major cities in United State: Los Angeles and New York. Using the concept of a daily range of travel, the author had shown concrete differences between the mobility of two cities.
Liu, Biderman, and Ratti [11] analyzed real time urban mobility dynamics in Shenzhen, China. In this
study, GPS data from 5,000 taxis and data from 5 million smart cards from buses and subway were used for evaluation. Human mobility patterns are very useful for improvement of transportation system in rural and urban environments.
Moreover, N. Diala et al. [14] analyzed Call Detail Records (CDR) made available within the context of the Orange D4D Challenge, focusing on calls of individuals in the city of Abidjan over a period of five months and also consider local mobility flow on each commune of Abidjan. These results illustrate how aggregated CDR data can be used for typical and special mobility behaviors, and how macroscopic mobility flows extracted from these cellular network data for the daily dynamics of a highly populated city.
Kuldeep Yadav et al. [19] presented mobility patterns of people in developing countries and developed country by using CDRs data and GSM/WiFi/GPS traces collected from mobile phones. The author also analyzed the movement as well as place visiting patterns, and compare with existing studies. Later, the author shows the regular visited places and infrequent visited places.
Gonz´alez, Hidalgo and Barab´asi [6] used cellular network operational records from an unnamed European country to form statistical models of how individuals move. Their study focused on 100,000 users who made at least one call per day over a 6-month period from the 6 million phone users in their data set.
Previous research, Alberto Rubio et al. [1] described an initial study focused on understanding the similarities and differences in mobility patterns across countries with different economic levels. They characterize mobility in terms of average distance traveled, area of influence of each individual, and geographic sparsely of the social network. This study indicates that there are statistically significant differences in human mobility across countries with different economic levels.
Our study is to find the significant difference in human mobility across cities with different geographical nature and available transportation system. Our research is also focusing on the different range in travel distance of human mobility pattern and different behavior large populations between two cities.
B. General Application
In urban transport planning, where knowing how people come and go can help determine where to deploy infrastructure such as public transit stations, improvement of public transit systems and how to reduce traffic congestion [1].
CDRs are used for understandings which are the most busy areas and times during the day, to predict the movements of the people and promote a better transportation service [3].
In mobile data are used for monitoring in real-time the traffic conditions and pedestrian distribution [4].
It enables us to understand how many people are going in which direction at what time. It can improve disaster management and emergency preparedness by estimating the location of vulnerable people against disasters at the occurrence of disastrous events [2]. Therefore, transport planner can manage which route is suitable for detoured person to go back to their home.
Overlaying human mobility pattern from CDR Data with secondary information such as land use and road networks, it can also contribute to further development of city planning and improvement of public transportation network.
The CDRs and big data analysis has also been used in the area of health management. Frias-Martinez et al. (2011) used the CDR data to monitor the public response to government health warnings during Mexico’s swine-flu epidemic in 2009 and showed that by using an agent-based system to model the virus spreading, the peak number of individuals infected by the virus could be reduced by 10%, if government mandates would impose restricted mobility [17].
The network operators could also benefit from the use of big data analysis by understanding their subscribers churn. Han and Ferreira (2013) [7] made use of the CDRs for the tariff plans.
The use of CDRs could also help in terms of localization and mobility patterns. Motahari et al. (2012) [13] showed that by considering the impact of temporal factors on mobility patterns, the accuracy of the prediction mechanisms could go up by 15%. Whereas, Isaacman et al. (2011)[9] showed that by using temporally sparse and spatially coarse location information from CDRs, the users’ key locations can be identified with median errors under one mile.
All these studies have shown that understanding the humans’ mobility patterns could be a crucial component in several areas, such as: network resources optimization, urban environment planning, transportation planning and management, event management, modeling commuting flows, health management, and benefits for mobile network operators etc.
The structure of this paper is organized as follows. Section II describes the data followed by the methodology used for development of the O-D matrix and different characteristics of travel distance in both cities. In Section III, different behaviors of people movement in different cities were discussed. Finally, conclusion and future work are presented in Section IV.
II.METHOD A. Study Area
There are 330 townships in Myanmar (2014 census data). Yangon is the heart of commercial center of lower Myanmar. It is the main trading hub for all kinds of merchandise. Yangon is the main domestic, principal seaport and international hub for air, rail, and ground transportation. Yangon has an area of 598.750 square kilometer with a population of 5.211 million in 33 Townships of urban area. The population of Yangon urban area lives 10.121% of total population of Myanmar. The number of registered vehicles in Yangon City is increased from 162,512 in 2004 to 691,456 in 2014. There are about 50% model shares of bus transportation and it is a major urban transportation.
Mandalay is the second largest city of Myanmar which is regarded as the main commercial and economic hub in the northern region as well as a tourist destination. It is likely to play an important role as the main secondary commercial city in the country with its
distinctive character and economy. Mandalay International Airport, a gleaming modern facility, serves the area with flights to most places in Myanmar and some international flights. Mandalay has an area of 114.189 square kilometer with a population of 1.319 million in 5 Townships of urban area and 2.562% of total population. In 2004, 146,247 vehicles are registered and then 760,464 vehicles are increased within 10 years. In Mandalay, motorcycle is major mode of transportation and it is about 86% of registered vehicles.
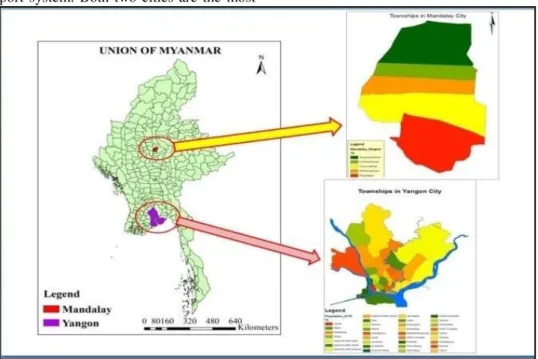
These two cities are different geological nature and available transport system. Both two cities are the most
crowded and most urbanized location. Therefore, the profession is facing enduring challenges such as traffic congestion, pollution, creating over travel time and safety. Moreover, only these two cities have public transportation system in Myanmar so traffic planners can reconstruct and manage the demand for the living people in both cities. Therefore, Yangon and Mandalay were selected as a case study.
The location of the study areas based on townships is shown in Figure 1.
Figure 1.Location of the study area Yangon has an area of 598.750 square kilometer with
a population of 5.211 million in 33 Townships of urban area. The population of Yangon urban area lives 10.121% of total population of Myanmar. Yangon is not only former capital city but also commercial city and Mandalay is a second largest commercial city and the last royal capital of Myanmar. Mandalay has an area of 114.189 square kilometer with a population of 1.319 million in 5 Townships of urban area and 2.562% of total population. Yangon population is four times higher than Mandalay and over five times larger in area. Yangon is the heart of commercial center of Lower Myanmar and Mandalay is the economic centre of Upper Myanmar. These two cities are different geological nature and available transport system that is Yangon mainly use public bus transport, private car, taxi and train but Mandalay major transport is motor cycle, bicycle and public bus transport is only a minor.
B. Data to be used in Study
In this analysis, two types of secondary datasets: CDRs (Call Detail Records) Data and Socio-economic Data will be used.
CDRs data was collected from Myanmar Post and Telecommunications (MPT) which is one of the biggest mobile operators.The CDR data set contains cell phone calls and SMS during a period of seven days. In this study, 1th December 2015 to 7th December 2015 data will
be used to analyze human mobility patterns. Both phone calls and SMS data were used for O-D Matrices generating.CDRs data contained unique caller id (anonymized), the time and date of the call, the duration of the call and latitude and longitude of the Base Transceiver Station (BTS).
Socio-economic data were used to identify user impact of human mobility pattern and was collected from Ministry of General Administration Department, and Ministry of National Planning and Economic Development (2014 Census data).
C. Method of Analysis
In this study, Call Detail Records (CDRs) data was used for analysis of human mobility pattern. Call Detail Records (CDRs) data which are generated whenever a cell phone connected to the network makes or receives a phone call or uses a service.
The discussion of human mobility patterns, typically and long distance travel for Yangon and Mandalay are presented in this study. To analyze the CDRs data, it is need to consider the data cleaning and filtering for the first time. The regions of the two cities which are Yangon and Mandalay were filtered. The only required columns unique caller id (anonymized), the time and date of the call, latitude and longitude of the Base Transceiver Station (BTS) are also filtered from CDRs data set.
CDRs for individual users were divided into weekday and weekend data set. Weekday set consisted of all activity from Monday to Friday, and the weekend set consisted of all activity from Saturday to Sunday. (1) Behavior of Human Mobility Pattern
CDRs of each region can be used to generate trip numbers of townships within certain time frame and time windows. This study presents the behavior of human mobility patterns of different city with the time frame of 7:00 A.M to 10:00 A.M and 4:00 P.M to 7:00 P.M for the average of weekdays and weekends. Human mobility flows are shown by constructing Origin-Destination (O-D) matrices. Every element of O-D matrix shows the number of trips with a starting point of origin and arriving point of destination during 3 hours interval of time window that is defined as trip. O-D matrix represents the mobility flows between the limited time frame and it is a square matrix of townships for the selected cities. Every row and column of the matrix states that the production and attraction of the human mobility flows between townships.
(2) Daily Range of Travel
The aggregate movement patterns were analyzed based on the distance of three datasets and these data includes typical, long distance travelled by users and the preferred days of long distance users. The daily ranges represent the distance travelled by a person between origin and destination points. The daily range of phone users were computed by calculating the distance between all pairs of origin and destination point contacted by the phone on a given day in road network of each city.
Average daily range for a user means the most frequent travel distance. Long distance travelled is defined as the travel for more than 75th percentile of a user in daily range. Long distance travel also known as maximum daily range.
Different time frame and time window were used to analyze the daily range due to different travel characteristics and geographical conditions of the selected study areas, Yangon and Mandalay. In Yangon, time frame is 7:00 A.M to 9:00 P.M and time window is 3 hours, and then time frame is 7:00 A.M to 7:00 P.M and time window is 1hour for Mandalay. It is not assumed as a trip that it is travelled by a distance which is less than 1.5 km for both cities.
III.RESULTS AND DISCUSSION
In this study, the behavior of human mobility pattern and daily range of travel in Yangon and Mandalay are analyzed based on the Call Detail Records. The information obtained span over 7 days, from December 1st, 2015 until December 7th, 2015.
A. Behavior of Human Mobility Pattern
In this research, the trip production and attraction in weekdays and weekends were analyzed for morning and evening peak. The morning peak period was taken from 7:00 A.M to 10:00 A.M while the evening peak hour is taken from 4:00 P.M to 7:00 P.M. By comparing the human mobility pattern of Yangon and Mandalay, the traffic flow pattern and the nature of both cities can be known.
Figure 2(a). Trip production of weekdays in morning peak at Yangon
Figure 2(b). Trip production of weekdays in evening peak at Yangon
Figure 2(a) and 2(b) show the trip production of Yangon in weekdays during morning and evening peak hours. In the morning peak hour, people from the suburb areas come to the urban regions for their work and therefore the trip production of suburban in morning peak is higher than the urban region. But in the evening peak hour, the trip production from urban area is higher than from suburban areas. In Yangon, the intraregional trips within the township are neglected because the number of trips from one township to one township needed to be considered. In this figure, the dark colour shows the highest trip production.
Figure 2(c) and 2(d) present the attraction for each township in Yangon during morning peak and evening peak of weekdays. In these evening peak hour, people from their work and schools return to their home and therefore their home become attraction places. The difference in travel pattern of Yangon can be clearly seen in Figure 2(c) and 2(d). From the above figures shown, it can be seen that Mayangon Township has the most trip production and attraction rate as it has many offices, markets, shopping centres, schools, religious places and this township is located in good connection with major arterial roads such as Pyay Road, Kabaraye Road and Insein Road.
Figure 2(c). Trip attraction of weekdays in morning peak at Yangon
Figure 2(d). Trip attraction of weekdays in evening peak at Yangon
Figure 3(a). Trip production of weekends in morning peak at Yangon
Figure 3(b). Trip production of weekends in evening peak at Yangon
Figure 3(a) and 3(b) show the trip production of Yangon in weekends during the morning and evening peak hours. In Yangon region, most of the private companies do not close on Saturday and some employees need to go for their work and therefore, the traffic pattern for weekends seem to be not so different with the
weekdays' pattern except traffic attraction pattern in the evening peak.
Figure 4 and 5 show the human mobility pattern of Mandalay in weekdays and weekends. There are five townships of urban area in Mandalay and trip production and attraction of Mandalay can be clearly seen in these figures.
Figure 4(a). Trip production of weekdays in morning peak at Mandalay
Figure 4(b). Trip production of weekdays in evening peak at Mandalay Figure 3(c). Trip attraction of weekend in
morning peak at Yangon
Figure 3(d). Trip attraction of weekend in evening peak at Yangon
Figure 4 shows the trip production and attraction of Mandalay in weekdays during the morning and evening peak hours. From the above figures, it can be seen that Mahaaungmyay Township have the highest trip production because the people from their home go to work places and schools, and Chanayethazan Township has the highest trip attraction in the morning. Chanayethazan Township has many trip attraction places such as schools, university, offices, trading centres, markets, hotels, hospital, railway station, and religious places. By using the CDR data, the trip pattern of the
Mandalay in weekdays have the similar traffic pattern of production and attraction in the evening. Figure 4(b) and (d) stated that Chanayethazan Township has the highest trip production and also trip attraction because of many trip attraction places. There are many intraregional trips at Pyigyitagon Township which is the industrial zone. From these figures, it can be clearly seen the land use is mixed land use pattern in Mandalay. As in Yangon, the intraregional trips are also neglected and only the trip from one township to another is considered.
Figure 4(c). Trip attraction of weekdays in morning peak at Mandalay
Figure 4(d). Trip attraction of weekdays in evening peak at Mandalay
Figure 5(a). Trip production of weekends in morning peak at Mandalay
Figure 5(b). Trip production of weekends in evening peak at Mandalay
Figure 5 shows the human mobility pattern of Mandalay for weekends. Also in Mandalay, the travel behavior of people is similar for weekdays and weekends in mobility pattern. As Mandalay has mixed land use pattern, most people travel within their township and the vicinity townships. By using CDR Data, the travel pattern of each township can analyze and it can also compare among the townships.
B. Daily Range of Travel
The major cities of Yangon and Mandalay which lives in people are traveled with many different patterns and are presented a daily range condition. Daily range of people movement was computed between any two cell towers that a phone contacts in one day. Aggregated movement patterns were analyzed in terms of distance including typical and, long distance travelled by user and preferred days of long distance travel. Average of a phone’s daily range values over the duration of a dataset
is an approximation of the most typical daily distance traveled by the phone users. Similarly, long distance is taken as the maximum travel, which is more than 75th percentile of a user daily range across a dataset during that time.
(1) Average Daily Range
People living in Yangon area are generally more travelled than Mandalay. Specifically, the average daily range in Yangon is 4.576 kilometer for weekdays and 4.640 kilometer for weekends and 3.447 kilometer and 3.483 kilometers in Mandalay. This difference is that Yangon is wide range area and higher population than Mandalay. Also, average daily range of weekends is slightly higher than weekdays for both cities.
Percentiles of average and maximum daily range were computed for weekdays (WD) and weekends (WE) data set of Yangon and Mandalay as shown in Table 1.
Table 1. Percentile values of daily ranges across all participants and days for Yangon and Mandalay
Datasets Percentile
Yangon Mandalay
WD – Avg. WE – Avg. WD - Max WE - Max WD – Avg. WE – Avg. WD - Max WE - Max
25 2.120 2.130 6.600 6.750 1.950 1.970 4.790 5.220
50 3.190 3.190 8.250 8.480 2.770 2.800 5.770 6.210
75 5.530 5.610 11.180 11.560 4.380 4.480 7.550 8.060
95 12.120 12.520 18.550 19.300 8.610 8.700 11.760 13.270
In comparison of Yangon and Mandalay area, 25th, 50th, 75th and 95th percentile of average daily range in weekends are higher than that of weekdays because people use their holiday as a recreation. In Yangon, 50th percentile will be nearly same and 75th percentile in weekday decrease 1% than weekends and 95th percentile also decrease 3% than weekend. In Mandalay, 50th
percentile and 95th percentile of average daily tends to be lower 1% in weekdays than weekends. It is also 2% decrease at 75th percentile.
Figure 5(a). Trip production of weekends in morning peak at Mandalay
Figure 5(b). Trip production of weekends in evening peak at Mandalay
(2) Long Distance Travel
This study also analyzed to find out how many people are more likely to do long distance travel in which day of
the week. The following figure shows the long distance user and distance travelled in Yangon and Mandalay.
Figure 6. Long distance user for Yangon and Mandalay
Wednesday is the highest users for long distance in both cities as shown in Figure 6. It can be seen that long distance users travelled in weekdays for their business work.
IV. CONCLUSION
This paper presented comparative study of human mobility patterns for two major cities in Myanmar by using seven days period of Call Detail Records (CDRs) Data. This study focus on analyzing trip generated flow patterns and daily range of people movement in Yangon and Mandalay.
In Yangon, the traffic patterns for weekends seem to be not so different with the weekdays' pattern except traffic attraction pattern in the evening peak. The production is more significant in suburban while urban area is more significant in attraction.
In Mandalay, commercial area attracts more trips to this area while residential area generated more trips to other townships. More intra zonal trips are occurred in industrial area of Mandalay. The travel behavior of people is similar for weekdays and weekends in mobility pattern.
This analysis showed that people living in Yangon travel farther distance as compared to people living in Mandalay area for both weekends and weekdays. The reason is the urbanization and advanced public transport system in Yangon is more significant than in Mandalay. Average daily range of distance travel in weekends is higher than in weekdays for both cities. Numbers of people in both cities who travel long distance were higher in weekdays than in weekends. People in both Yangon and Mandalay travel longer distance on Wednesday.
As per similarly in mobility pattern, the traffic control system such as signal timing can manage and implement comfortably with fixed time control system. Traffic demand management can use uniformly at different time
and intervals according to the similarity patterns. The mitigation of major arterial road network will also improve and will be remedied for the congestion by using different patterns of human mobility. This is the major priority and benefits for the transportation analysis and traffic planner.
All these studies have shown that understanding the humans’ mobility patterns could be a crucial component in several areas, such as: network resources optimization, urban environment planning, transportation planning and management, event management, modeling commuting flows, health management, and benefits for mobile network operators etc.
In this paper, the base data usage is only CDRs data and the O-D Matrices generated is not magnified by magnification factors. Therefore, the validation will be carried out to prove the accuracy of CDRs usage by ground truth survey in future. These CDRs can be widely used in transportation field that will help to analyze the travel behavior in urban transport planning and management.
V. ACKNOWLEDGEMENT
The authors would like to express their appreciation to Myanmar Post and Telecommunications (MPT), Remote Sensing Department from Mandalay Technological University, and Science and Technology Research Partnership for Sustainable Development (SATREPS) Project for data provided of this research. Special thanks are also dedicated to all Professors for their support, suggestions, invaluable and contributions throughout for this research.
VI. REFERENCES
[1] A Rubio,VanessaFrias-Martinez, Enrique Frias-M Martinez, N.Oliva, “Human mobility in advanced and
0% 2% 4% 6% 8% 10%
Monday Tuesday Wednesday Thursday Friday Saturday Sunday
% o f u ser f o r lo n g d ist a n ce
Days of the week
developing economies: A comparative analysis,” in Madrid, Spain, 2010.
[2] Ayumi Arai and Ryosuke Shibasaki Estimation of Human Mobility Patterns and Attributes Analyzing Anonymized Mobile Phone CDR: Developing Real-time Census from Crowds of Greater Dhaka.
[3] Berlingerio, M., Calabrese, F., Di Lorenzo, G., Nair, R., Pinelli, F., Sbodio, M. L., 2013. AllAboard: assistance for exploring urban mobility and optimizing public transport using cellphone data. In: Machine Landing and Knowledge Discovery in Database. Springer, pp. 663-666.
[4] Calabrese, F., Colonna, N., Lovisolo, P., Parata, D., Ratti C., 2011. Real-time urban motoring using cell phones: a case study in rome. IEEE Trans. Intell. Ttransp. Syst. 12 (1), 141-151.
[5] Danaja M, Sriganesh L., “Origin-Destination Matrices estimation for Sri Lanka using mobile network big data,” Sri Lanka, 2015.
[6] Gonzalez MC, Hidalgo CA, Barabasi A-L, “Understanding Individual Human Mobility Patterns, Nature,” 2008, 453 (7196) pp. 779-782.
[7] Han, Q., Ferreira, P., 2013. Determinants of subscriber churn in wireless networks: the role of pear influence, 26th European Conference Operational Research Telecommunication Networks and Social Networks Stream, Roma Italy. http://dh.doi.org/10.1145/2639968. 2640057.
[8] Iqbal MS, Choudhury CF, Wang P, González MC, “Development of origin–destination matrices using mobile phone call data”, 2014, Transportation Research part C, 40, pp. 63-74.
[9] Isaacman S., Becker, R., Cáceres, R., Kobourob, S., Martonosi, M., Rowlan, J., Varshavsky, A., 2011. Identifying important places people’s lives form cellular network data. In: Proceedings of the 9th International Conference on Pervasive Commuting. Spriger-Verlag, Berlin, Heidelberg, pp. 133-151,
retrieved from
<http://dh.doi.org./citation.cfm?id=2021975.2021988>. [10] JphnR. B. P, Thomas J. E, Frederic B, Chang Y.C, Necati E. O, Kathleen. L. “New Approaches to human
Mobility: Using Mobile Phones for Demographic Research,” USA, 2012.
[11] Liu, L.; Biderman, A.; and Ratti, C, “Urban mobility landscape: Real time monitoring of urban mobility patterns,” in proceedings of the 11th International
Conference on Computers in Urban Planning and Urban Management, 2009.
[12] M.C. Gonzalez, C. A. Hialgo, and A. L. Barabasi, “Understanding individual human mobility patterns,” Nature, (453), June, 2008, 779-782.
[13] Motahari, S., Zang, H., Reuther, P., 2012. The impact of temporal factors on mobility patterns, 2012, 45th Hawaii International Conference on System Seience
(HICSS), pp.5659-5668.
http://dx.doi.org/10.1109/HICSS, 2012.572.
[14] N. Diala, F. Marco and S. Razvan, “ Human mobility flows in the city of Abidjan,”
[15] Patrick B,Hombourger E, Olteanu-RaimondA-M,Smoreda Z, “Passive mobile phone dataset to construct origin-destination matrix: potentials and limitations,” 10th International Conference on Transport Survey Methods, 2015.
[16] R. Becker, R. Cáceres, K.Hanson, S.Isaacman, J.M. Loh, M. Martonosi, J. Rowland, S. Urbanek, A. Varshvsky, and C. Volinsky. “Human mobility characterization from cellular network data,”
Communications of the ACM, 56 (1): 74-84, 2013. [17] R. Trestian, et.al, “Towards connecting people,
locations and real-world events in a cellular network”, International Journal of Telematics and Informatics, pp-244-271, 2016.
[18] S. Isaacman, R. Becker, R. Caceres, S. Kobourov, M. Martonosi, J. Rowland, and A. Varshavsky, “Ranges of human mobility in Los Angeles and New York,” in Eighth IEEE Workshops on Managing Ubiquitous Communications and Services, 2011.
[19] Y. Kuldeep, K. Amit, B. Aparna, N. Vinayak, “Characterizing mobility patterns of people in developing countries using their mobile phone data,” Delhi, India, 2014.