J. Embryol. exp. Morph. Vol. 65 (Supplement), pp. 103-J28, 1981 1 0 3 Printed in Great Britain © Company of Biologists Limited 1981
The control of somitogenesis in mouse embryos
By P . P . L . T A M *
From the MRC Mammalian Development Unit University College London
SUMMARY
Somitogenesis in the mouse embryo commences with the generation of presumptive somitic mesoderm at the primitive streak and in the tail-bud mesenchyme. The presumptive somitic mesoderm is then organized into somite primordia in the presomitic mesoderm. These primordia undergo morphogenesis leading to the segmentation of somites at the cranial end of the presomitic mesoderm. Somite sizes at the time of segmentation vary according to the position of the somite in the body axis: the size of lumbar and sacral somites is nearly twice that of upper trunk somites and of tail somites. The size of the presomitic mesoderm, which is governed by the balance between the addition of cells at the caudal end and the removal of somites at the cranial end, changes during embryonic development.
Somitogenesis is disturbed during the compensatory growth of mouse embryos which have suffered a drastic size reduction at the primitive-streak and early-organogenesis stages. The formation of somites is retarded and the upper trunk somites are formed at a smaller size. The embryo also follows an entirely different growth profile, but a normal body size is restored by the early foetal stage. The somite number is regulated to normal" and this is brought about by an altered rate of somite formation and the adjustment of somite size in proportion to the whole body size. It is proposed that axis formation and somitogenesis are related morphogenetic processes and that embryonic growth controls the kinetics of somito genesis, namely by regulating the number of cells allocated to each somite and the rate of somite formation.
I N T R O D U C T I O N
Tn the mouse embryo, mesoderm formation begins at about 6-5 days
post
coitum (p.c.)
(Snow, 1977). At the primitive streak, epiblast cells invaginate and
then spread as two lateral sheets of mesoderm in between the epiblast and the
endoderm (Batten & Haar, 1979; Poelmann, 1980). During this process of
gastrulation, extensive tissue relocation and marked changes in the morphology
and the behaviour of cells are observed (Reinius, 1965; Revel & Solursh, 1978;
Solursh & Revel, 1978; Batten & Haar, 1979; Poelmann, 1981). As the embryo
develops, the mesoderm is organized into paraxial and lateral plate mesoderm
along either side of the body axis. Somites, which are blocks of mesodermal
cells, are representatives of the segmentation of the paraxial mesoderm and are
formed in a co-ordinated cranio caudal sequence (Flint, 1977). Altogether, up
to 65 pairs of somites are formed in the mouse embryo (Witschi, 1962; Rugh,
* Present address: Department of Anatomy, Chinese University of Hong Kong, Shatin, N.T., Hong Kong.104
P. P. L. TAM1968; Theiler, 1972). The somites subsequently differentiate to form the axial skeleton (vertebrae and ribs), the muscle of the trunk and the limb and the dermis of the body wall. The number of vertebrae derived from the somites is remarkably constant among individual adult mice, but some variations in number also exist in mice of different genetic backgrounds and in mutant mice showing a reduced body axis (Gruneberg, 1963; Bennett, 1975; Flint,
1977).
The capacity to regulate the normal number of somites has been demonstrated in amphibian embryos where the embryonic size or the amount of presumptive somitic material is altered. In Xenopus embryos, even when a large proportion of blastula cells is removed surgically, qualitatively normal neurula- and tail-bud-stage embryos with a normally proportioned body pattern are formed (Waddington & Deuchar, 1953). In such miniaturized embryos, normal numbers of somites are formed. But the somites are smaller in size and are made up of fewer cells (Cooke, 1975). A normal number of somites is also formed in haploid Xenopus embryos. The length of the somite is shorter than the normal diploid size, a result of the smaller size of haploid cells, although the embryo partially compensates for this small cell size by incorporating more cells into each somite (Hamilton, 1969). When the amount of somite mesoderm in the late gastrula of the newt is doubled by adding extra strips of mesodermal tissue, the resultant size of the somite is increased but apparently the total number of somites remained unchanged (Waddington & Deuchar, 1953). When the amount of somitic mesoderm is reduced by removing a longitudinal strip of tissue from the neurula-stage Bombina embryo, normal numbers of somites of a reduced size are formed (Cooke, 1977). Similar observations have been made in the chick embryo. The removal or addition of presumptive somitic mesoderm only alters the size but not the number of somites formed from the segmental plate (Menkes & Sandor, 1977). When the segmental plate of different developmental stages is cultured, a relatively constant number of somites is formed regardless of the initial size of the segmental plate (Packard & Jacobson, 1976). In the mutant (amputated) mouse embryo, despite a shorter body length, normal numbers of somites are formed by 9-5 days p.c. The somites in the mutant embryo are much smaller than in the normal embryo (Flint, Ede, Wilby & Proctor, 1978). All these examples show that regulation of a normal somite number is brought about by an adjustment of the somite size in accordance to the amount of precursor tissue available for somitogenesis.
In the mouse embryo, somite formation begins at a stage when most of the presumptive somitic mesoderm for the posterior somites is yet to be formed.
Flint et al. (1978) pointed out that in such a continuously growing system, pattern formation is unlikely to be a process of proportioning of existing tissue, because it is inconceivable that the mouse embryo has a knowledge of its final body size. The control of number and size of somites is suggested to be related to the production of presomotic mesoderm by node regression, which is governed by
Somite formation in mouse embryos 105 the overall growth of the embryo. In both the mutant {amputated) mouse
embryo and the Xenopus embryo formed from a small blastula, no compensatory growth was observed and therefore a regulation of whole body size did not occur (Cooke, 1975; Flint et al. 1978).
An upward regulation of embryonic size has been observed during the development of mouse embryos. Half-sized embryos can be produced by the destruction of one of the two blastomeres at the 2-cell stage. The embryo remains half size until about 11-5 days p.c. An upward regulation of size seems to have taken place between 10-5 and 11-5 days p.c., presumably by an accele rated growth of the embryo (Tarkowski, 1959). Drastic reduction of embryonic size can be achieved by treating the mouse embryo at post-implantation stages with a DNA-synthesis inhibitor, Mitomycin C (MMC). Extensive cell death and cessation of cell proliferation ensue when the early-primitive-streak-stage embryo is treated with the drug transplacentally. By the late-primitive-streak stage, the treated embryo has on average only 10-15% of the normal number of cells (Snow & Tarn, 1979). The affected embryo then shows a remarkable capacity for compensatory growth so that a normal body size is restored by 13.5 days p.c.
and the foetal weight at birth is essentially normal (Snow, Tarn & McLaren, 1981). Preliminary results show that somite formation, as well as other develop mental processes including the limb bud, neural tube and primordial germ cells, is disturbed during the period of compensatory growth (Snow & Tarn, 1979, 1980; Snow et al. 1981 ; Tam & Snow, 1981). The MMC-treated embryo there fore provides an experimental model to study the relationship of somitogenesis to embryonic growth.
This study concerns the process of somitogenesis in mouse embryos through out the stages of development from early-somite stage to early-foetal stage. The association between somite formation and axis formation is studied by com paring the observations made on normal embryos and on MMC-treated embryos.
MATERIALS AND METHOD
Random-bred ^-strain mice were used. Female mice were mated with males of proven fertility and the morning when copulation plugs were found was taken as 0-3 days/?.<:. Mating has been assumed to occur between midnight and 2 a.m.
The pregnant females were sacrificed at 8-3-13*0 days p.c. to obtain embryos of appropriate stages of development. These were normal embryos. Some pregnant females were each given a single intraperitoneal injection of Mito mycin C (MMC, Sigma, London; at a dose of 100-125/tg/25 g) at 6-75-7-0 days p.c. (Snow & Tarn, 1979). Embryos were at the early- to mid-primitive-streak stage at the time of drug treatment (Snow, 1977). MMC-treated embryos were obtained from treated females sacrificed at 8-3-130 days p.c. Some females were injected with saline solution as controls. Embryos from these females
106
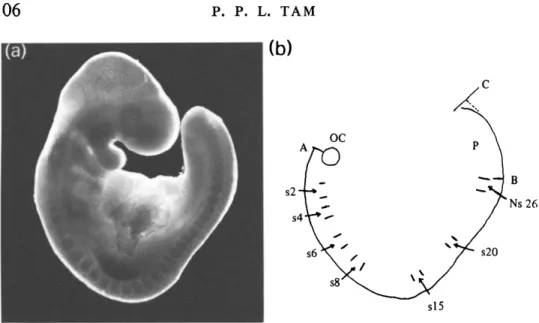
P. P. L. TAMFig. 1. (a) A 26-somite-stage mouse embryo and (b) a camera-lucida drawing of the embryo. OC, Otic capsule, S, somite, Ns, newly segmented somite, P, pre-somitic mesoderm.
were pooled with normal embryos since there was no discernible effect of the saline injection.
The embryos were dissected out from the decidua into phosphate-buffered saline (PB-1, Whittingham & Wales, 1969). The gross morphology and the somite number of the embryo were recorded. Camera-lucida drawings of the fresh unfixed embryos were made at 50 x or 100 x magnification using a Wild M5 dissection microscope fitted with a drawing tube. All measurements of length and size were then made on the camera-lucida drawings. Fig. 1 a shows a 26-somite-stage embryo and Fig. 1 b is a camera-lucida drawing of the embryo. Axial length {A-C) was measured from the cranial boundary of the first somite along the neural tube to the tail tip in embryos having 10 or fewer somites. In older embryos where the boundary of the first few somites was not readily discernible, axial length was measured from the centre of the optic capsule to the tail tip. This may result in an over-estimation of the axial length, but not by more than 200/tm which is equivalent to the length of about one somite. Axial length measured in this manner represents the total length of the somitic column and the presomitic mesoderm. The head was not included in such a measurement to avoid the compounding effect of head growth by brain cavity enlargement which may lead to an over-estimation of axial growth. The anterior-posterior length of the most recently segmented somite was measured midway between the dorsal and ventral side of the somite (see Flint et al. 1978). The length of the presomitic mesoderm was measured from the posterior boundary of the most recently segmented somite to the tail tip {B-C, Fig. 1 b). Altogether, 234 normal embryos and 198 MMC-treated embryos were included.
Somite formation in mouse embryos 107 Fifty-six normal embryos and 46 MMC-treated embryos were collected from
females between 8-3 and 11-75 days p.c. and were fixed in situ within the decidua in Bouin's fixative. Serial paraffin sections of 8 or 10 /-cm thickness were obtained and the sections were stained with haematoxylin and eosin. At each stage, the histology of the presomitic mesoderm and the caudal end of the embryo was examined. The somite number of the embryo was determined by counting the somites in serial sections of the specimen. The cell number, cell volume and mitotic index of the newly segmented somite and those of somite 8 were esti mated as follows. Camera-lucida drawings were made from all sections of the somite. Total tissue volume of the somite was then estimated from summed planimeter measurements of section areas multiplied by section thickness. For each somite, about five to six sections were selected and the number of nuclei in these sections was counted. This score was then corrected by Abercrombie's (1946) formula to give an estimate of the actual number of cells. Cell volume was then estimated by dividing the total tissue volume of the selected sections with the number of cells in that volume. Such an estimate, which does not exclude extracellular space, is close to the actual cell volume of the somitic cells which are closely packed, but may be an overestimate for the differentiating somite 8 where cells are more loosely packed. Finally, the cell number of the somite was computed from the tissue volume divided by the cell volume. Mitotic index was estimated from the total number of metaphase-anaphase figures and the cell number of the somite. For the presomitic mesoderm, mitotic index and cell volume were estimated in four randomly chosen tissue sections in different regions of the mesenchyme.
The data obtained were analysed by various statistical methods of correlation analysis, linear, non-linear and multiple linear regression, and tests for signifi cance between groups; details of the methods are described in Meddis (1975) and Snedecor & Cochran (1967).
RESULTS
Rate of somite formation
The first pair of somites is formed at about 8-3 days p.c. in the Q strain mouse embryo. Initially, somites are formed at a fast rate of about one pair in every hour. In later stages, the rate of somite formation progressively slows down to one pair in every 2-3 h. Figure 2 shows the mean somite number for embryos at various ages. There is considerable variation in the somite number of embryos within and between litters of the same age. The somite number also overlaps among embryos belonging to litters of different age, e.g. 30-somite embryos are found in both 9-5- and 10-0-day litters. Such a variation in somite number suggests that embryos may develop at different rates even when they are in the same uterine environment. The most advanced embryo could be about 6-8 h ahead in development compared to its slowest litter-mate.
108
P. P. L. TAM 60 r S 40 20 0 L 10-5 Age (daysp.c.)Fig. 2. The mean somite number of normal ( # ) and MMC-treated (O) embryos at 8-5-12-5 days.
delayed by about 1-2 h. Subsequent somites are formed at a relatively slow
rate of one pair in every 2 h. The formation of the upper and lower trunk somites
is retarded and somites 25-35 are formed about 10—12h later than those in normal
embryos. At 8-5-10-5 days, the MMC-treated embryos have significantly fewer
somites than the normal embryos, but by 11-5 and 12-5 days, the treated embryos
have the same somite number as the normal ones (Fig. 2).
The paraxial presomitic mesoderm
Regional differentiation of the mesoderm becomes apparent in the
presomite-stage embryo at about 8-3 days
p.c.
The mesoderm lying underneath the
cranial neural plate forms the head mesenchyme. The mesoderm in the posterior
half of the embryo forms two broad bands of paraxial and lateral plate mesoderm
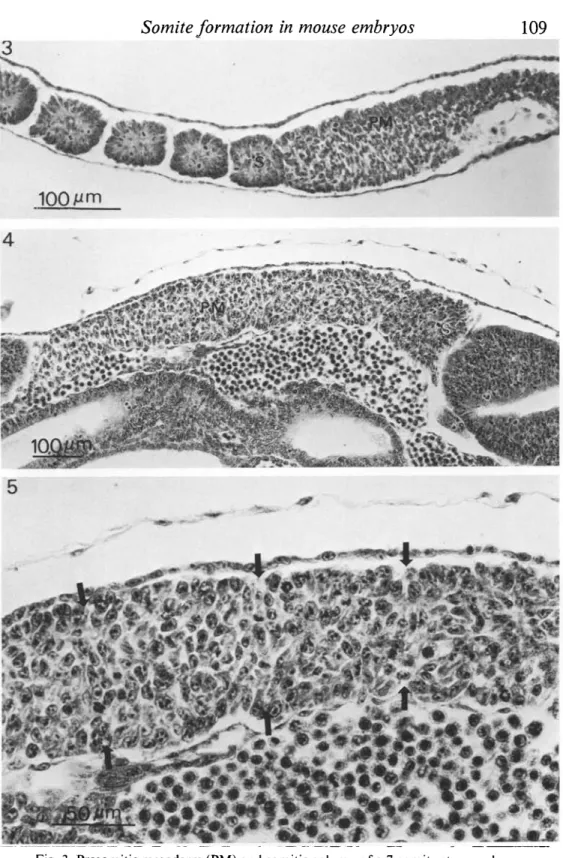
on either side of the primitive streak. Figure 3 shows a longitudinal section
through the length of the paraxial presomitic mesoderm of an 8-5-day embryo
and Fig. 4 shows a similar section of a 9-5-day embryo. Somites are formed by
the segmentation of tissue at the cranial end of the presomitic mesoderm. Within
the presomitic mesoderm, and particularly near the cranial portion, mesenchymal
cells are organized into segmental units prior to overt segmentation. Figure 5
shows a magnified view of the arrangement of mesenchymal cells. Cells are
arranged radially into clusters and the boundary between clusters is marked by
Somite formation in mouse embryos
109
* J Ä » ~
Fig. 3. Presomitic mesoderm (PM) and somitic column of a 7-somite-stage embryo. Cells in the presomitic mesoderm closest to the newly segmented somite (S) are organized into clusters.
Fig. 4. Presomitic mesoderm (PM) and newly segmented somite (S) of a 27-somite-stage embryo.
Fig. 5. The organization of cells in the presomitic mesoderm. Magnified view of Fig. 4, showing boundaries (■►) between clusters.
110
6
P. P. L. TAM
Fig. 6. Primitive streak area of a 8-5-day embryo. E, epiblast; M, mesoderm; AL, allantoic bud.
Fig. 7. Primitive streak area of a 9-5-day embryo. NE, neuroepithelium of the posterior neuropore; M, mesoderm.
Somite formation in mouse embryos 111
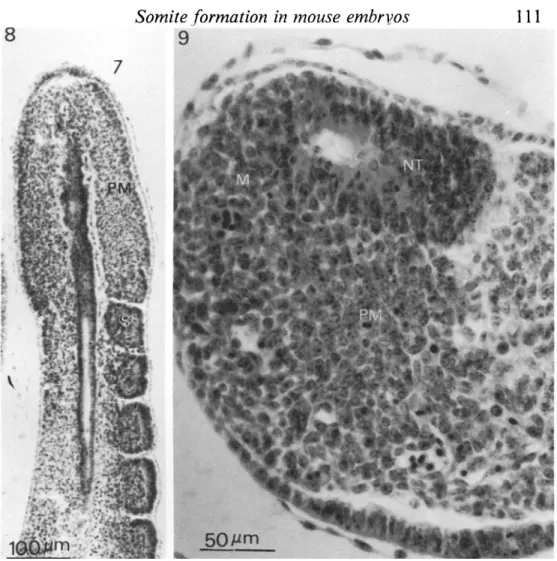
Fig. 8. A section through the tail of a 10-5-day embryo, showing presomitic meso derm (PM) and newly segmented somite (S).
Fig. 9. The terminal zone of proliferating mesenchyme in the tail bud. NT, neural tube; PM, presomitic mesoderm; M, mesenchyme.
the change of cellular orientation from a radial to a transverse alignment. Similar segmental organization of cells is also found in the presomitic mesoderm closest to the newly segmented somite in the tail (see Fig. 8).
The caudal end of the presomitic mesoderm is always associated with either the primitive streak (Fig. 6 & 7) or the tail bud (Fig. 9). The primitive streak is first identified in the 6-5-day early-primitive-streak-stage embryo as a localized area in the epiblast where cell invagination occurs. The streak lengthens to 400-500 /im
in the 7-5 day late-primitive-streak-stage embryo, and it extends from the base of the allantoic bud to the distal tip of the egg cylinder. The streak then pro gressively shortens during subsequent development to 200-300 /.cm at 8.0 days, to 150-170/*m at 8-5 days and to 50-100 /tm at 9-5 days. At 8-5 days, the
112
P . P . L. T A M 1-5 10 05>f
*3»W
20 30 40 50Stage by somite number
Fig. 10. Changes in the size of presomitic mesoderm during development. Normal embryos ( # ) and MMC-treated embryos (O).
Table 1.
The mitotic activity and cell volume of the mesenchyme in the presomitic
mesoderm of normal and MMC-treated mouse embryos
Mitotic index (%) Cell volume (/tm3)
Somite number of embryos Somite number
of embryos Normal MMC Normal MMC
1-4 11-5 (1) 10-9 ±2-2 (3) 990 (1) 1108 ±29 (3) 5-8 10-3 ±1-2 (9) 8-3±l-l (7) 932 ±99 (9) 1072 ±51 (7) 9-12 5-6 ±0-3 (9) 7-5 ±0-9 (7) 1012 ±76 (9) 1134 ± 45 (7) 13-16 6-7 ± 1 1 (3) 6-5 ±1-7 (9) 1146 ±22 (3) 1067 ±55 (9) 17-20 5-2±0-6 (6) 7-3 (2) 1183±67 (6) 1387 (2) 21-24 4-8±0-3(U) 7-4 (1) 1089 + 30 (11) 1181 (1) 25-28 4 - 5 ± 0 1 (8) 8-1 ±0-8 (7) 1096 ±55 (8) 1134 ±65 (7) 29-32 4-9 + 0-5 (3) 6-6 ±0-4 (7) 928 ±66 (3) 1187±60(7) 33-36 4-8 (2) 6-9 ±1-5 (3) 1106 (2) 1066 ±94 (3) 37-41 4-6 ±0-3 (4) 5-1 (2) 1015 ±67 (4) 1018 (2) >
Statistical test No, F = 12-52, DF. = 1,102
Y
No, F - 4-17, D F. = 1,102
Is normal P < 0 0 1 , MMC > normal P < 0-01, MMC > normal
= MMC?
primitive streak is located immediately caudal to the neural plate of the embryo
(Fig. 6) and at 9-5 days forms the posterior border of the open posterior neuropore
(Fig. 7). Histological appearance of the primitive streak area suggests that
invagination of cells from the overlying epiblast and the rearrangement of cells
once they are in a mesodermal position are the major processes involved in the
generation of paraxial presomitic mesoderm. After the closure of the posterior
neuropore which takes place at about 9-6 days (26- to 29-somite stage), a terminal
zone of proliferating mesenchyme is found in the tail bud (Fig. 9). No clear
Somite formation in mouse embryos 113 100 r 50 10 0 * 20 40 60 Fig. 11,
Stage by somite number
The comparison of axial length of normal ( # ) and MMC-treated ( O ) embryos at different developmental stages.
distinction in morphology is found between the presumptive neural cell and the presumptive mesodermal tissue. Cranial to this terminal zone, the mesodermal cells are organized into the paraxial presomitic mesoderm on either side of the neural tube and notochord (Fig. 8).
The size of the presomitic mesoderm changes during embryonic development. It increases in length from 04-0-5 mm at the early-somite stage to over 1-5 mm at the 20- to 30-somite stage, then it shortens to about 0-5 mm at the 40- to 50-somite stage (Fig. 10). In the normal embryo, the mitotic activity of the mesenchyme in the presomitic mesoderm remains high until about the 20-somite stage (Table 1). This apparently coincides with the increase in the size of the presomitic
mesoderm. Beyond the 20-somite stage, the mitotic activity declines. A similar change in the size of the presomitic mesoderm is also observed in MMC-treated embryos. But the size of the presomitic mesoderm is significantly smaller
114
P . P . L. T A M 0-8 r1 10 20 30 40 50 Stage by somite number
Fig. 12. The relative proportion of the length of presomitic mesoderm to whole body length. Normal embryos ( # ) and MMCtreated embryos ( 0 )
-than the normal size at 1- to 30-somite stage (Fig. 10). The mitotic activity of
the cells is generally higher in the treated embryo (Table 1). The estimated cell
volume of the mesenchymal cells in MMC-treated embryos is bigger than
normal, perhaps reflecting a looser packing of cells (Table 1). This, when taken
together with the reduced size of the presomitic mesoderm at 1- to 30-somite
stage, suggests that many fewer cells are made available for somite formation.
The enhanced mitotic activity seems also to be related to the lowering of cell
density in the presomitic mesoderm.
The reduction in the size of presomitic mesoderm in MMC-treated embryos
is proportional to the overall reduction in body size. Figure 11 shows the axial
length measured for embryos at various somite stages. Axial length increases
with the increase in somite number, but up to about the 30-somite stage the
treated embryo has a significantly shorter body axis than the normal embryo
of the same somite number. This information implies that the size of all the
somites present in the treated embryo must be of a proportionately smaller size
than those of the normal embryo. Furthermore, when the size of the presomitic
mesoderm relative to the overall axis length is compared between normal and
treated embryos of the same somite stage, it becomes evident that the presomitic
mesoderm is always maintained at a normal proportion to the body size in the
treated embryo showing a shorter body axis (Fig. 12).
200
150
-E 100
50
Somite formation in mouse embryos
i
115no UT }i o ^ i T ,
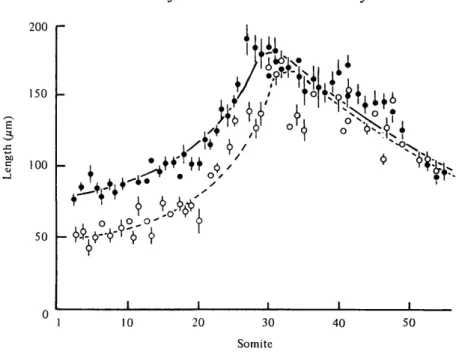
10 20 30 Somite 40 50Fig. 13. The size of newly segmented somites in normal ( # ) and MMC-treated (O) embryos.
Somite size at the time of segmentation
Somites are formed at different sizes according to their position in the body axis. In normal embryos, the newly segmented somites at the occipital, cervical and upper thoracic levels (somites 1-20) are about 70-110 /«n in length. The size increases progressively with the more posterior somites. Lower thoracic somites (somites 21-25) are about 120-130/^m in length and upper lumbar somites (somites 26-28) are 140-150 /tm and the lower lumbar somites (somites 29-31) are 150-180/^m (Fig. 13). The sacral somites (somites 32-35) are of the same size as the lower lumbar somites. The caudal somites are formed at a progressively smaller size (Fig. 13).
In the MMC-treated embryo, the occipital, cervical, thoracic and lumbar somites are all formed at a smaller size then their normal counterparts (Fig. 13). The caudal somites are formed with a normal size. The overall pattern of changes in the somite size with body level in the treated embryo is similar to that in the normal embryo.
In the normal embryo, occipital and cervical somites are formed with about 150-200 cells. More and more cells are being incorporated into thoracic, lumbar and sacral somites. About 1000-1500 cells are found in the newly segmented lumbar and sacral somites, which therefore have ten times more cells than in upper trunk somites (Table 2). In the treated embryos, somites generally have fewer cells; only about 50% as many cells are found in the upper trunk somites, the more caudal ones have about 80-90% of the normal number of cells (Table
Tabl e 2 . The cell number, cell volume and mitotic activity of cells in the newly segmented somites of normal and MMC-treated mouse embryos Cel l numbe r Cel l volum e (/im 3) Mitoti c inde x (% ) Somite s Norma l MM C Norma l MM C Norma l MM C 1-4 16 3 (1 ) 65± 8 (1 ) 70 3 (1 ) 97 8 ±6 4 (3 ) 5 5 (1 ) 6 0 ±2 0 (3 ) 5-8 18 1 ±1 8 (9 ) 9 5 ± 8 (7 ) 85 9 ±3 5 (9 ) 102 1 ±6 9 (7 ) 67±0-5 (9 ) 5-0 ±0-8 (7 ) 9-1 2 218 ± 1 7 (9 ) 18 9 ±2 5 (7 ) 85 8 ±4 2 (9 ) 103 0 ±6 1 (7 ) 7-3 ±0-6 (9 ) 5-2 ±0-9 (7 ) 13-1 6 43 5 ±8 3 (3 ) 27 2 ±4 5 (9) 99 9 ±1 6 (3 ) 1019±50(9 ) 3 1 ±0-9 (3 ) 4-6 ±0-7 (9 ) 17-2 0 56 8 ±3 9 (6 ) 46 3 (2 ) 105 5 ±5 9 (6 ) 121 6 (2 ) 5-7 ±0-6 (6 ) 4-4 (2 ) 21-2 4 787±62(11 ) 51 8 (1 ) 98 2 ±4 2 (11 ) 97 1 (1 ) 4-6±0-3 (11 ) 2-5 (1 ) 25-2 8 105 1 ±3 8 (8 ) 910±144(7 ) 101 3 ±6 6 (8 ) 109 0 ±5 3 (7 ) 3-8 ±0-4 (8 ) 4-9±l-4(7 ) 29-3 2 1224 ± 12 1 (3 ) 102 3 ±7 7 (7 ) 96 9 ±4 9 (3 ) 106 8 ±3 1 (7 ) 3-2 + 0-4 (3 ) 3-1 ±0-2 (7 ) 33-3 6 102 4 {2) 90 3 ±5 9 (3 ) 92 6 (2 ) 107 3 ±2 6 (3 ) 4-3 (2 ) 3-6±0 1 (3 ) 37-4 1 146 5 ±16 8 (4 ) 82 4 (2 ) > 90 2 ±3 5 (4 ) 100 4 (2 ) 3-7 ±0-2 (4 ) 3-8 (2 ) Statistica l tes t No , F = 3-9 , D.F . = 1,10 2 No , F - 1 i4-3 , D.F . = 1,10 2 Yes , F = 2-3 , D.F . = 1,10 2 Is Norma l = MMC ? P < 005 , Norma l > MM C P < 005 , MM C > Norma l Norma l = = MM C
y
y
P H >Somite formation in mouse embryos 117 Table 3. The correlation between the size of the somite and the cell number of the somite at the time of segmentation from the presomitic mesoderm
Normal MMC
Somites Cell number Size Cell number Size
1-4 163 85-3 65 56-7 5-8 181 76-9 95 57-2 9-12 218 820 189 68-9 13-16 435 97-4 272 81-7 17-20 568 1000 463 86-7 21-24 787 1190 518 1000 25-28 1051 1340 910 129 3 29-32 1224 1750 1023 145-5 33-36 1024 1580 903 141-5 37-41 1465 141 0 824 137-2 Correlation analyses: Coefficient 0 91 0-97
Significant? Yes, P < 0-01 Yes, P < 0-01
Large somite has
more cells? Yes, P < 001, F = 381 Yes, P < 001, F = 145-8
2). There is a good correlation between the length of the somite and the number of cells in the somite (Table 3).
The volume of somitic cells remains relatively constant among the somites in the two groups of embryos (Table 2). MMC-somitic cells have a bigger cell volume, but this is likely to be an overestimation because of the looser packing of cells in MMC somites.
In both the normal embryo and the treated embryo, the mitotic activity of the somitic cells is higher in upper trunk somites than in lower trunk somites (Table 2). There is, however, no significant difference between the same somites in the two groups of embryos. Therefore, the initial difference in somite size and the discrepancy in cell number is not modulated for some time after somite segmentation.
The growth of somite 8 is followed by counting cell numbers in the somite during the period from segmentation to sclerotome dispersion (Table 4). The somite grows in size mainly by an increase in cell number, cell growth does not seem to play a major part because cell volume does not increase during this period of growth. Compensatory growth of somites therefore does not occur prior to sclerotome dispersion.
The association between somite formation and axis growth
The axial length of the mouse embryo increases in a sigmoid relationship with the embryonic age (Fig. 14). The normal embryo accelerates growth
Tabl e 4 . Changes in cell numbers, cell volume and mitotic activity of cells in somite 8 during its initial growth period prior to sclerotome dispersion Somit e numbe r Cel l numbe r Cel l volum e (/im 3 ) Mitoti c inde x (% ) ^ o f th e embry o A ^ o f th e embry o Norma l MM C Norma l MM C Norma l MM C y 8 155±18(3 ) 8 2 (1 ) 85 1 ±4 0 (3 ) 123 3 (1 ) 6 6 ± 1 1 (3 ) 3-7 (1 ) p 9-1 0 25 6 ±5 3 (4 ) 14 0 ±3 8 (3 ) 74 5 ± 7 5 (4 ) 102 5 ±3 2 (3 ) 7-1 ±1-1 (4 ) 8-9±30(3 ) H 11-1 2 28 3 ±5 8 (5 ) 13 8 ±2 0 (4 ) 84 9 ± 3 3 (5 ) 98 8 ±7 4 (4 ) 6-4 ±0-9 (5 ) 6-3 ±1-6 (4 ) > 13-1 4 44 7 ± 6 8 (5 ) 20 6 ±6 0 (4 ) 116 6 ±7 0 (5 ) 94 9 + 7 6 (4 ) 6-9 ±1 0 (5 ) 6-9 ±0-9 (4 ) £ 1 5 — 30 2 ± 8 0 (3 ) — 1027±109(3 ) — 30±0 1 (3 ) Sclerotom e dispersio n occurre d a t 14-somit e stag e i n norma l embryos , bu t a t 15-somit e stag e i n MMC-treate d embryos . Cel l numbe r wa s estimate d durin g th e initia l growt h perio d for m segmentatio n t o sclerotom e dispersio n i n th e somite .
Somite formation in mouse embryos 119 15 -10 0
r .8°
«?
/ ' / 4* / 12 13 9 10 11 Age (daysp.c.)Fig. 14. The two different growth profiles of the normal ( # ) and the MMC-treated
(O) embryo between 8 3 and 130 days p.c.
between 8-5 and 9-5 days p.c. and reaches a peak rate at 9-5-10.0 days (Fig. 15). The treated embryo shows an early phase of growth retardation but accelerates its growth rate after 9-5 days and it actually grows much faster than the normal embryo after 10-0 days (Fig. 15). Normal axial length is subsequently attained by 12-5 days (Fig. 14). It must be noted that the peak growth rate of the treated embryo has never exceeded that of the normal peak rate. The rate of axis growth measured in this study has taken account of both the rate of addition of tissue to the axis and the growth of the tissue already in the axis (Fig. 16). At early stages (1- to 10-somite stage), tissue addition accounts for more than 50% of the axial increase. In later stages, tissue addition consistently contributes to about 4 5 % of the axial increase. It seems, therefore, that the rate of axial growth measured in this study is a reliable approximation of the rate of tissue incorporation at the caudal end of the embryonic axis.
120
P . P . L. T A M8-5 9-5 10-5 11-5 12-5
Age (daysp.c.)
Fig. 15. The rate of axis elongation of normal ( # ) and MMC-treated (O) embryos at different developmental ages.
# 100 n 50 0 l 0
••V
o" ° m o • o o j £ & & . — - - _ , ? S'<*> . • 0 #. • . . • . . . • • - . • . . . • " 50 ^ 100 10 20 30 40 50 60Stage by somite number
Fig. 16. The relative contribution to axis elongation by somite addition and by the growth of the tissue in the body axis at different developmental stages. Normal embryos ( # ) and MMC-treated embryos
(O)-Somite formation in mouse embryos 121 Somites Presomitic mesoderm Removal of cells ^~ 1 Addition of cells 1. Primitive streak 2. Tail bud
Fig. 17. The relationship between cellular addition to the caudal end of the presomitic mesoderm and the removal of cells by somite segmentation at the cranial end. Cells are added to the somitic pattern by the recruitment of epiblast cells at the primitive streak or by the proliferation of cells in the tail-bud mesenchyme. The amount of tissue removed from the presomitic mesoderm depends on somite size and the rate of somite segmentation.
axis formation during the development of mouse embryos. Presumptive somitic cells are added to the caudal end of the presomitic mesoderm. The presomitic mesoderm is a pool of cells in transit and the pool size at any instant is the balance between cellular addition at one end and the removal of somites at the other end. The amount of tissue removed depends on the size of somites and the rate of somite segmentation. The data collected on the rate of axis growth, the somite size, the rate of somite segmentation and the size of presomitic mesoderm are tested for evidence supporting a multiple linear relationship model (Table 5). The results of the regression analysis for both types of embryos suggest that the data indeed conform very well to such a model. There is also a significant correlation between the growth rate and the somite size at any stage of develop ment (normal embryos: r = 0-48, D.F. = 54, P < 0-01; treated embryos:
r = 0-79, D.F. = 52, P < 0-01). The results therefore suggest that the size of a somite is related to the amount of axis growth and the rate of somitogenesis. Despite a disturbance in the growth pattern and somitogenesis in MMC-treated embryos, a control mechanism similar to that of normal embryos is likely to be operating.
DISCUSSION
It has been reported in a study on the formation of the first 26 somites in mouse embryos that during development the size of the somite and the size of the presomitic mesoderm remain unchanged (Flint et al. 1978). The present study has extended the observation to a much later stage of somitogenesis and the conclusion drawn here is not in agreement with that of Flint et al (l 978). Both the size of the somite at the time of segmentation and the size of the presomitic mesoderm change in embryos between the 1-somite and 56-somite stage. The size of the newly segmented somite increases craniocaudally and the somites are biggest at the lumbar and sacral level of the body axis. The caudal somites are progressively smaller in size. The variation in somite size is related to the number of cells being incorporated into each somite at the time of segmentation from the presomitic mesoderm. The presomitic mesoderm increases in size during the early phases of somitogenesis and gets smaller and smaller in later
Tabl e 5 . The result of regression analyses of data obtained from normal and MMC-treated embryos, based upon a multiple linear relation Th e multipl e linea r relation : Regressio n result s Y = b 0 -b1 (RXS) + b i (GR) Y, siz e o f th e presomiti c mesoderm ; R, rat e o f somit e formation ; S, siz e o f th e newl y segmente d somite ; GR, rat e o f axi s growth . Constant s Coeff . o f de terminatio n r 2 Significanc e o f regressio n Partia l correlation s H b0 br b2 Coeff . o f de terminatio n r 2 Significanc e o f regressio n f GR-.RXS RXS-.Y GR-.Y > Norma l 014 9 -0066 4 016 7 0-68 2 (P < 001 ) F(2,48 ) = 51. 6 (P < 001 ) -0-4 6 {P < 001 ) -0-4 9 {P < 001 ) 0-8 2 (P < 01 ) MM C 0-46 8 0110 8 010 3 0-22 5 (P < 001 ) F(2,48 ) = 6-9 7 {P < 001 ) -0-8 0 (/ > < 001 ) -0-2 9 (P < 001 ) 0-4 6 (P < 001 )
Somite formation in mouse embryos
123
phases. There is a two- to three-fold change in size of the somites and of the presomitic mesoderm during development. Since the method of measurement of sizes in this study is the same as that of Flint et al. the apparent conflict with those data is likely to be due to the narrow range of developmental stages and the method of data analysis used by Flint et al. Their study was based upon embryos at 1- to 26-somite stages whereas it is clear from the present study that the largest increase in size occurs when the embryo is at the 28- to 35-somite stage. When equivalent early somite stages are compared no significant dis crepancies are found between the two studies. However, since most of the data points in Flint's study are clustered around somites 7-23 and the measured values show a large statistical variation, a linear regression of the data over a narrow range would tend to be misleading.
The variation in size of newly segmented somites in the mouse is different from that in the amphibian but similar to that in the chick. In Xenopusembryos, the anterior 14 somites are the biggest of all when they are formed from the paraxial mesoderm and further down the axis, the somites become smaller. This is interpretated as a manifestation of a smooth wave of cellular recruitment into the somitic pattern (Pearson & Elsdale, 1979). In the chick embryo, the newly segmented somite is always the length of two somitic cells plus a myocoel, but the actual size of the somite varies with the shape of the cells and the number of cells that are accommodated in each somite (Bellairs, 1979). The results from the measurement of newly segmented somites in chick embryos reveal that the somite size increases two-fold from 100/^m (somite 7) to 190-220 /im (for somites 20-32). The size then decreases for somites 33-50 down to about 110/im for somite 50 (Herrmann, Schnieder, Neukom & Moore, 1951). The results in the mouse and the chick suggest that the pattern of cellular recruitment may be different from that in amphibian.
The paraxial presomitic mesoderm has been regarded as an undifferentiated tissue in which the prospective somitic cells undergo maturation and organiza tion prior to segmentation. At the light microscopic level, no overt segmentation into presumptive somite is detected (Lipton & Jacobson, 1974). However, by using the scanning electron microscope (SEM), Bellairs (1979) has shown that tissues at the cranial-most end of the segmental plate are already structured into 'maturing somites'. Some recent findings on the organization of cells in the segmental plate of chick embryos have direct bearings on the interpretation of the result in the present study. Analysis by stereo SEM shows the paraxial mesoblast in the segmental plate to be organized into circular domains, named somitomeres, which are arranged in tandem along the cranio caudal axis (Meier, 1979). The cells in the most recently formed somitomere, which is adjacent to Hensen's node, are organized in concentric whorls, with those cells in the centre more condensed than those near the perimeter. The somito mere is divided into anterior and posterior halves along a line perpendi cular to the body axis, marking the site of the future sub-division of sclerotome
124
P. P. L. TAMinto the posterior and anterior components of successive vertebral bodies (Solursh, Fisher, Meier & Singley, 1979). Over a wide range of sizes of the segmental plate from embryos of different stages, a consistent number of about 1 0 - 1 1 somites is formed when the segmental plate is cultured in iso lation (Packard & Jacobson, 1976; Packard, 1978). The study by stereo SEM has verified that 10 or 11 somitomeres are present in the segmental plate (Meier, 1979). Therefore, a pre-pattern of prospective somites is already speci fied in the segmental plate of the embryo. Extensive series of experiments have been done to show that the craniocaudal sequence of segmentation and the position of inter-somitic fissures are already determined in the segmental plate (Menkes & Sandor, 1977). The cells from the segmental plate also behave very similarly to those cells already in the somite (Bellairs, Sanders & Portsch, 1980). It has been shown in this study that in properly sectioned specimens, cells in the presomitic mesoderm of the mouse embryo are organized into segmental units. More recently, a stereo SEM study of the presomitic mesoderm of mouse embryos between 8-0 and 11-5 days p.c. shows that in all these stages, the presomitic mesoderm is organized into somitomeres (Tarn & Meier, in prepara tion). Five or six somitomeres are arranged in tandem between the newly segmented somite and the primitive streak or the tail bud. The length of the presomitic mesoderm is the sum total length of all the somitomeres contained in this tissue.
Several important implications emerge from the aforementioned knowledge of the segmental plate/presomitic mesoderm. First, because a pre-pattern is already formed in the presomitic mesoderm, the spécification of somite pattern must therefore have occurred at an earlier stage of development. It is also unlikely that any regulation of number or size of somite is taking place in the presomitic mesoderm as suggested by Flint et al. (1978). Rather, pattern formation occurs at the time of inception of presumptive somitic mesoderm as it passes through the primitive streak or leaves the zone of proliferating tail-bud mesenchyme. Secondly, since a relatively constant number of somitomeres are found in the segmental plate/presomitic mesoderm over a wide range of different sizes, it implies that the somitomere is of a different size at different phases of development. The size of the newly segmented somite may have a direct correla tion with the size of its somitomere and also with the number of cells incorpora ted into the somitomere. However, such a correlation is complicated by the amount of growth that has taken place while the somitomere is in the pre somitic mesoderm. Finally, as a result of the constancy in the number of segmental units in the segmental plate/presomitic mesoderm, the rate of segmentation of somite must follow closely the rate at which the presumptive somitic cells are organized into somitomeres at the caudal-most end of the embryo.
The regression analysis of the data obtained from the study of normal embryos and treated embryos suggest that embryonic growth controls the kinetics of somitogenesis, namely by regulating the number of cells allocated
Somite formation in mouse embryos 125 to each somite and the rate of somitogenesis. Even though the MMC-treated
embryo suffers a severe reduction in size during early post-implantation period, brought about by extensive cell loss and growth retardation, it can still generate a normal number of somites by 12-5 days. This is brought about by adjusting the somite size in proportion to whole body size and by altering the rate of somitogenesis. Somite formation is mediated by the production of presumptive somitic cells from a progenitor population. This population expands by the recruitment of cells from the epiblast during gastrulation and by the proliferation of cells already residing in the population. The cells are then organized into primordia of somites (somitomeres?) which undergo morphogenesis in the presomitic mesoderm and later emerge as somites. The size of the primordium could be regulated by the quantity of precursor tissue available for somitogenesis, an idea closely in line with that of Flint et al. (1978). The rate of expansion of the progenitor population is probably related to the rate of axis growth. It may therefore not be coincidental that somites are largest when the embryo's in its fastest growth phase. The rate of somitogenesis, on the other hand, is a function of the rate at which cells undergo morpho genesis into primordia. It is also likely that the successful formation of a primor dium depends on a minimal cell number, or tissue mass, and therefore the rate of somitogenesis is limited to some extent by the rate of expansion of the progenitor population. Extensive cell loss during the early stages of develop ment of MMC-treated embryos may have diminished the size of the progenitor population. Subsequent expansion of the progenitor population is slowed down because of the retarded growth of the embryo. The fact that somites can still be formed but are much smaller and are made at a slower rate suggests that under normal circumstances the pool of precursor cells is considerably larger than the threshold size for somite formation. The formation of small somites could be
the result of reduced growth of an initially small-sized primordium prior to
segmentation but there is no evidence for a reduced growth potential of the primordium. The proliferative activity of cells in the presomitic mesoderm of treated embryos is at least the same as that of normal embryos, and may be higher at some stages. Small somites seem therefore to be the result of smaller primordia. A similar relation between the final size of the skeletal elements of the chick limb and the size of the primordia has been suggested from the study of the development of X-irradiated limb bud. The successful formation of a primordium for a skeletal element also seems to require the provision of a threshold number of cells (Wolpert, Tickle & Samford, 1979).
Despite the disturbance in growth and somitogenesis, normal numbers of somites are formed in the MMC-treated embryos by 12-5 days. It is not clear how this regulation of somite number is brought about, but there are several possibilities. A regulation to the normal number can be brought about by a process whereby during early development, a fixed or quantal number of embryonic cells is set aside for somite formation regardless of the size of cell population in the
126
P. P. L. TAMwhole embryo. The simplest case would be that the number of sub-groups of cells within the progenitor population of presumptive somitic mesoderm represents exactly the number of somites to be formed. By studying the heterogeneity of cell populations in the somites of mouse chimaeras, Gearhart & Mintz (1972) suggest that at least 1040 cells must be set aside in the late-primitive-streak-stage embryo in order to form all 65 pairs of somites in the mouse embryo. However, the reliability of such an estimate based on chimaeric embryos is still open to question (West, 1978). Furthermore the estimate is difficult to reconcile with the results from MMC-treated embryos where a drastic reduction of cell population occurs and normal numbers of somites are still formed. Current ideas on the regulation of somite numbers include the operation of an oscillator in the embryo, which exhibits a fixed number of oscillations during somito-genesis (Cooke, 1977; Cooke & Zeeman, 1976; Cooke & Elsdale, 1980). The same number of oscillations must be found in embryos of different sizes and
with different rates of development in order to achieve a regulation of somite
numbers. It further implies that only the size of somite is varied in accordance to the total amount of tissue available (Cooke, 1975, 1977). However, to account for somite number regulation in a growing system like that of the mouse embryo, Flint et al. (1978) suggest that regulation must be under a global control in relation to growth. If the cells designated for more posterior somites are established by increasing time or the number of rounds of cell generations in the progenitor population, then the specification of somite number could be part of the mechanism controlling embryonic axial growth. Such a mechanism for control of the number of morphological units is reminiscent of that in the chick limb bud. There appears to be a relationship between the number of divisions of mesenchymal cells in the apical growth zone of the limb bud and the number of skeletal segments laid down (Lewis, 1975). In a similar fashion, the somite number can be regulated by the number of cell generations in the progenitor population of presumptive somitic mesoderm. Even so, such a con trol mechanism may not be a stringent regulator of numbers because the growth profile of an embryo could be changed by intrinsic or extrinsic factors during development. Indeed, a small variation of about 3-5 % in the modal number of serially repeated units is not uncommon among individuals of the same species (Cooke, 1977; Maynard-Smith, 1960). The continuous presence of a progenitor population is crucial to the formation of somite pattern. Removal of the tail bud in amphibian embryos (Cooke, 1977) or the streak plus node area in chick embryos and in mouse embryos (Packard & Jacobson, 1976; Smith, 1964) invariably leads to a premature cessation of somitogenesis and consequently regulation of somite number becomes impossible.
Somite formation in mouse embryos
127
I am very grateful to Dr Michael H. L. Snow for his invaluable guidance and support during the course of my work. I wish to thank Dr Antone Jacobson and Dr Stephen Meier, of the Department of Zoology, University of Texas at Austin, for reading the manuscript and for allowing me to quote the unpublished work on somitomeres. I was supported by a British Commonwealth Scholarship from the Commonwealth Scholarships Commission in the U.K.REFERENCES
ABERCROMBIE, M. (1946). Estimation of nuclear population from microtome sections. Anat.
Rec. 94, 239-247.
BATTEN, B. E. & HAAR, J. L. (1979). Fine structural differentiation of germ layers in the
mouse at the time of mesoderm formation. Anat. Rec. 194, 125-142.
BELLAIRS, R. (1979). The mechanism of somite segmentation in the chick embryos./. Embryol.
exp. Morph. 51, 227-243.
BELLAIRS, R., SANDERS, E. J. &PORTSCH, P. A. (1980). Behavioural properties of chick somitic
mesoderm and lateral plate explanted in vitro. J. Embryol. exp. Morph. 56, 41-58.
BENNETT, D. (1975). The T-locus of the mouse. Cell. 6, 441-454.
COOKE, J. (1975). Control of somite number during development of a vertebrate, Xenopus
laevis. Nature, Lond. 254, 192-199.
COOKE, J. (1977). The control of somite number during amphibian development. Models and
experiments. In Vertebrate Limb and Somite Morphogenesis (ed. D. A. Ede, J. R. Hinchliffe
& M. Balls), pp. 433-448. Cambridge: Cambridge University Press.
COOKE, J. &ELSDALE, T. (I980). Somitogenesis in amphibian embryos. III. Effects of ambient temperature and of developmental stage upon pattern abnormalities that follow short
temperature shocks. J. Embryol. exp. Morph. 58, 107-118.
COOKE, J. & ZEEMAN, E. C. (1976). A clock and wavefront model for control of the number
of repeated structures during animal morphogenesis. / . theor. Biol. 58, 455-476.
FLINT, O. P. (1977). Cell interactions in the developing axial skeleton in normal and mutant
mouse embryos. In Vertebrate Limb and Somite Morphogenesis (ed. D . A. Ede, J. R.
Hinchliffe & M. Balls), pp. 463-484. Cambridge: Cambridge University Press.
FLINT, O. P., EDE, D. A., WILBY, O. K. & PROCTOR, J. (1978). Control of somite number
in normal and amputated mouse embryos: an experimental and a theoretical analysis.
J. Embryol. exp. Morph. 45, 189-202.
GEARHART, J. D. & MINTZ, B. (1972). Clonal origins of som ites and their muscle derivatives :
evidence from allophenic mice. Devi Biol. 29, 27-37.
GRUNEBERG, H. (1963). The Pathology of Development. Oxford: Blackwell.
HAMILTON, L. (1969). The formation of somites in Xenopus. J. Embryol. exp. Morph. 22,
253-264.
HERRMANN, H., SCHNIEDER, M. J. B., NEUKOM, B. J. & MOORE, J. A. (1951). Quantitative data on the growth processes of the somites of the chick embryo: Linear measurements,
volume, protein nitrogen, nucleic acids. J. exp. Zool. 118, 243-268.
LEWIS, J. H. (1975). Fate map and the pattern of cell division: a calculation for the chick
wing bud. / . Embryol. exp. Morph. 33, 419-434.
LIPTON, B. H. & JACOBSON, A. G. (1974). Analysis of normal somite development. Devi Biol.
38, 73-90.
MAYNARD-SMITH, J. (1960). Continuous, quantized and modal variation. Proc. R. Soc. B 152,
397-409.
MEDDIS, R. (1975). Statistical Handbook for Non-statisticians. London: McGraw-Hill.
MEIER, S. (1979). Development of the chick mesoblast: formation of the embryonic axis and
establishment of the metameric pattern. De vi Biol. 73, 25-45.
MENKES, B. & S A N D O R , S . (1977). Somitogenesis: regulation potencies, sequence determination
and primordial interaction. In Vertebrate Limb and Somite Morphogenesis (ed. D. A.
Ede, J. R. Hinchliffe & M. Balls), pp. 405-420. Cambridge: Cambridge University Press. PACKARD, D. S. Jr (1978). Chick somite determination: the role of factors in young somites
and the segmental plate. / . exp. Zool. 203, 295-306.
128 P. P . L. T A M
PACKARD, D. S. Jr & JACOBSON, A. G. (1976). The influence of axial structures on chick
somite formation. Devi Biol. 53, 36-48.
PEARSON, M. & ELSDALE, T. (1979). Somitogenesis in amphibian embryo. I. Experimental evidence for an interaction between two termporal factors in the specification of somite
pattern. J. Embryol. exp. Morph. 51, 27-50.
POELMANN, R. E. (1980). Differential mitosis and degeneration patterns in relation to the alterations in the shape of the embryonic ectoderm of early post-implantation mouse
embryos. J. Embryol. exp. Morph. 55, 33-51.
POELMANN, R. E. (1981). The formation of embryonic mesoderm in the early postimplanta
tion mouse embryo. Anat. Embryol. (in the Press).
REINIUS, S. (1965). Morphology of the mouse embryo from the time of implantation to meso
derm formation. Z. Zellforsch, mikrosk. Anat. 68, 711-723.
REVEL, J. P. & SOLURSH, M. (1978). Ultrastructure of primary mesenchyme in chick and rat
embryos. SEM, vol. 2, pp. 1041-1046.
RUGH, R. (1968), The Mouse. Minneapolis: Burgess.
SMITH, L. J. (1964). The effect of transection and extirpation on axis formation and elongation
in the young mouse embryo. J. Embryol. exp. Morph. 12, 787-80.
SNEDECOR, G. W. & COCHRAN, W. G. (1967). Statistical Methods. Iowa University Press.
SNOW, M. H. L. (1977). Gastrulation inthemouse: regionalization of theepiblast. J. Embryol.
exp. Morph. 42, 293-303.
SNOW, M. H. L. & TAM, P. P. L. (1979). \s compensatory growth a complicating factor in
mouse teratology? Nature, Lond. 279, 557-559.
SNOW, M. H. L. & TAM, P. P. L. (1980). Timing in embryological development. Nature, Lond.
286, 107.
SNOW, M. H. L., TAM, P. P. L. & MCLAREN, A. (1981). The control and regulation of size
and morphogenesis in mammalian embryos. Proc. Soc. Devi. Biol. ' Levels of genetic control
in development ' (in the Press).
SOLURSH, M., FrsHER, M., MEIER, S. & SINGLEY, K. T. (1979). The role of extracellular
matrix in the formation of the sclerotome. / . Embryol. exp. Morph. 54, 75-98.
SOLURSH, M. & REVEL, J. P. (1978). A SEM study of cell shape and cell appendages in the
primitive streak region of rat and chick embryos. Differentiation 11, 185-190.
TAM, P. P. L. & SNOW, M. H. L. (1981). Proliferation and migration of primordial germ
cells during compensatory growth in mouse embryos. / . Embryol. exp. Morph, (in the
Press).
TARKOWSKI, A. K. (1959). Experimental studies on regulation in the development of isolated
blastomeres of mouse eggs. Acta Theriologica 2, 251-275.
THIELER, K. (1972). The House Mouse. Berlin: Springer-Verlag.
WADDINGTON, C. H. & DEUCHAR, E. M. (1953). Studies on the mechanism of meristic
segmentation. T. The dimensions of somites. / . Embryol. exp. Morph. 1, 349-356.
WEST, J. D. (1978). Analysis of clonal growth using chimaeras and mosaics. In Development
in Mammals, vol. 3 (éd. M. H. Johnson), pp. 413-460. Amsterdam: North-Holland.
WHITTINGHAM, D. G. & WALES, R. G. (1969). Storage of 2-cell mouse embryos in vitro. Austr.
J. Biol. Sei. 22, 1065-1068.
W I T S C H I , E . (1962). Development: Rat. I. Characteristics of stages In Growth, including
Reproduction and Morphological Development (ed. P. L. Altman & D. S. Dittmer). Fedn Am. Soc. exp. Biol. Washington.
WOLPERT, L., TICKLE, C. & SAMFORD, M. (1979). The effect of cell killing by X-irradiation