Digital Commons @ SPU
Industrial-Organizational Psychology Dissertations Psychology, Family, and Community, School ofSpring March 10th, 2017
Predicting Employee Performance Using Text Data
from Resumes
Joshua D. Weaver
Seattle Pacific University
Follow this and additional works at:https://digitalcommons.spu.edu/iop_etd Part of theIndustrial and Organizational Psychology Commons
This Dissertation is brought to you for free and open access by the Psychology, Family, and Community, School of at Digital Commons @ SPU. It has been accepted for inclusion in Industrial-Organizational Psychology Dissertations by an authorized administrator of Digital Commons @ SPU. Recommended Citation
Weaver, Joshua D., "Predicting Employee Performance Using Text Data from Resumes" (2017).Industrial-Organizational Psychology Dissertations. 9.
Predicting Employee Performance Using Text Data from Resumes Joshua D. Weaver
A dissertation submitted in partial fulfillment Of the requirements for the degree of
Doctor of Philosophy In
Industrial/Organizational Psychology
Seattle Pacific University
April 2017
Approved by: Reviewed by:
Dana Kendall Ph.D.
Assistant Professor, Industrial/Organizational Psychology
Dissertation Chair
Robert B. McKenna Ph.D.
Chair, Industrial/Organizational Psychology
Christopher Roenicke Ph.D.
Assessment & Evaluation Program Manager at Amazon
Committee Member
Katy Tangenberg Ph.D.
Dean, School of Psychology, Family & Community
Ryan C. LaBrie Ph.D. Associate Professor - MIS Committee Member
© Copyright by Joshua Weaver 2017 All Rights Reserved
Acknowledgements
I have been fortunate to be surrounded by a cadre of supporters and advisers who have shaped and continue to shape who I am. These acknowledgments are presented in no particular order. Each of these individuals has had a meaningful (statistically significant) impact on my life, without which I would not be the person I am today…
My advisor, Dr. Dana Kendall. Her unwavering support, passion for truth, theory, and
quantitative prowess have been a source of inspiration, emotional support, and healthy tension throughout this journey.
The SPU faculty who have pushed, pulled, challenged, and supported me over the years. The tools you have given me to make sense of myself, the world and people in organizations have had a huge impact. Keep up the great work.
Kira, for being an academic confidant, a reliable colleague with whom I could discuss our unconventional views of IO psychology and our desire to make a lasting impact on our worlds, and for being a friend to share in the difficulties of graduate school and young professional life. Diana, thanks, roomie. Sharing our love of musicals and upbringing has been a source of support and much laughter.
Katie, for being an awesome co-author and research partner. Her support early on in the Ph.D. program was key to helping me survive those turbulent early years.
Robleh, thanks, roomie. It has been a remarkable experience to support each other over the years and to cheer on our successes and problem solve through setbacks.
Emily, for being a great friend, and happy hour buddy. Who else would I talk to about structural equation modeling while drinking bourbon?
Serena, for being a great friend, who always brings a unique perspective to the world of work or academia. I am looking forward to more spirited conversations in the future.
Matt, who thought meeting on Twitter (will Twitter be relevant in 10 years?) would lead to us being friends 5 years later. Thanks for great times and looking forward to more, even if Twitter ceases to be relevant.
Tyler, Dan, and Aaron for being a much-needed distraction from the crazy-making that can be graduate school. Cheers, mates.
To the rest of the group, outside of graduate school (you know who you are), you guys are awesome, and I would not trade you for anything. Thanks for putting up with me all these years.
Preface
The impetus for this dissertation came in 2011 while working as an entry-level consultant with a local Seattle consulting company. I was assigned to work on a project with an intellectual property firm to help the US Patent Office more quickly process patent applications. In 2011, it took about 3 years for a patent to be officially accepted or rejected. We used text analytics to try and identify patent applications that should be rejected because the idea had already been
patented. Up until that point, I was not aware that text could be used in such a way. I was
fascinated with the potential for text to be analyzed and mined for insight and immediately began considering its application to IO psychology as a tool for automating resume reviews.
Initially, I considered text analytics as a tool to add rigor to keyword searches applicant tracking systems (ATS) used to crudely screen resumes, as well as a way to deliver value to organizations by reducing time spent hiring talent, while also protecting applicants from recruiter or hiring manager bias by doing a “blind” resume review. Truthfully, I was more interested in applying the technique to resumes than extending and building on IO psychology theory. After all, text analytics had been used to identify sex (Cheng, Chandramouli, & Subbalakshmi, 2011), mood (Nguyen, Phung, Adams, & Venkatesh, 2014), and even predict stock prices (Bollen, Mao, Zeng, 2010). My rationale was to use the transitive property to argue that if text analytics could be used for those purposes, why not extend its use to evaluating resumes? However, I knew this would not fly; my advisor would never allow such a flimsy theoretical argument as the basis for a dissertation (…and rightly so I might add).
In digging deeper into IO psychology selection research, I happened upon biodata and immediately saw a connection (albeit a tenuous one) between text analytics and biodata, and the rest—well the rest, as they say, is history…or at least I hope so!
Table of Contents
Acknowledgements ... iii
Preface ...iv
List of Tables ... vii
List of Figures ...ix
List of Appendices ... x
Abstract ...xi
CHAPTER 1 ... 1
Introduction ... 1
Biographical Data ... 2
Defining and describing the biodata method. ... 2
Exploring applicant attributes captured by biodata. ... 2
Limitations of biodata: the conflation of method and construct. ... 3
Biodata summary. ... 4
Text Analytics ... 4
Term frequency using linguistic inquiry and word count software. ... 4
Overview of how LIWC software analyzes text. ... 5
Linking the predictor method to the construct. ... 5
Pronouns as proxies for impression management. ... 6
Verbs as predictors of job performance. ... 7
Emotion words as predictors of organizational citizenship behaviors and counter-productive work behaviors. .. 7
LIWC categories that may serve as proxies for cognitive ability. ... 8
Chapter One Summary and Introduction to the Present Study ... 9
CHAPTER 2 ... 11
Method ... 11
Participants Characteristics, Text Data Characteristics, Sample Size, and Power ... 11
Inclusion and exclusion criteria. ... 11
Working with distributions found in text data. ... 11
Demographic characteristics. ... 12 Sampling Procedures. ... 12 Measures ... 13 Control variables. ... 13 LIWC variables. ... 13 Impression management. ... 14 Verbal intelligence. ... 14 Job performance. ... 15 CHAPTER 3 ... 17 Results ... 17 Data Preparation ... 17
Preparing resume files for analysis. ... 17
Cleaning and preparing survey data. ... 17
Creating the training and holdout samples... 17
Data Diagnostics ... 18
Comparing resume text sparseness to previously reported base rates for LIWC analyzed text. ... 18
Preliminary Analyses... 18 Primary Analyses ... 19 Hypothesis one. ... 19 Hypothesis 2a-c ... 21 Hypothesis 2a. ... 21 Hypothesis 2b. ... 22 Hypothesis 2c. ... 22 Hypotheses 3a-b ... 23 Hypothesis 3a. ... 23 Hypothesis 3b. ... 23 Hypotheses 4a-g ... 24 Ancillary Analyses ... 24 CHAPTER 4 ... 26
Discussion, Limitations, and Future Research ... 26
Summary of Results ... 26
Pronouns as predictors of job performance. ... 26
Verbs as predictors of job performance. ... 27
Positive and negative emotion words as predictors of job performance, contextual performance, and counterproductive performance. ... 27
Word categories that are proxies for cognitive ability. ... 28
Theoretical Implications ... 29
Practical Implications ... 29
Ethical Implications ... 32
Implications of text analytics for employment decisions extend beyond resume data. ... 32
Informed consent and privacy in the era of easy access to mass quantities of candidate information. ... 32
The scope of data employers can use in hiring ... 33
Applicant reactions to using mechanistic approaches in selection decisions. ... Error! Bookmark not defined. Future Research Directions ... 36
Limitations ... 38
Conclusion ... 39
List of Tables
Table 1. Detailed Biodata Research Findings Reproduced from Mumford, Costanza, Connelly, &
Johnson (1996)
Table 2. Overview of Biodata Research Findings
Table 3.Overview of Text analytics and the Marker Word Hypothesis Used in Psychological and
Computer Science Research
Table 4. Descriptive Statistics: LIWC Categories for Hypothesis 2-5 with Base Rate
Comparisons (Sub-Sample)
Table 5. Impression Management Questionnaire (Wayne & Liden, 1995)
Table 6. Spot-The-Word Test (Baddeley et al., 1993)
Table 7. The Individual Work Performance Questionnaire (Koopmans et al., 2013)
Table 8. Overview of Evidence for the Validity and Reliability of the Individual Work
Performance Questionnaire (Koopmans et al., 2013)
Table 9. Benchmark Scores for the Individual Work Performance Questionnaire
Table 10. Descriptive Statistics: Hypothesis Variables by Sex (Full Sample)
Table 11. Descriptive Statistics: Primary Study Variables by Race: White, Asian,
Hispanic/Latino (Full Sample)
Table 12. Descriptive Statistics: Primary Study Variables by Education: Bachelor’s, Master’s,
Some College, Doctorate (Full Sample)
Table 13a. Descriptive Statistics: Tenure (Full Sample)
Table 13b. Descriptive Statistics: Tenure Correlated with Hypothesis Variables (Full Sample)
Table 14. Descriptive Statistics: Hypothesis Variables by Sex (Sub-Sample)
Table 15. Descriptive Statistics: Hypothesis Variables by Race: White, Asian, Hispanic/Latino,
Other (Sub-Sample)
Table 16. Descriptive Statistics: Hypothesis Variables by Education: Bachelor’s, Master’s, Some
College, Doctorate (Sub-Sample)
Table 17a. Descriptive Statistics: Tenure (Sub-Sample)
Table 18. Results of t-Test and Descriptive Statistics for Task Performance by Sex
Table 19. Omnibus ANOVA Results for Task Performance by Race
Table 20. Omnibus ANOVA Results for Task Performance by Education
Table 21. Correlation Matrix of All Study Variables and Control Variables
Table 22. Test for Normality for Predictor Variables
Table 23. Descriptive Statistics: LIWC Categories for Hypothesis 2-5 with Base Rate
Comparisons (Sub-Sample)
Table 24. Logistic Regression Model for Training Data (n = 462)
Table 25. Logistic Regression Model for Testing Data (n = 205)
Table 26. Testing for Significant Differences in B-weights from Training to Test Models
Table 27. Pronouns Correlated with Impression Management
Table 28. Task Performance Regressed on Pronouns
Table 29. Task Performance Regressed onVerbs
Table 30. Task Performance Regressed onPositive Emotion Words
Table 31. Contextual Performance Regressed on Positive Emotion Words
Table 32. Counterproductive Job Performance Regressed on Negative Emotion Words
Regressed
Table 33. Task Performance Regressed on Negative Emotion Words
Table 34. Verbal Intelligence Correlated with Differentiation Words, Conjunctions, and Words
Longer than Six Characters
Table 35. Task Performance Regressed on Differentiation Words, Conjunctions, and Words
Longer than Six Characters, Prepositions, Cognitive Process Words, Causal Words, and Insight Words
Table 36. Task Performance Regressed on Cognitive Ability and the Written Cognitive Ability
List of Figures
Figure 1. Histogram of first-person singular pronouns
Figure 2. Histogram of first-person plural pronouns
Figure 3. Histogram of second-person pronouns
Figure 4. Histogram of third-person singular pronouns
Figure 5. Histogram of third-person plural pronouns
Figure 6. Histogram of impersonal pronouns
Figure 7. Histogram of verbs
Figure 8. Histogram of positive emotion words
Figure 9. Histogram of negative emotion words
Figure 10. Histogram of differentiation words
Figure 11. Histogram of conjunctions
Figure 12. Histogram of words longer than six characters
Figure 13. Histogram of prepositions
List of Appendices
Appendix A: LIWC Word Categories and Example Word for Each Category
Appendix B: Decision Rules for Selecting Independent Variables and LIWC Categories
Appendix C: Validity Evidence for the Spot-The-Word Test
Appendix D: Summary of the Development and Validation Research for the Individual Work
Performance Questionnaire
Appendix E: Sample Output from The LIWC Software
Appendix F: Python Code for Cleaning Up Survey Data
Appendix G: Various Functions of First-Person Plural Pronouns (e.g. we). Adapted from
Joshua David Weaver 346
Abstract
Text analytics using term frequency was proposed as an extension of biodata for predicting job performance and addressing criticisms of biodata and predictor methods—that they do not identify the constructs they are measuring or their predictive elements. Linguistic Inquiry and Word Countsoftware was used to analyze and sort text into validated categories. Prolific Academic was used to recruit full-time workers who provided a copy of their resume and were assessed on impression management (IM), cognitive ability, and job performance. Predictive analyses used resumes with 100+ words (n = 667), whereas correlational analyses used the full sample (N = 809). Third-person plural pronouns, impersonal pronouns, sadness words, certainty words, non-fluencies, and colons emerged as significant predictors of job performance (χ2 = 26.01 (10), p = .006). As hypothesized, impersonal pronouns were positively correlated with self-oriented IM (r = .07, p < .05), and first-person singular pronouns were positively correlated with other-oriented IM (r = .07, p < .05), however, first-person plural pronouns were negatively correlated (r = -.07, p < .05). Pronouns and verbs were not predictive of job performance. Positive and negative emotion words did not show hypothesized relationships to OCBs, CWBs, or job performance. Finally, differentiation words (r = .09, p < .01), conjunctions (r = .28, p < .01), words longer than six characters (r = .29, p < .01), prepositions (r = .20, p < .01), cognitive process words (r = .19, p < .01), causal words (r = .20, p < .01), and insight words (r = .06, p < .05) correlated with cognitive ability, but did not predict job performance. An exploratory
regression analysis in which cognitive ability as measured by the Spot-The-Word Test (β = .10, p
uniquely and significantly predicted job performance (F(1,805) = 18.79, p < .001),
demonstrating that word categories can serve as a proxy for cognitive ability. Overall, the method of text analytics sidesteps some of the limitations of biodata predictor methods, while demonstrating the potential to automate resume reviews and mitigate unconscious bias inherent in human judgment.
CHAPTER 1 Introduction
In the 20 years since scholars at McKinsey and Company coined the term “war for talent” (Chambers, Foulon, Handfield-Jones, Hankin, & Michaels, 1997), the war has not abated.
Rather, it has intensified. Employee selection remains a top strategic imperative for human resources (HR) leaders (Ray et. al., 2012); yet hiring the right individuals remains challenging due time constraints (Bullhorn, 2014; Virgina, 2014) and finances (Galbreath, 2000). Although resume screening is one popular approach for selecting employees, it is only the first step in the process. Applicants must also pass phone screens and structured on-site interviews, to name a few of the typical hurdles in the employee selection process.
In this study, I will integrate evidence and methods from the long-standing study of
biodata in industrial-organizational (IO) psychology, with the relatively new field of text
analytics to make a case for a new method that transforms resume text into quantifiable
predictors of an applicant’s job performance. One benefit of this research is the automation of the resume review process, enabling fast and efficient resume screening at scale. A potential
theoretical contribution is that this new method identifies and quantifies underlying applicant attributes and skills that are job-relevant, by analyzing resumes. I make a case for text analytics as a potential method for employee selection by first defining and describing the biographical data method. Next, I review the applicant attributes captured by biodata that predict job performance, noting that it is unclear which specific constructs are being captured. Next, I describe the text analytics method, highlighting benefits that other scientific fields have gained from using this method. Because text analytics can potentially infer attributes of a person by analyzing their writing, it holds promise for alleviating some of the costs associated with
selecting employees, and the potential for being more effective than human evaluation of resumes. I then explore the possibility of analyzing a resume in a manner that captures an applicant’s job-relevant knowledge, skills, and abilities based on the words used. Finally, I propose a series of hypotheses that test the idea that these word choices can be quantified and used to predict applicants’ future job performance. Ultimately, the goal of this study is to extend existing biodata theory and method and equip HR practitioners with a powerful tool for
employee selection. Biographical Data
Defining and describing the biodata method.The biodata method involves selecting and scoring a set of questions asked of applicants to create an index that will successfully predict outcomes like future job performance (See Table 1 for other criterion examples; Becton,
Matthews, Hartley, & Whitaker, 2009; Cucina, Caputo, Thibodeaux, & MacLane, 2012). Many types of biodata can be solicited from applicants for the purpose of prediction, and resumes are one example (Brown & Campion, 1994; Stokes, Mumford, & Owens, 1994). The biodata method involves collecting information from applicants regarding their developmental experiences and typical behavior, both in and out of the workplace (Becton et al., 2009; Barrick & Zimmerman, 2009; Mael, 1991; Zaccaro, Gilbert, Zazanis, & Diana, 1995). Developmental questions focus on experiences that theoretically shape an individual’s behavior, for example, living abroad
(Zaccaro et al., 1995). An example of a general behavioral question is: “How many non-fiction books did you read in the past year?” (Zaccaro et al.). Finally, an example of a job-related behavior question would be: “How many people have you managed in past jobs?” (Barrick & Zimmerman, 2009; Parish & Drucker, 1957).
attributes, behaviors, and experiences that are theoretically expected to predict their future performance on the job. The primary rationale for this link is that past behavior is the best predictor of future behavior (Owens, 1976; Wernimont & Campbell, 1968) because behavior is shaped by an individual’s values, volitional choices, goals (Mumford & Owens, 1987; Mumford & Stokes, 1992), and perceived membership to social groups (Ashforth & Mael, 1989; Mael, 1991; Mael & Ashforth, 1992). Thus, biodata indirectly captures the aspects of the applicant’s personality and cognitive ability (Dean & Russell; Kilcullen, 1995) that predict job performance (Barrick & Mount, 1991; Hogan & Holland, 2003; Judge et al., 2013; Schmidt & Hunter, 1998; Schmidt & Hunter, 2004).
Limitations of biodata: the conflation of method and construct.In scholarly work, the biodata technique is characterized as a selection method, as opposed to a construct. Selection constructs are specific behavioral domains like personality, whereas selection methods are the techniques by which domain-relevant behavioral information is collected, quantified, and used to select applicants (Arthur & Villado, 2008). Although predictor methods like biodata are useful for identifying predictors of job performance (Allworth & Hesketh, 2000; Becton, Matthews, Hartley, & Whitaker, 2009; Reilly & Chao, 1982; Zaccaro, Gilbert, Zazanis, & Diana, 1995), the nature of the constructs they actually capture remain unidentified (Lievens & Patterson, 2011; Shultz, 1996). This stymies the progress of scholarly and applied work because we remain ignorant to the specific predictor constructs that are being captured by a particular method. For instance, in the case of biodata and resumes, we do not know exactly which applicant
characteristics are driving performance—all we know is that something is driving it. The current study represents a step toward making this link explicit by examining if applicants’ choice of words can serve as indirect indicators of predictors of performance such as cognitive ability.
Biodata summary.In summary, the biodata method is useful for predicting job
performance and thus is a promising method for selection (see Table 2 for additional evidence of this). To improve its effectiveness and reduce its limitations, we need more efficient, objective ways to aggregate and quantify job-relevant applicant data provided on resumes. Text analytics represents a potential way to achieve these goals simultaneously.
Text Analytics
Text analytics refers to methods used to identify patterns and relationships within text (Hotho, Nurnberger, & Paab, 2013). For a detailed discussion of text analytics methods see Aggarwal and Zhai (2012). The text analytic technique employed in this study is term frequency. Term frequency refers to the process of counting the number of times a word appears in a
document (Hotho et al., 2005). This number is then used to predict the personal characteristics or future behavior of the document’s author. This technique has been used in clinical psychology to diagnose patients (Oxman, Rosenberg, Schnurr, & Tucker, 1988), and in other fields (see Table 3). The utility of text analytics in clinical psychology (e.g., Oxman et al., 1988) and other fields, suggests that text analytics may benefit IO psychology by providing the missing link between method and construct, thereby yielding an empirical approach to linking certain words to job performance. Therefore, I hypothesize the following:
Hypothesis 1: Variables derived from term frequency text analytics will add explanatory power above and beyond control variables to differentiate high job performers from low job performers.
Term frequency using linguistic inquiry and word count software.This study used Linguistic Inquiry and Word Count(LIWC) software (Pennebaker, Boyd, Jordan, & Blackburn, 2015; Pennebaker, Chung, Ireland, Gonzales, & Booth, 2007) to analyze text. The software was
originally developed to “analyze the emotional, cognitive, and structural components of
individuals’ verbal and written speech” (Pennebaker et al., 2007, p. 3), and contains 6,400 words, word stems, and select emoticons grouped into over 80 categories (Pennebaker, Boyd et al., 2015, pp. 3-4, 11-12). These words and word stems have been curated and agreed upon by independent judges (see Pennebaker et al., 2007; Pennebaker, Boyd et al., 2015; Tausczik & Pennebaker, 2010 for detailed information on the development of LIWC). The major categories include: (a) linguistic processes such as articles and pronouns, (b) psychological processes (e.g., positive and negative emotion), (c) personal concerns like work and leisure, (d) spoken
categories for example assent and fillers, as well as (e) punctuations such as commas and periods. See Appendix A for examples of words in these categories.
Overview of how LIWC software analyzes text.The Linguistic Inquiry and Word Countsoftware counts the number of times each of the 6,400 words, word stems, and select emoticons occur across the 80 plus categories and sub-categories in each document. Because words can be categorized into multiple categories, the final output is the percentage of words in each category for a given text (Tausczik & Pennebaker, 2010). For example, the word sad can be placed in the following categories: Sadness, negative emotion, overall affect, and adjective. Sad
would increase the count in each of these categories by one, and the integer value of these categories would be divided by the total number of words in the text to arrive at a final percentage of words in the text for a given category.
Linking the predictor method to the construct.Beyond transforming resume data into quantifiable predictors of an applicant’s job performance, text analytics provides a way to link predictor method and predictor construct by identifying specific word types (e.g. conjunctions) as proxies for known predictors of job performance. For example, rather than administering a
direct assessment of an applicant’s cognitive ability, selection practitioners may be bale to use text analytics to infer the level of cognitive ability from the content of a resume. In the following sections, I identify and describe several specific LIWC word categories that are likely to predict job performance. In addition, I contend that some of these categories may be proxies for specific predictor constructs such as impression management and cognitive ability. The LIWC categories reviewed are: (a) pronouns, (b) verbs, (c) positive emotion words, (d) negative emotion words, (e) differentiation words, (f) conjunctions, (g) words longer than six characters, (h) prepositions, (i) cognitive process words, (j) causal words, and (k) insight words.
Pronouns as proxies for impression management.Pronouns (e.g., I, we, you, etc.) have been linked to impression management (IM) styles (Ickes, Reidhead, & Patterson, 1986;
Tausczik & Pennebaker, 2010), and IM is positively related to job performance (Wayne & Liden, 1995; Huang, Zhao, Niu, Ashford, & Lee, 2013). Taken together, this suggests that pronouns may be proxies for IM. Impression management is defined as “behaviors individuals employ to protect their self-image and influence the way they are perceived by important others” (Wayne & Liden, 1995, p. 232). Use of first-person pronouns (e.g., I, me) have been found to be positively associated with a self-IM style (Ickes et al., 1986)—a style characterized by IM tactics designed to bring others’ behavior in line with one’s own objectives. While second- and third-person pronouns (e.g., you, your, he, she) are correlated with an “other”-IM style; a style
characterized by IM tactics intended to curry approval from others and align one’s own behavior to the goals and objectives of others. Given the findings in text analytic research linking
pronouns to these IM styles (Ickes et al., 1986) and the association between IM and job
performance (Wayne & Liden, 1995; Huang et al., 2013) I proposed the following hypothesis.
with (a) self and other impression management styles, and (b) job performance behaviors.
Verbs as predictors of job performance.Verbs are associated with a thinking style called “categorical thinking” (Pennebaker, 2011; pp. 285-286). This style is methodical, structured, and impersonal and predictive of academic success (i.e. GPA; Pennebaker, 2011; Pennebaker, Chung, Frazee, Lavergne, & Beaver, 2014). Although Pennebaker (2011) refers to this as a thinking style, it is clear from his description that this thinking style is not synonymous with cognitive ability. Given that resumes and biodata are theorized to tap into specific skills and abilities (Mumford & Owens, 1987; Mumford & Stokes, 1992), it stands to reason that the verbs in a resume may be related to job performance, given their link to academic achievement
(Pennebaker et al., 2014).
Hypothesis 2c: The number of verbs used in resumes will positively predict job performance.
Emotion words as predictors of organizational citizenship behaviors and counterproductive work behaviors.Prior text analytic work using LIWC has shown that positive and negative emotions can be extracted from text (Nguyen, Phung, Adams, &
Venkatesh, 2014). Thus, it is worthwhile to investigate whether positive and negative emotion can also be extracted from resumes. Doing so could enable the prediction of work outcomes such as organizational citizenship behaviors (OCBs) and counterproductive work behaviors (CWBs). Organizational citizenship behaviors are positive employee actions that extend beyond the scope of an individual's formal job description. Examples of OCBs include staying late to help a colleague or volunteering for extra assignments, whereas counterproductive work behaviors harm an organization (e.g., bullying, incivility, etc.). According to a prior meta-analysis, positive
mood is positively related to both job performance (ρ = 0.19) and OCBs (ρ = 0.23; Kaplan, Bradley, Luchman, & Haynes, 2009). Conversely, negative mood is negatively associated with job performance (ρ = -0.21) and positively related to CWBs (ρ = 0.30). Given that authors’ moods can be ascertained from their writings (Nguyen et al., 2014) and moods have been demonstrated to predict work outcomes (Kaplan et al., 2009), I hypothesized the following:
Hypothesis 3a: Positive emotion words will positively predict job performance and OCBs.
Hypothesis 3b: Negative emotion words will negatively predict job performance and positively predict CWBs.
Accompanying Hypothesis 3 is a caveat. Conventional wisdom recommends eliminating emotional language from resumes (Knouse, 1994, Koeppel, 2002). Thus, it is possible that positive and negative emotion words will not show up on resumes in sufficient quantities to be useful predictors of performance indicators.
LIWC categories that may serve as proxies for cognitive ability.Researchers have identified seven LIWC categories as indicators of cognitive complexity (Pennebaker, Boyd, et al., 2015; Pennebaker & King, 1999; Pennebaker, Mehl, & Niederhoffer, 2003; Tausczik & Pennebaker, 2010). They are: (a) differentiation words, (b) conjunctions, (c) words longer than six characters, (d) prepositions, (e) cognitive process words, (f) causal words, and (g) insight words. Conjunctions are used by writers when creating a narrative thread, and exclusion words are used to make distinctions between categories of things (e.g. political candidates in political ads; Tausczik & Pennebaker, 2010), whereas prepositions appear with greater frequency in the discussion section of a journal in which authors are integrating current and past findings (Hartley, Pennebaker, & Fox, 2003). Similarly, causal and insight words indicate cognitive
processing and reappraisal of an event or idea (Pennebaker, Mayne, & Francis, 1997). Although researchers refer to these seven LIWC categories as indicators of cognitive complexity (Pennebaker, Boyd et al., 2015; Pennebaker & King, 1999; Pennebaker, Mehl, & Niederhoffer, 2003; Tausczik & Pennebaker, 2010), their descriptions are better characterized as indicators of meta-cognition that reflect an aspect of cognitive processing rather than cognitive ability. Nevertheless, this body of research leads to a logical and intuitive question—do these categories reflect actual underlying cognitive ability?
This question is particularly pertinent to employee selection because cognitive ability has been consistently found to be one of the best predictors of job performance (Schmidt & Hunter, 1998; Schmidt & Hunter, 2004; Hunter & Hunter, 1984). Thus it is useful to explore whether cognitive ability can be measured by proxy via text analytics. This would allow selection
practitioners to infer cognitive ability from a resume via text analytics and potentially obviate the need to administer a cognitive ability measure.
Hypothesis 4a-g: The frequency of words that fall into LIWC categories (a)
differentiation words, (b) conjunctions, and (c) words longer than six characters, (d) prepositions, (e) cognitive process words, (f) casual words, and (g) insight words, can be used as proxies of verbal intelligence; and consequently, positively predict job
performance.
Chapter One Summary and Introduction to the Present Study
In summary, biodata is a promising method for selection (see Table 2); however, one of its primary liabilities is a lack of clarity between the specific applicant attributes being captured and their empirical links to job performance (Lievens & Patterson, 2011; Shultz, 1996). Text analytics represents a technique to potentially improve biodata’s effectiveness and reduce its
limitations by using an objective method for aggregating and quantifying applicant data provided in resumes. In this investigation, I examine whether text analytics is capable of extracting job-relevant individual differences that can be empirically linked to current levels of job
CHAPTER 2 Method
Participants Characteristics, Text Data Characteristics, Sample Size, and Power
Inclusion and exclusion criteria.Data collection occurred between November 2015 and January 2016. One thousand, five participants provided data (N = 1,005). To be included,
participants had to be at least 18 years of age and work more than 32 hours a week. Of the 1,005 participants who completed the survey, 196 provided unusable data and were excluded.
Participants were excluded if any of the following conditions were met: (a) the participant did not provide a resume (i.e. submitted blank files or a file that was not a resume), or (b) the resume provided was not in a format that could be analyzed (e.g., resume was not written in English). In summary, 809 participants provided usable data, meeting the minimum sample size needed for tolerable statistical power based on a power analysis (Faul, Erdfelder, Buchner, & Lang, 2009).
Working with distributions found in text data.The nature of written speech means that text data is sparse; ideas, words, and phrases are not repeated more times than necessary in times in a conversation or a document (Pennebaker et al., 2015). This results in non-normal data that has a stark positive skew and is leptokurtic. This shape is common in text analytics (see Corral, Boleda, & Ferrer-i-Cancho, 2015; Piantadosi, 2015) and is addressed by setting a minimum number of words per document ranging from 100 – 1,000 depending on the analyses (see Mahmud, 2015; Schultheiss, 2013; Schwartz et al., 2013), and log transforming the data (Tabachnick & Fidell, 2013). Sample sizes greater than 200 do not require transformations for kurtosis (Waternaux, 1976). For the regression analyses resumes with fewer than 100 words were not included. However, to maximize power, all 809 resumes were included in correlation analyses. This exclusion was applied for the regression analyses, but not for the correlation
analyses, because regression models require more robust estimates of central tendency when modeling data (Field, 2009).
Demographic characteristics. For the full sample (N = 809), most participants were white (n = 512, 63% of the final sample), a majority were males (n = 529, 65% of the final sample), the most common level of academic achievement was an undergraduate degree (n = 356, 44% of the final sample), and average tenure was 3.5 years (SD = 3.52). These proportions remained the same for the logistic-regression subsample (n = 667). Most were white (n = 462, 69% of the sub-sample), a majority were males (n = 407, 61% of the sub-sample), the most common level of academic achievement was an undergraduate degree (n = 325, 49% of the sub-sample), and average tenure was 3.4 years (SD = 3.52). A detailed exploration of demographics for the total sample can be explored online.
Sampling Procedures.Participants were recruited online using Prolific Academic (Bradley & Damer, 2014), a cloud-based participant recruitment platform that is similar to Amazon’s Mechanical Turk, but built specifically for social science research by researchers from the University of Sheffield and backed by the University of Oxford. Given the similarities
between Prolific Academic and Amazon’s Mechanical Turk and the intent of the platforms, it was assumed that the same findings on Mechanical Turk applied to Prolific Academic, namely that Prolific Academic participants were (a) similar to participants recruited using traditional approaches (Buhrmester, Kwang, & Gosling, 2011; Goodman, Cryder, & Cheema, 2013), (b) representative of the larger population researchers wished to study (Buhrmester et al., 2011; Paolacci, Chandler, & Ipeirotis, 2010), and (c) able to provide data of quality and integrity equivalent to data obtained by traditional approaches (Buhrmester et al., 2011; Chandler, Mueller, & Paolacci, 2013; Goodman et al., 2013). Participants were paid $1.56 (USD) for
completing the study. Average completion time was 17 minutes. Participants consented to the study and then clicked on a link, which opened the survey. They were asked to share a copy of their resume, they answered demographic questions (sex, race, education, tenure), and completed the following assessments: (a) 18-item self-reported job performance behavior assessment, (b) 10-item impression management assessment, and (c) 60-item verbal intelligence assessment. Measures
Control variables. Control variables included: (a) sex, (b) race, (c) education, and (d) tenure. These control variables were selected based on their links to job performance
demonstrated in prior research (Ng, Eby, Sorensen, & Feldman, 2005).
LIWC variables. Seventeen LIWC variables were used as predictors for Hypotheses 2-4.
Table 4 reports their means, standard deviations, skew, and kurtosis, as well as information on the average base rates identified by Pennebaker et al. (2015). Example words for these categories can be found in Appendix A. In general, base rates reported by Pennebaker, et al. for the word categories proposed in Hypotheses 2-5 are higher than those found in this study. Words longer than six characters were the notable exception this category, making up 40.18 percent of all word categories in resumes, as opposed to only 15.60 percent across the writing contexts such as blogs, books, and news articles analyzed in by Pennebaker et al. This is not surprising, given that resumes constitute a writing context with relatively well-defined parameters and objectives, and where longer and more descriptive words are encouraged. Thus, it is intuitive that the base rates for the resumes sampled in this study would be dissimilar to the base rates reported by
Pennebaker et al. Additionally, LIWC contains both categories (i.e., cognitive process word category) and sub-categories (insight words, causal words, etc.) of words. I conducted analyses to determine if sub-categories should be rolled up to the higher-order category. The details of
these decision rules and the results of these analyses can be found in Appendix B.
Impression management. Impression management was assessed using a 10-item scale developed by Wayne and Liden (1995). This measure was chosen because it captured both self- and other-oriented impression management in a workplace context and was longitudinally related to job performance (Wayne & Liden, 1995). See Table 5 for a list of all items for this scale. Participants were asked to report how often they had engaged in 10 impression
management behaviors during the past three months using a 7-point scale ranging from 1 (never)
to 7 (always). Scores for each subscale were summed to yield an overall score for each type of impression management behavior (supervisor or self). Higher values indicated greater
impression management. Cronbach’s alpha (Cronbach, 1951) was 0.87 for the supervisor-focused impression management subscale and 0.84 for the self-supervisor-focused impression management subscale. Examples of supervisor-focused impression management items include “To what extent do you praise your immediate supervisor on his or her accomplishments?” and “To what extent do you take an interest in your supervisor's personal life?” Examples of self-focused impression management items include “To what extent do you let your supervisor know that you try to do a good job in your work?” and “To what extent do you work hard when you know the results will be seen by your supervisor?”
Verbal intelligence. Verbal intelligence is language-based skills that reflect general latent cognitive abilities (Dawson, 2013). Verbal intelligence was measured using the spot-the-word test (Baddeley et al., 1993; STW; Cronbach’s α = .87). See Table 6 for a list of all items.
Participants were presented with 60 pairs of words and asked to select the word in each pair that was the real word. Scores on the STW ranged from 0-60 and were derived by summing the number of correct word choices. See Appendix C for additional validity evidence.
Job performance. Self-reported job performance behaviors were measured using the Individual Work Performance Questionnaire (IWPQ; Koopmans et al., 2013; Koopmans et al., 2015), an 18-item measure that assesses task performance (5 items; Cronbach’s α = .87),
contextual performance (8 items; Cronbach’s α = .85), and counter-productive work behaviors (5 items; Cronbach’s α = .87). See Table 7 for the full list of items and scales in the IWPQ. Task performance are those behaviors that directly support the conceptualization, design, creation, and dissemination of an organization’s products and services (e.g., writing computer code, designing marketing materials; Motowidlo & Van Scotter, 1994). Contextual performance supports the organizational, social, and psychological environment in which the development and distribution of the organization's products and services occur (Motowidlo & Van Scotter). These include pro-social behaviors such as taking on extra tasks that are not formally part of the job, volunteering to help coworkers, etc. Counterproductive work behaviors are those behaviors that harm an organization and people in the organization such as bullying etc. (Kaplan et al., 2009).
Given the applied nature of this research, I primarily focused on task performance as the outcome, except where other outcomes were specified (e.g., OCBs). Such a focus makes sense in a selection context, where one is selecting for job performance rather than a proclivity for OCBs or CWBs. In addition, biodata research has primarily focused on predicting task performance. As such, the inclusion of OCBs and CWBs that were not specified a priority would not directly contribute to building biodata theory.
The IWPQ was chosen for its close alignment with Campbell’s (2012) model of job performance, along with its reliability and validity (Koopmans et al., 2013; Koopmans, Bemaards, Hildebrandt, van Buuren et al., 2014; Koopmans, Coffeng et al., 2014; Landers & Callan, 2014) and suitability for use in cross-sectional research (Koopmans, Coffeng et al.).
Examples of items include “I managed to plan my work so that it was done on time” (task performance), “I started new tasks myself when my old ones were finished” (contextual
performance, OCB), and “I complained about minor work-related issues at work” (CWB). Scale items, reliability and validity evidence, and scale anchors/scoring procedures can be found in
CHAPTER 3 Results Data Preparation
The final dataset was created by merging the results of the LIWC output file, which is the result of processing participants’ resumes (see Appendix E for an example of the LIWC output) with the survey data, which included job performance, impression management, verbal
intelligence, and demographic data.
Preparing resume files for analysis. The LIWC software has the capacity to process Portable Data Files (PDFs, .pdf file extension), Microsoft Word files (.doc and .docx file extensions) and plain text files (.txt file extension). Since LIWC cannot process text from an image file (e.g., jpg, .png, .gif, etc.), the twenty-four resumes that were submitted as image files were transcribed by hand as text files (.txt) for processing and analyses by LIWC. Additionally, approximately 30 text-type files (.doc, .docx, .pdf) had view/read permissions associated with them that had to be removed before they could be processed and analyzed.
Cleaning and preparing survey data. Data preparation also included creating a dataset structured for analysis and online visualization in Tableau (2015). I converted the data from a wide format (each row represents a participant and each column a variable or survey item) to a long format, in which all numeric values were placed in a single column with a second column containing their respective labels. Categorical variables were not restructured.
Creating the training and holdout samples. The logistic regression subsample (n = 667) which represented resumes with more than 100 words was split into a training and holdout samples following standard biodata assessment development procedures (e.g. Cucina et al., 2012; Dean, 2013). Seventy percent of the data were randomly selected for the training sample,
whereas the remaining 30% of cases were assigned to the holdout sample using a feature in SPSS (Version 23; IBM, 2015) that produces a random sample of cases.
Data Diagnostics
As mentioned in the working with distributions found in text data section, the distribution of text data is usually positively skewed and leptokurtic. An inspection of the skewness and kurtosis metrics in (see Tables 10-164) demonstrated this to be the case for the current study’s
data. A plurality of the predictor variables showed positive skew above the ±2 threshold and was primarily leptokurtic in width (Field, 2009). The Kolmogorov-Smirnov test and the Shapiro-Wilk tests were used to confirm this (see Table 22). To mitigate the significant positive skew of the variables in the logistic regression analyses, all LIWC predictor variables were
log-transformed, following recommendations in Tabachnick and Fidell (2013).
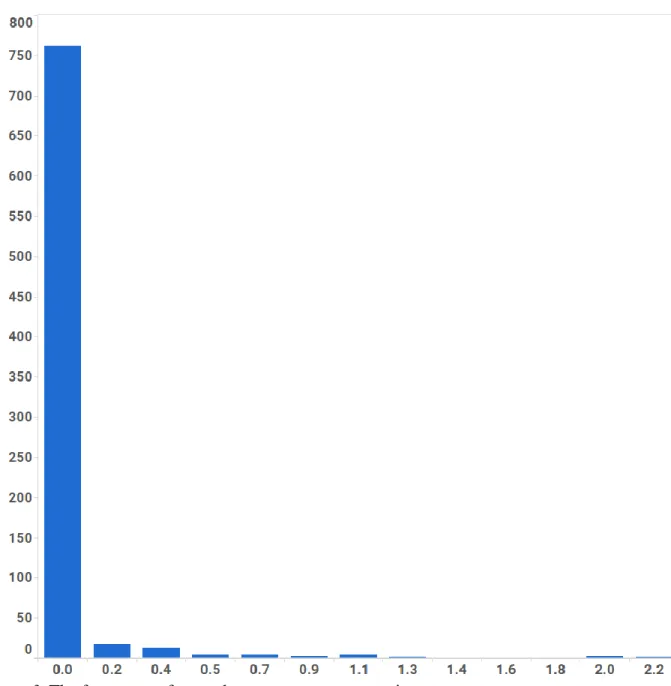
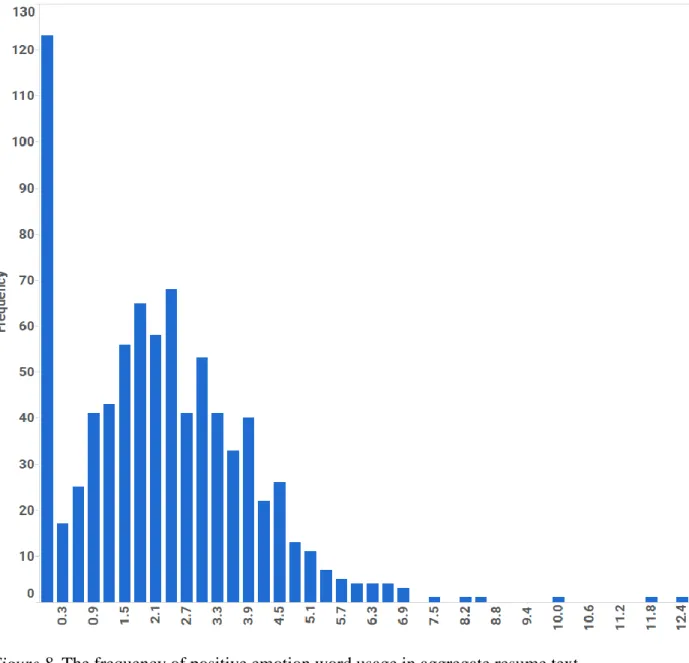
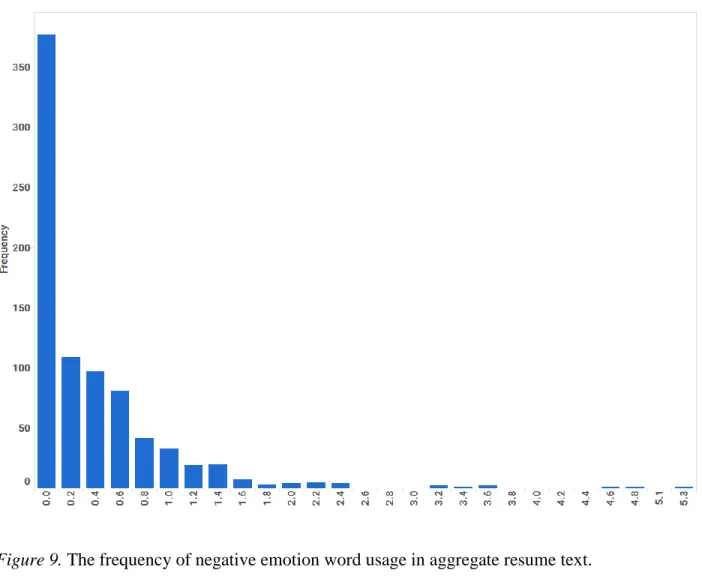
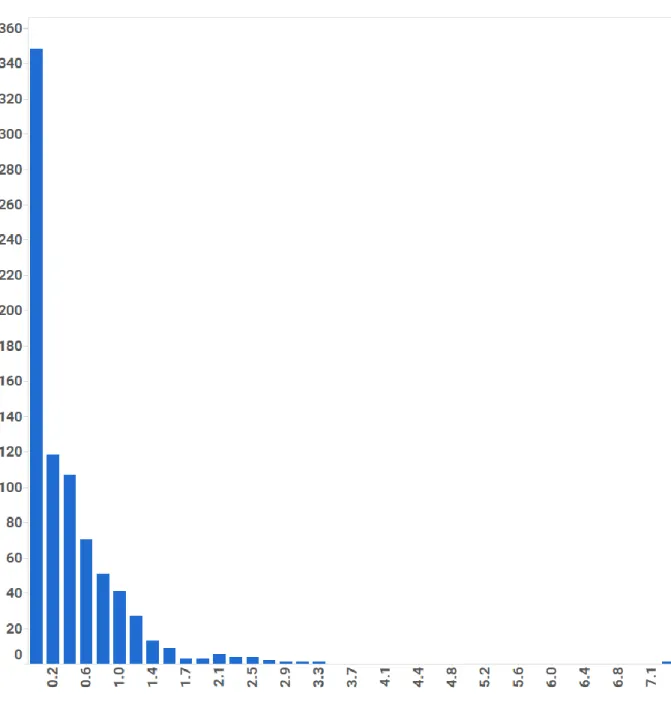
Comparing resume text sparseness to previously reported base rates for LIWC analyzed text. As noted previously, text data for this study was sparse—perhaps because resume writing is restricted to a very specific context (i.e. the workplace), and brevity and clarity are typically prioritized over lengthy and descriptive prose. Visual inspection of the histograms for the 17 LIWC categories used in the present study illustrates this (see Figures 1-14). This can also be observed by comparing the average word category usage for resumes against the base rates reported by Pennebaker et al. (2015; see Table 4 and Table 23).
Preliminary Analyses
Descriptive statistics for the control variables (sex, race, education, & tenure) are
summarized in Tables 10-13b. Tables 14-17b summarize the demographics for the subset of data that was used in the logistic regression analyses (i.e., Hypothesis 2a-b, Hypothesis 2c,
Empirical linkages of the control variables to job performance was confirmed by running an independent samples t-test (sex), one-way analysis of variances (ANOVA; race and
education), and bivariate correlations (tenure) with task performance as the outcome (dependent variable). Female participants reported more task performance behaviors than males (t(391) = -3.65, p < .001, see Table 18). There were no statistically significant differences for race, F(4, 388) = 1.84, p = .121 (see Table 19), or education F(7, 385) = 0.31, p = .950 (see Table 20). Tenure was not significantly correlated with task performance (r = -.09, p = .069, see Table 13b
and Table 17b).
Bivariate correlations are provided in Table 21. Overall, correlations were in the expected directions. Salary as expected, was positively and significantly correlated with age (r = .19, p < .01), education (r = .19, p < .01), and tenure (r = .20, p < .01). While cognitive ability as measured by the spot-the-word test showed expected relationships with task (r = .17, p < .01) and counterproductive work behaviors (r = -.16, p < .01). Additionally, task performance as measured by the IWPQ showed expected positive correlations with key primary study variables: words longer than six characters (r = .15, p < .01), prepositions (r = .16, p < .01), conjunctions (r
= .19, p < .01), positive emotion words (r = .12, p < .01), and cognitive process words (r = .13, p
< .01).
Primary Analyses
Hypothesis one. To test the proposition that word categories can be employed to classify individuals into high and low job performance categories, a logistic regression model was fitted to the data and tested using the cross-validation procedure described in the creating training and holdout samples section. Backward logistic regression was used for variable selection after entering the covariates. Any job performance score of 3.0 or higher was designated as high
performance, whereas any score less than 3.0 was designated as low job performance. Sex was included as a covariate, and it was a significant predictor in block one (-2 LL [log-likelihood] = 593.51; χ2 (1) = 13.27, p < .001). Tenure was not a significant covariate once task performance was dichotomized and was thus excluded from the logistic regression model for parsimony and to conserve degrees of freedom.
Using covariates in logistic regression requires checking for statistical differences in log-likelihood between two models: one model that includes all focal variables and one model that includes only control variables. In this case, the test is to see if the focal variables selected using backward logistic regression resulted in a lower LL score, as opposed to using sex alone. Log-likelihood is an indication of the badness of fit; thus, the lower the number, the better the model fit of the data (Field, 2009). Checking for a significant difference between the models (control variables v. focal variables) requires subtracting the LL score from the control variable model from the log-likelihood in the focal variable model. This result and the degrees of freedom in the focal variable model is then compared with the chi-square distribution to ascertain if the score exceeds the critical chi-square value needed to be statistically significant.
For hypothesis one, the focal variables yielded a significantly improved model over sex alone on the training data set (n = 462) with an LL of 549.30 compared to an LL of 593.51 when using sex. Significance was determined by subtracting the LL of the first model with sex from the final model with all relevant variables. Thus 593.51 - 549.30 = 44.21 with 10 degrees of freedom, one degree of freedom for each additional variable included in the model, resulted in χ2
critical = 25.19, p =.005, suggesting the 10 additional variables added significant explanatory power and model fit (final model with sex and 10 additional variables: χ2 (11)= 549.30, p < .001, see Table 24).
The 10 variables fit to the training data set included third-person plural pronouns, impersonal pronouns, auxiliary verbs, adverbs, sadness words, certainty words, non-fluencies, colons, dashes, and parentheses. These same variables were applied to the holdout sample of the data (n = 205). The model retained significance χ2 = 26.01 (10), p = .006, see Table 25. To evaluate whether the 10 variables remained statistically significant predictors, I tested the difference between the B weights from the training and test data following the method
recommended by Cohen, Cohen, West, and Aiken (2003). Table 26 presents the results of this test (Soper, 2016; Cohen et al., 2003). The test checks to see if the significant predictors from the training sample become insignificant in the hold-out sample. A value of less than 0.05 indicates that a specific predictor was no longer a statistically significant predictor in the holdout sample. Only sex, third-person plural pronouns, impersonal pronouns, sadness words, certainty words, non-fluencies, and colons remained statistically significant predictors in the testing sample. Overall, the results suggest that word categories can be used to classify individuals into high and low job performance categories; therefore, Hypothesis 1 was supported.
Hypothesis 2a-c
Hypothesis 2a. For Hypothesis 2a, I proposed that use of pronouns in individual resumes
would be positively related to self and other impression management styles. The data showed that impersonal pronouns (e.g., it, its, those) were positively correlated with self-oriented
impression management, whereas first-person plural pronouns (e.g.,we, us, our) were negatively correlated with self-oriented impression management. First-person singular pronouns (e.g., I, me, mine) usage was positively correlated with other-oriented impression management. See Table 27
for correlation results. In sum, the results were consistent with the expectation that pronoun use would positively predict impression management, except that first-person plural pronouns
negatively predicted self-oriented impression management. Thus, Hypothesis 2a received partial support.
Hypothesis 2b. I predicted that the prevalence of pronouns in applicants’ resumes would positively predict self-reported job performance. Results of the hierarchical regression analysis for Hypothesis 2b regressing task performance on pronoun word categories are presented in
Table 28. The control variables, sex, and tenure were added as the first step in the regression model, and the log-transformed pronoun predictors (first-person singular pronouns, first-person plural pronouns, second-person pronouns, third-person singular pronouns, third-person plural pronouns, and impersonal pronouns) were added. See Appendix A for example words in each of these categories. Interpreting log-transformed (natural log) predictors are similar to the
interpretation of non-log transformed predictors, except that coefficients are interpreted as percent changes. That is, a one percent increase in the predictor variable(s) either increases or decreases the dependent variable by (coefficient/100) units (UCLA Statistical Consulting Group, n.d.). Taking tenure as an example, a one percent increase in tenure would result in a -0.00018 decrease in job performance (-0.018/100).
The pronoun predictors accounted for a non-significant amount of variance in task performance (∆R2 = .010, p = .312); therefore, Hypothesis 2b was not supported. Because no types of pronoun variables emerged as significant predictors, I did not explore simple regression models using individual pronoun variables.
Hypothesis 2c. Hypothesis 2c predicted that verbs were positively predictive of job performance. Results of the hierarchical regression analysis for Hypothesis 2c for task
performance regressed on verbs are presented in Table 29. The control variables, sex, and tenure were added as the first step in the regression model, and the log-transformed verb variable was
added as the second step. The addition of the verb predictor did not account for additional variance over sex or tenure (∆R2change = .000, p = .818); hypothesis 2c was not supported. Hypotheses 3a-b
Hypothesis 3a. For hypothesis 3a, I proposed that positive emotion words would positively predict task and contextual performance. Results for this hierarchical regression analysis are presented in Tables 30 and 31. For task performance, the control variables, sex, and tenure were added as the first step in the regression model, and the log-transformed positive emotion word predictor was added as the second step. The positive emotion variable (CI [-0.176, 0.421] for B weights) did not account for a significant portion of task performance variability.
For contextual performance, the control variable, sex, was added as the first step in the regression model, and the log-transformed positive emotion word predictor was added as the second step. The positive emotion variable (CI [-0.241, 0.391] for B weights) resulted in a non-significant amount of variance in contextual performance. In summary, positive emotion words did not significantly predict either task or contextual performance; thus, Hypothesis 3a was not supported.
Hypothesis 3b. For Hypothesis 3b, I proposed that negative emotion words would positively predict counterproductive job performance and negatively predict task performance. Results of the simple regression analysis for Hypothesis 3b are presented in Table 32 and Table 33. For counterproductive performance, negative emotion words (CI [-0.923, 0.091] for B
weights) did not positively predict counterproductive job performance. Negative emotion words (CI [-0.061, 0.135] for B weights) also did not negatively predict job performance. Thus,
Hypotheses 4a-g
Hypotheses 4a-g predicted that (a) differentiation words, (b) conjunctions, and (c) words longer than six characters, (d) prepositions, (e) cognitive process words, (f) causal words, and (g) insight words, can be used as proxies of verbal intelligence; and consequently, they will
positively predict self-reported job performance (see Appendix A for example words for each of the categories).
Results indicated that verbal intelligence was significantly related to differentiation words (r = .09, p < .001; supporting Hypothesis 4a), conjunctions (r = .28, p < .001; supporting
Hypothesis 4b), words longer than six characters (r = .29, p < .001; supporting Hypothesis 4c), prepositions (r = .19, p < .001; supporting Hypothesis 4d), cognitive process words (r = .19, p < .00; supporting Hypothesis 4e), and insight words (r = .06, p < .05; supporting Hypothesis 4g). In contrast, the use of prepositions and causal words were not significantly related to verbal ability (see Table 34 for bivariate results). However, when job performance was regressed on these word categories (controlling for sex and tenure), none of these word categories were statistically significant predictors (see Table 35). In summary, although many of the proposed LIWC word categories were positively associated with verbal ability, they were not effective predictors of job performance. Therefore, Hypotheses 4a-g received partial support.
Ancillary Analyses
As noted in chapter 1, research on the LIWC categories (a) differentiation words, (b) conjunctions, and (c) words longer than six characters, (d) prepositions, (e) cognitive process words, (f) casual words, and (g) insight words leads to the question of whether these categories are capable of reflecting an individual’s cognitive ability. This is relevant to employee selection because cognitive ability is one of the best predictors of job performance (Schmidt & Hunter,
1998; Schmidt & Hunter, 2004; Hunter & Hunter, 1984). The analyses shown in Table 34
suggest a connection between these text categories and cognitive ability. However, this evidence on its own does not confirm that these text categories are proxies for cognitive ability that can predict performance. To test this directly, I conducted a regression analysis, in which cognitive ability and a composite score of the 5 LIWC categories used in Hypothesis 4 simultaneously predicted task performance. This composite score or Written Cognitive Ability Index (WCAI) was created by taking the average of the sum of the LIWC categories: (a) differentiation words, (b) conjunctions, (c) words longer than six characters, (d) prepositions, and (e) cognitive process words. The lower order word categories under cognitive process words (i.e. casual and insight words) were excluded. The WCAI was calculated as follows: Mean(differentiation words + conjunctions + words longer than six characters + prepositions + cognitive process words). I ran an ordinary least squares regression analysis in which gender was controlled. Results indicated that both verbal ability (B = 0.007, p = .005) and the WCAI (B = 0.030, p < .001) significantly predicted job performance (see Table 36). Specifically, a one-point increase on the cognitive ability test (spot-the-word test) translates to an increase in job performance by 0.007, and an increase of one point on the WCAI was associated with a 0.030 increase in job performance. Thus, given that both cognitive ability and the WCAI positively predicted job performance, it can be tentatively inferred that the WCAI can serve as a proxy for cognitive ability and potentially preclude the necessity of costly cognitive ability assessments.
CHAPTER 4
Discussion, Limitations, and Future Research
Summary of Results
The overall objective of this research was to investigate the potential to analyze resumes using text analytics to capture job-relevant traits (e.g. cognitive ability), and then empirically link these attributes to job performance. The findings of the current study indicate that the text
analytics method is potentially useful for accomplishing these objectives. Specifically, third-person plural pronouns, imthird-personal pronouns, sadness words, certainty words, non-fluencies, and colons (See Appendix A for examples of these word categories) emerged as key predictors, differentiating high and low performers. This research also evaluated whether or not specific word categories (e.g., cognitive process words) could function as proxies for known predictors of job performance (e.g., cognitive ability).
Pronouns as predictors of job performance. Pronouns were hypothesized to be predictive of performance based on prior research that suggested they were proxies for
Impression management (Ickes et al., 1986; Tausczik & Pennebaker, 2010), and research
showing that IM was predictive of job performance (Wayne & Liden, 1995; Huang et al., 2013). The present study did not find support for this (see Table 28).
However, some pronoun types were correlated with IM (see Table 27), although not all correlations were in the expected direction. First person plural pronouns (we, us, our, etc.) were
negatively correlated with self-impression management. Whereas this runs counter to prior findings such as Ickes et al.(1986), it is in line with more recent research suggesting that
individuals who are less devious tend to use more inclusive language like we, us, etc. (Steffens & Haslam, 2013; Grant, 2013).
Verbs as predictors of job performance. Verb usage has been shown to be negatively related to academic success (Pennebaker, 2011). The present study sought to see if this
relationship held in a non-academic setting, to predict performance in the workplace. The current data did not support this (see Table 29). This is likely because verb use is associated with an analytical thinking style (Pennebaker, 2011), a style typified by a methodical and structured approach to writing and breaking down concepts and problems into component parts.
This style is reinforced and rewarded in higher education and work. Given this reinforcement, it is possible that individuals working full-time already met the minimum threshold for thinking style, resulting in range restriction and lower variance. This would have made it difficult to find an effect. However, it is also possible that lower verb usage is related to academic success but not job performance as a histogram of verb usage (see Figure 7) shows verb usage across resumes and verbs were not significantly correlated with job performance (r = .04, p > .05).
Positive and negative emotion words as predictors of job performance, contextual performance, and counterproductive performance. Positive and negative moods have been found to predict task performance, contextual performance, and counterproductive performance (Kaplan et al., 2009). However, their closer, visible behavioral counterparts—positive and negative words, did not predict job performance (see Table 30, and Table 31). Although there is strong prior evidence demonstrating that text can predict mood (Nguyen et al., 2014), there are a few possibilities for why this relationship was not observed in the current study. First, emotional words are unlikely to occur in resumes, resulting in low variance and significant skew. A review of the histograms for the positive and negative emotion word categories shows this to be true for the present data. The majority of resumes used positive emotion words less than 2.5% of the
time, and the majority of resumes used negative emotion words less than 1% of the time. Most career advice around resumes recommends eliminating emotional language from resumes (Knouse, 1994, Koeppel, 2002). Thus any overtly emotional language in resumes is likely to be an extreme exception rather than the rule. A second reason that emotion words failed to predict performance has to do with the actual words and word stems that make up the positive and negative word category. A review of the words in the LIWC dictionary for these word categories indicates that, while face valid, these words were unlikely to be used in a resume, e.g. faith, sunshine, jaded or annoying. A third plausible alternative explanation for the findings is that the current approach may not have been sophisticated enough to link mood expressed in a resume to job performance. Identifying emotion in text is difficult. An in-depth discussion about why this is the case is beyond the scope of this paper, but interested readers should consult Chapter 26 in the Handbook of Natural Language Processing (Liu, 2010). Part of the difficulty stems from the variety of ways mood is encoded in text. Furthermore, identifying mood in texts usually requires more complex analyses than those employed in the present study.
Word categories that are proxies for cognitive ability. The LIWC word categories (a) differentiation words, (b) conjunctions, and (c) words longer than six characters, (d) prepositions, (e) cognitive process words, (f) casual words, and (g) insight words were hypothesized to be proxies for cognitive ability based on prior research (Pennebaker, Boyd et al., 2015; Pennebaker & King, 1999; Pennebaker, Mehl, & Niederhoffer, 2003; Tausczik & Pennebaker, 2010). These word categories did correlate with cognitive ability. Unfortunately, they did not predict job performance after controlling for tenure and gender (see Table 35). However, exploratory regression analyses found that a composite combination of these word categories could be used as a proxy for cognitive ability (see Table 36).
Theoretical Implications
This research represents a potential path to addressing two critical limitations of biodata and predictor methods in general. First, biodata does not identify the specific constructs
measured (Lievens & Patterson, 2011; Shultz, 1996). Second, biodata does not specify the elements that make it predictive (Arthur & Villado, 2008; Christian; Edwards, & Bradley, 2010; Ployhart 2006; Whetzel & Daniel, 2006).
A theory based case was made that the text analytics method could address these
limitations by linking word categories (specific elements of the text analytics method) to known constructs predictive of job performance (identifying specific constructs measured). These linkages were then empirically evaluated (Huffcutt, Conway, Roth, & Stone, 2001). For
example, I argued that specific word categories were linked to cognitive ability. Cognitive ability was chosen because it has consistently been found to predict job performance (Hunter & Hunter, 1984; Hunter & Schmidt, 1998). In addition, research suggests that multiple predictor methods such as structured interviews (Huffcutt et al., 2001), assessment centers (Hoffman, Kennedy, LoPilato, Monahan, Lance, 2015), and situational judgment tests (SJTs; Lievens, & Reeve, 2012) capture some aspect of cognitive ability. Regression was used to provide empirical evidence that a composite of these word categories (Table 35) was an appropriate proxy for cognitive ability. Practical Implications
Use of this new method (text analytics) to review resumes may reduce costs for
organizations by obviating the need to administer cognitive ability tests. Consider the following: According to the Corporate Executive Board (CEB), the hourly cost for a vacant job position is $62.50 dollars an hour (as cited in iCIMS, 2015). The Wonderlic Personnel Test (WPT), a cognitive ability assessment, can be administered via the internet at a cost of $200 for