ContentslistsavailableatScienceDirect
Social
Networks
j ou rn a l h o m e p a g e :w w w . e l s e v i e r . c o m / l o c a t e / s o c n e t
Calling
Dunbar’s
numbers
P.
Mac
Carron
a,∗,
K.
Kaski
b,
R.
Dunbar
a,baSENRG,DepartmentofExperimentalPsychology,UniversityofOxford,OX13UDUnitedKingdom bDepartmentofComputerScience,AaltoUniversitySchoolofScience,P.O.Box15500,Espoo,Finland
a
r
t
i
c
l
e
i
n
f
o
Articlehistory:
Availableonline16July2016 Keywords: Social Brain Hypothesis Communication Ego Networks
a
b
s
t
r
a
c
t
Thesocialbrainhypothesispredictsthathumanshaveanaverageofabout150relationshipsatany giventime.Withinthis150,therearelayersoffriendsofanego,wherethenumberoffriendsina layerincreasesastheemotionalclosenessdecreases.Hereweanalyseamobilephonedataset,firstly, toascertainwhetherlayersoffriendscanbeidentifiedbasedoncallfrequency.Wethenapplydifferent clusteringalgorithmstobreakthecallfrequencyofegosintoclustersandcomparethenumberofalters ineachclusterwiththelayersizepredictedbythesocialbrainhypothesis.Inthisdatasetwefindstrong evidencefortheexistenceofalayeredstructure.Theclusteringyieldsresultsthatmatchwellwith previousstudiesfortheinnermostandoutermostlayers,butforlayersinbetweenweobservelarge variability.
©2016TheAuthors.PublishedbyElsevierB.V.ThisisanopenaccessarticleundertheCCBY-NC-ND license(http://creativecommons.org/licenses/by-nc-nd/4.0/).
1. Introduction
In recent years the availability of communication data has allowedustoanalysethenatureofhumanrelationshipsand inter-actionsonamuchlargerscalethanpreviouslyavailable(see,for example,Onnelaetal.,2007).Althoughmodesofcommunication havechangedhowever,ourbrainsizeshavenot,anditissuggested thereisacognitiveconstraintonthenumberofface-to-facesocial interactionsonemayhave(Dunbar,1993;Robertsetal.,2009).This constraintfitsinabroadsensewiththe‘socialbrainhypothesis’ whicharguesthattheevolutionofprimatebrainswasdrivenby theneedtomaintainincreasinglylargesocialgroups(Humphrey, 1976;Dunbar,1992,1998;BartonandDunbar,1997).
Individuals do not give equal weight to each relationship andevidencefromthesocialbrainhypothesissuggeststhatego networksarestructuredintoasequenceoflayerswiththesizeof eachlayerincreasingasemotionalclosenessdecreases(Dunbar, 1998;HillandDunbar,2003).Themeannumberoffriendsineach hasbeenfoundtobearound5,15,50and150inthecumulative lay-ers(i.e.onaverage10peopleinthesecondlayertomakeatotalof 15)(Zhouetal.,2005;Hamiltonetal.,2007).Beyondthisthereare evenlargergroupingssuggestedat500and1500(Dunbar,1993; Zhouetal.,2005).
Recently these Dunbar layers have been observed in online social media, such as Facebook and Twitter (Dunbar et al., 2015)and anonlinecomputergame (Fuchset al.,2014).These
∗Correspondingauthor.
E-mailaddress:[email protected](P.MacCarron).
relationshipsaretemporal,however,andthe150inparticular rep-resentstheamountoffriendsatagiventime.Ifanewfriendismade, anoldoneismostlikelydropped,andthestrengthrelationships changesquickerintheouterlayersthantheinnerones(Sutcliffe etal.,2012;Saramäkietal.,2014).However,othermethodsfor estimatingpersonalnetworksizeshavefoundnumberslargerthan theouterDunbarlayer,thesestudiessuggestanaveragepersonal networksizeofaround290forAmericans(Killworthetal.,1984;
McCartyetal.,2001).
Hereweuseamobilephonecalldatasetinitiallytoascertain whetherlayersoffriendsaredetectableinanofflinecontext.Ifwe findevidenceoftheselayers,wethentestiftheymatchthelayer sizespreviouslyidentifiedusingdifferentclusteringalgorithms.
AEuropeanphone-calldatasetoverall12monthsof2007is used.Thishas34.9millionuserswithalmost6billioncalls.About6 millionoftheseusersarewiththecompany(whoprovidecoverage toapproximately20%ofthecountry’spopulation)forwhomwe havedataonallcallstheymake.
The call frequency between two individuals represents the strengthofarelationshipandhasbeenshowntocorrelatewith emotionalcloseness(RobertsandDunbar,2011;Arnaboldietal., 2013).Saramäkietal.(2014)havealsoshownthatsocial signa-turesincellphonedataremainrobustovertimeevenwithidentity changesinthealters.
2. Methods
Toeliminatecasualcallsandbusinesscalls,thedataarefiltered sothatonlycallsarecountedifthereisatleastonereciprocalcall betweenthetwousers.
http://dx.doi.org/10.1016/j.socnet.2016.06.003
0378-8733/©2016TheAuthors.PublishedbyElsevierB.V.ThisisanopenaccessarticleundertheCCBY-NC-NDlicense(http://creativecommons.org/licenses/by-nc-nd/4. 0/).
Peoplevaryintheextenttowhichtheyusetheirphones,with someusingitasaregularmeansofcommunicationwithfamily andfriends,andothersusingitonlyforsocialemergenciesorto arrangemeetings.Whiletheformerarelikelytoprovideafull cov-erageoftheirsocialnetwork,thelatterwon’t.Toavoidthiskind ofunder-reporting,wecensoredthedatasetsoastoincludeonly thoseindividualswithaminimumnumberofalters.Sincethe aver-agenumberofaltersatagiventimeinpersonal,orego-centric, networksis150,withanaturalrangeofapproximately100–250 (Hill andDunbar,2003;Zhouetal.,2005; Robertset al.,2009), weseta value of100alters astheminimum cut-off. Bydoing so,weaimedtohaveamorecompletedistributionofactualego networks,whilenotbiasingagainstindividualswho have natu-rallysmallnetworks.Afterthiswelowerthecut-offto50altersto observetheresultsforlowerfrequencyusers.
Thedegreekofanegorepresentsthenumberofalterscalled andtheweighteddegreewrepresentsthetotalnumberofcalls anegomakes.Thedegreedistributionpkandweighted
distribu-tionpwarethefractionofverticesinanetworkwithdegreekand weighteddegreew,respectively.Notethatinempiricalnetworks, thedegreedistributionsareoftenfoundtohavepositiveorright skew(Newman,2003).
Inordertoestimatethefunctionalformsofdegreedistribution, themethodofMaximumLikelihoodEstimatorsis used(Clauset etal.,2009;Edwardsetal.,2007).Herewetestdifferent distri-butions;namelypowerlaw,exponential,stretchedexponential, Gaussian(ornormal) andlog-normaldistributions, andusethe AkaikeInformationCriteriatoselectthebestmodel(Akaike,1974; BurnhamandAnderson,2002).
Thedataforeachuserisconsideredasaonedimensionalarray whichwedenotebyWsuchthattheminimumpossibleweightis
wmin=1whenanegocallsanalteronce.Thereisnorealupperlimit (beyondfinancialortimeconstraints)tothemaximumnumberof callsausercanmaketotheirpreferredalter.Inordertocompare users,thedataforuseriisnormalisedby
W= Wi−Wimin Wimax−Wimin,
(1)
whereWiisthenumberofcallsmadetoeachalterandWiminand
Wimaxareminimumandmaximumnumberofcallstheymaketo
anyoftheiralters.Thisensuresthat,foreachego,thestrongest interactionwithanalteris1andtheweakestis0.Afirstestimate toidentifythelayersistoplottheprobabilitydensityofall differ-entweightsforalluserstoascertainifanypatternexists.Akernel densityestimateisappliedtothetrueprobabilitydensityandthe localminimaareusedtoidentifyclusters(Rosenblattetal.,1956; Parzen,1962).
Manymethodsexistfordataclustering,(see,forexample,Jain etal., 1999; Ganet al.,2007).Thevast majority of these algo-rithms,however,areforhigh-dimensionaldatasets (Jain, 2010). Here,althoughwearedealingwithbigdata,weseektobreakeach individual’scallsintoclustersorlayers.Thuswearedealingwith one-dimensionalclusteringforeachuser,andfromthisweanalyse theaveragelayersizes.
Acommonmethodforone-dimensionalclusteringistheJenks naturalbreaksalgorithm(Jenks,1967).TheJenksalgorithmis simi-lartok-meansclusteringinonedimension(Khan,2012).Itsearches fortheminimumdistancebetweendatapointsandthecentres oftheclusterstheybelongtoaswellasformaximumdifference betweenclustercentresthemselves.Thegoodnessoffitcanbe cal-culatedtooptimisethenumberofclustersfound(Coulson,1987). Agoodnessoffit of1.0canonlybeattainedwhenthereiszero within-classvariation(oftenwhenthenumberofclustersisthe samesizeasthedata).Tochoosetheoptimalnumberofclusters wetakeathresholdof0.85forthegoodnessoffitassuggestedin
Coulson(1987).
WealsouseaGaussianMixtureModelwhichassumesthatthe dataaregeneratedfromanumberofGaussiandistributions(Day, 1969).Naively, wemayassume thatthelayersare madeupof GaussiandistributionswiththeirmeansontheDunbarnumbers. Theexpectationmaximisationalgorithmisimplementedforthis (Dempsteretal.,1977)and,again,theAkaikeInformationCriterion isusedtoassessthenumberofclustersinthedata.
Another method for clustering the data, used here, is the head/tailbreaks(Jiang,2013).Thismethodwasdevelopedfordata withheavy-taileddistributions.Itsplitsthedataatthemeanand takingthehead(allvaluesabovethemean),itrecursivelysplits eachconsecutiveheadatitsmean.Ourdataisheavytailed(Onnela etal.,2007),withmostuserscallingmanypeopleasmallnumberof timesbutcallingtheircloserfriendsfrequently.Anadvantageofthe head/tailbreaksisthatthenumberofclustersisderivednaturally fromthedistributionofthedata.
3. Results
Althoughthemobilephonecalldatasetwestudyherecontains almostcomplete dataonover 6millionusers,onlyafractionof thesehaveadegreek≥100.Inordertotestthehypothesisofthe layersofdifferentlevelsofemotionalcloseness,weanalyseusers
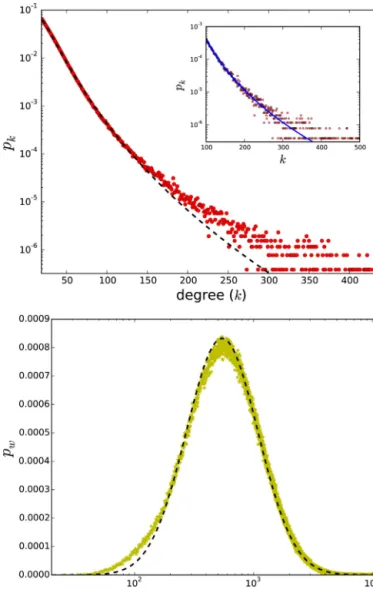
Fig.1. Ontheleftpanel:Thedegreedistributionandalog-normalfit.Theinset showsuserswithdegreek≥100andasimilarfit.Ontherightpanel:Theweighted degreedistributionisshown,againwithafittedlog-normaldistribution.
thatareinthelowerboundoftheouterlayer,i.e.havecalled100or morealters.Thisleaves26,680userswithameannumberofalters of129.9andstandarddeviationof37.7.Themeannumberofcalls anegomakesis3553.8withastandarddeviationof1894.1.Wealso analyseuserswith50<k<100(N=301,190).Thesehaveanaverage weighteddegreeof1964.2.Theremaininguserswithk<50have anmeanweighteddegreeof148.8indicatingtheyusetheirphone onaveragelessthanonceeverytwodays.
Thedegreedistributionandtheweighteddegreedistribution fortheentiredatasetareshowninFig.1withlog-normal distribu-tionsfitted.Theinsetintheleftpanelshowsthedegreedistribution foruserswithdegreek≥100,whichfollowsassimilar distribu-tion.Bothtruncatedpower-lawandlog-normalmodelsyieldhigh Akaikeweightsforthedegreedistributionbutwithslightlymore supportforthelog-normalbehaviour(atruncatedpowerlawis fittedtothedatasetinOnnelaetal.(2007)).Henceweconsider that,ofthecandidatemodels,thelog-normalmodelhasthehighest supportfortheweighteddegreedistribution.
Log-normaldistributionsareassociatedwithmultiplicative pro-cesses,incontrastwithGaussiandistributionswhichareadditive. Animportantconsequenceofalog-normaldistributionisthatina growthprocess,thegrowthrateisindependentofthesize(Sutton, 1997).Intermsthedegreedistribution,thismeansthattherateof growthofanego’snumberoffriendsisindependentoftheir cur-rentnumberoffriends.Log-normaldistributionsarefoundinmany empiricaldatasets(Eeckhout,2004;Mitzenmacher,2004;Clauset etal.,2009).
Having establishedthatthedatais log-normallydistributed, beforenormalisingtheweightarrayinEq.(1),thelogofeachweight istaken.Fig.2showsthehistogramforthenormalisedlogofthe weights ˆwforallusers.Therearepeaksat0and1aseveryuserhas atleastonealtertheycallaminimalnumberoftimes(usually mul-tiple)andatleastonealtertheycallamaximumnumberoftimes. Althoughthedataisverynoisy,weobservepeaksindicatingthat therearesomegroupingswithinthedata.Thebluelineisa Gauss-iankerneldensityestimateofthedistribution.Thelocalminima onaveragesplitthenumberofaltersintogroupsof15untilthe normalisedstrengthofarelationship ˆw=0.28afterwhichthere areanaverageof68.8alters.Thiscouldroughlycorrespondtothe thirdDunbarlayerof50.Beyondthisregion,thedataistoonoisy tosplitupfurtheronagrouplevel.
Fig.2.Thehistogramofthenormalisedweightsofeachcallforallusers.Theblue lineisaGaussiankerneldensityestimatortothedata.(Forinterpretationof refer-encetocolorinthisfigurelegend,thereaderisreferredtothewebversionofthis article.)
Assumingthenthattherearesomekindsofgroupingswithin eachuser’scalldataW,wenextusemoretraditionalclustering algorithmstoattempttoidentifythelayers.Herewedonotneed tonormaliseWaswespliteachuser’sweightarrayindividually andanalysetheoveralldistributionsonebyone.
TheanalysiswiththeJenksalgorithmisfoundtosplitalmost halfoftheusers(13,209)into4–5clusters,butitalsofindsofthe orderofahundredusersineveryclusterfromclustersof7andup.
Fig.3showsthenumberofusersineachcluster.
Weidentifythemostcommonnumberofclusterstobe4for 7226(27.1%)users.Theaveragenumberofusersandtheirstandard deviationineachclusterarereportedinTable1andtheaverage cumulativelayerturnsouttohold4.1,11.0,29.8and128.9users. Thesenumbersarealittlesmallerthantheconventionalnumbers forDunbarlayers,butwithintheirnaturalrangeofvariation.The nextmostcommonnumberofclusters,asshowninFig.3,is5 clus-tersfor5983(22.4%)userswithcumulativelayersholding2.9,7.4, 17.7,43.0,and134.3users.Thesenumbersarequitesimilartothe Dunbarnumbers,butwithananotherlayerbetweenthefirsttwo.
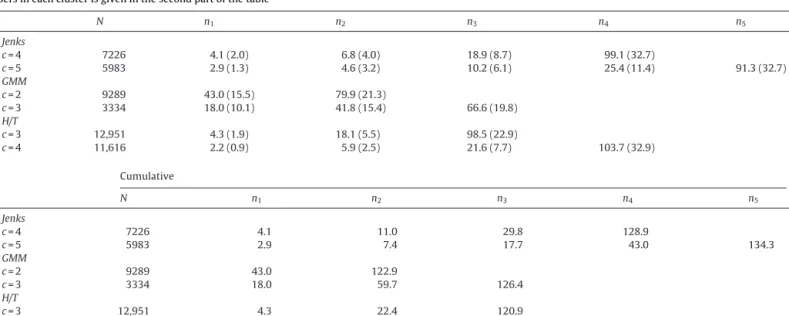
Table1
TheaveragenumberofusersineachclusterusingtheJenksNaturalBreaksalgorithm,GaussianMixtureModel(GMM)andtheHead/TailBreaks(H/T).Thenumberofusers inaclusterisgivenbyN,thetotalnumberofclustersthealgorithmfindsisdenotedbycandnigivestheaveragenumberofaltersinclusteri.Thecumulativenumberof
usersineachclusterisgiveninthesecondpartofthetable
N n1 n2 n3 n4 n5 Jenks c=4 7226 4.1(2.0) 6.8(4.0) 18.9(8.7) 99.1(32.7) c=5 5983 2.9(1.3) 4.6(3.2) 10.2(6.1) 25.4(11.4) 91.3(32.7) GMM c=2 9289 43.0(15.5) 79.9(21.3) c=3 3334 18.0(10.1) 41.8(15.4) 66.6(19.8) H/T c=3 12,951 4.3(1.9) 18.1(5.5) 98.5(22.9) c=4 11,616 2.2(0.9) 5.9(2.5) 21.6(7.7) 103.7(32.9) Cumulative N n1 n2 n3 n4 n5 Jenks c=4 7226 4.1 11.0 29.8 128.9 c=5 5983 2.9 7.4 17.7 43.0 134.3 GMM c=2 9289 43.0 122.9 c=3 3334 18.0 59.7 126.4 H/T c=3 12,951 4.3 22.4 120.9 c=4 11,616 2.2 8.2 29.8 133.5
Fig.3. NumberofusersineachclusterusingtheJenksalgorithm.Themajorityof usershavefourlayersoffriends.Thealgorithmdoesnotconvergewellforlarge numbers(>7)ofclusters.
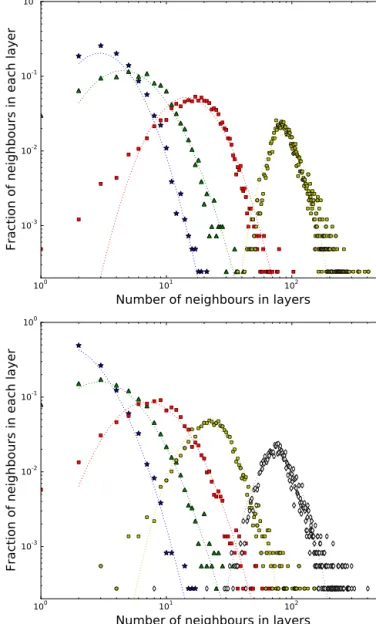
Theprobabilitydistributionsfor4and5clustersareshownin Fig.4.Eachclusterislog-normallydistributed.Thisisperhapsnot surprisinggiventhattheoriginaldistributionislog-normal;there isalreadyalargevariationwithsomeusersperhapshaving100 friendssplitinto4clustersandothershavingalmost500splitinto 4clusters.Thereforeeveniftheestimatesforthemeansizeofeach layerareaccurate,thereislargevariancewithnumbersofalters goingfartotherightofthesemeans.
NextweuseaGaussian MixtureModeltosplitthedata.For thisalgorithm,wehowevertakethelogofthedataasitis log-normallydistributedand notGaussian.In thiscase 9289ofthe usersaresplitinto2clustersand3334usersinto3clusters.(The modelfindsabout1000thousandusersineachclusterabovethis upto12clusters.)Theaverageandstandarddeviationsarereported in Table1. For 2 clusters, thecumulative layer-size meansare 43.0 and 122.9users, which again are quitecloseto theouter twoDunbarlayers.For3clustersthemeansareat18.0,59.7and 126.4userswhichareclosetotheouterthreelayersbutmissthe innerone.
Lastlyweapplythehead/tailbreaksalgorithm.Foruserswith morethan100alters,itfinds12,951usersin3clusterswith cumu-lativelayersizesof4.3,22.4and122.9usersand11,616usersin4 clusterswithcumulativelayersizesof2.2,8.2,29.8and133.5users. ThefulldetailsarereportedinTable1.Again,thelayersarefound tobelog-normallydistributedusingthismethod.
Eachofthethreealgorithmsfindssmallnumberoflayersforthe majorityofthedata.TheJenksandhead/tailsalgorithmsfindan innerlayerrangingfrom2.2to4.3altersandalmostallalgorithms yieldalargeouterlayerof80–100altersattheend.TheJenks algo-rithmandGaussianMixtureModelbothgivegoodevidenceforthe outertwolayers.
Ifweassumethatthemajorityof4clustersistheappropriate value,wecanusetheJenksalgorithmtoforceeveryoneinto4 clus-ters.Thevaluesofthecumulativelayersarethen3.5,10.6,31.1 and129.9users,whichareslightlysmallernumbersthanthose conventionallyconsideredfortheDunbarlayers,buthavevirtually thesamescalingratiobetweenthelayers,i.e.onaverage,3.3here, comparedtoanaverageof3.2foundbyZhouetal.(2005)and3.2 inFacebooktrafficbyDunbaretal.(2015).
Theseresultsarefromcallfrequency.Wealsohavetheduration ofeachcall.Thedurationandcallfrequencyarehighlycorrelated witha Pearson correlationcoefficient of r=0.71. For egoswith
k≥100thisisslightlyhigheratr=0.76.UsingtheJenksalgorithm thisagainyieldsamajorityofegoswith4clusters(27%ofegos)with cumulativelayersof3.9,10.1,27.2and129.3.Theseareslightly lowerthantheresultsforcallfrequency.
Fig.4. Theprobabilitydistributionsforthenumberofusersineachclusterfor4 clustersontheleftand5clustersontherightusingtheJenksalgorithmandshown onalog-logscale.Log-normaldistributionscanbefittedtoeachasseenbythe dottedlines.
FinallyweapplytheJenksalgorithmtoegos’callfrequencies with50≤k<100(N=301,190).Inthiscasethemajorityofusers arefoundtobebestclusteredinto3(23.5%)withcumulativelayers of3.9,11.9and63.91.ThismatchesthefirstthreeDunbarlayers well.Thenextmostcommonis4clusters(14.5%)withcumulative layersof2.7,6.7,17.9and64.3.Thesealsocontainthefirstthree Dunbarlayerswellbuthaveanadditionallowervalueclosetothe 1.5layerfoundinDunbaretal.(2015).Onceagaintheduration givesverysimilarresultstothecallfrequency.
4. Conclusions
Inthisstudy,byapplyingdifferentclusteringalgorithmstoa mobilephonedatasetwefindstrongevidenceforalayering struc-ture.Fig.2,forexample,makesnopriorassumptionsandshows thatthereissomestructurewithinthedatasetinspiteofallthe noise.However,findingdiscretelayersisstillaconsiderable chal-lenge.
Althoughtheclusteringmethodsyieldslightlydifferentresults, asshownatthebottomofTable1,theyhaveimportantsimilarities. Theyallfindasmallnumberofclustersandshowgoodsupportfor
theoutertwolayers.Whilethedataisnoisy,allmethodssupport twodifferentgroupingswell.Thiscould,forexample,mean intro-vertsandextrovertshaveadifferentnumberoflayersoffriends. Furtherworkcouldinvestigatethispossibility.Anothersuggestion isthatoverayear,friendshipsaremoretransient.Alterscouldmove upordownfromonelayertothenextona regularbasis.This wouldreflectthetemporalnatureofemotionalcloseness, espe-ciallyamongone’snon-closestfriends.
TheJenksalgorithmandGaussianMixtureModelforfourlayers, theygiveresultsclosetotheDunbarlayers.Inaddition,theyhave thesamescalingpattern(∼3)ashaspreviouslybeenreportedfor thestructureofofflineegocentricsocialnetworksandthe organi-sationofnaturalcommunities(Zhouetal.,2005;Hamiltonetal., 2007),FacebookandTwittertraffic(Dunbaretal.,2015)andonline gamingenvironments(Fuchsetal.,2014).Westilldonothaveany principledexplanationforwhythesestructurallayersshouldhave suchaconsistentpattern,buttheyarecloselytiedintothe psycho-logicalaspectsofrelationshipslikeemotionalcloseness(Sutcliffe etal.,2012).
Themeansintheclustersaregenerallysmallerthanthe pre-dictedmeansfromtheDunbarlayers,thoughtheymatchtheranges foundinHillandDunbar(2003).Areasontheycouldbesmaller hereisduetothefactthatamobilephonecalldatasetonly cap-turesaportionofanego’ssocialnetwork,evenwithtakingusers whocallmorethan100alters.Withmanyothermodesof com-municationavailable,itisunlikelythatauserwouldonlyresortto phoningtheirfriends.Weemphasisehowever,thattheyear2007is agoodtimetousecellphonedataforthiskindofanalysisasitisjust priortosmartphones(thefirstiPhonewasreleasedafewmonths beforethisdatasetends)whichfacilitatesmanyotheravenuesof onlinecommunication.Itisalsobeforeplatforms,suchasSkypeor Facebook,wereattheheightoftheirpopularity.Wealsoshowthat userswhocall50–100peoplethroughouttheyearmatchtheinner threeDunbarlayerswell.
Thisstudyhasstrongimplicationsforthesocialbrain hypothe-sisas,regardlessofthemodeofcommunication,similarstructure isobserved.Futureworkonthiswillinvolveanalysingtheturnover timeinthelayersusingtemporaldataindifferentcommunication datasets.Webelievethattheturnovertimewillrelatetothe emo-tionalcloseness,forexampletheinnerlayerislikelytobemore robustinphonedatathanonTwitter.
Afinalpointofnotehereisonthestructureofthelayers.From eachalgorithmwefindthatthelayersarelog-normallydistributed forallnumberofclusters.This,tothebestofourknowledge,hasnot beenobservedbefore.Itisimportanttopointoutthatthis right-wardskewandlargestandarddeviationexist.Thelog-normality isduetotheentiredegreedistributionbeinglog-normalandthus alreadyhavingconsiderableskew.Thispotentiallyalsoshowsa dif-ferencebetweenextroverts,whotendtohaveanumberoffriends fargreaterthanthemean.Regardlessoftheirnumberoffriends however,theystillshowevidenceoflayers.
Acknowledgements
TheauthorswouldliketothankHang-HyunJoforhelpful discus-sions.P.MC.andR.D.aresupportedbyaEuropeanResearchCouncil (No.295663)AdvancedInvestigatorgrant toR.D. K.K. acknowl-edgesfinancialsupportfromtheAcademyof Finland’sCOSDYN project(no.276439).
References
Akaike,H.,1974.IEEETrans.Autom.Control19,716.
Arnaboldi, V., Guazzini, A., Passarella, A., 2013. Comput. Commun. 36, 1130.
Barton,R.A.,Dunbar,R.I.,1997.MachiavellianIntelligenceII:Extensionsand Evalu-ations,vol.2.,pp.240.
Burnham,K.P.,Anderson,D.R.,2002.ModelSelectionandMulti-modelInference:A PracticalInformation-TheoreticApproach.Springer.
Clauset,A.,Shalizi,C.R.,Newman,M.E.J.,2009.SIAMRev.51,661. Coulson,M.R.,1987.Cartographica:Int.J.Geogr.Inform.Geovisual.24,16. Day,N.E.,1969.Biometrika56,463.
Dempster, A.P., Laird, N.M., Rubin, D.B., 1977. J. R. Stat. Soc. Ser. B(Methodological),1.
Dunbar,R.,Arnaboldi,V.,Conti,M.,Passarella,A.,2015.Soc.Networks43,39. Dunbar,R.I.,1992.J.Hum.Evol.22,469.
Dunbar,R.I.,1993.Behav.BrainSci.16,681. Dunbar,R.I.,1998.Evol.Anthropol.6,178.
Edwards,A.M.,Phillips,R.A.,Watkins,N.W.,Freeman,M.P.,Murphy,E.J.,Afanasyev, V.,Buldyrev,S.V.,daLuz,M.G.,Raposo,E.P.,Stanley,H.E.,etal.,2007.Nature449, 1044.
Eeckhout,J.,2004.Am.Econ.Rev.,1429. Fuchs,B.,Sornette,D.,Thurner,S.,2014.Sci.Rep.4.
Gan,G.,Ma,C.,Wu,J.,2007.DataClustering:Theory,Algorithms,andApplications, Vol.20.Siam.
Hamilton,M.J.,Milne,B.T.,Walker,R.S.,Burger,O.,Brown,J.H.,2007.Proc.R.Soc. Lond.B:Biol.Sci.,p.2195.
Hill,R.A.,Dunbar,R.I.,2003.Hum.Nat.14,53. Humphrey,N.K.,1976.GrowingPointsEthol.,303.
Jain,A.K.,Murty,M.N.,Flynn,P.J.,1999.ACMComput.Surv.(CSUR)31,264. Jain,A.K.,2010.Patt.Recogn.Lett.31,651.
Jenks,G.F.,1967.InternationalYearbookofCartography7,186. Jiang,B.,2013.Prof.Geogr.65,482.
Khan,F.,2012.Appl.SoftComput.12,3698.
Killworth,P.D.,Bernard,H.R.,McCarty,C.,Doreian,P.,Goldenberg,S.,Underwood, C.,Harries-Jones,P.,Keesing,R.,Skvoretz,J.,Wemegah,M.V.S.,1984.Measuring patternsofacquaintanceship.Curr.Anthropo.,381–397.
McCarty,C.,Killworth,P.D.,Bernard,H.R.,Johnsen,E.C.,Shelley,G.A.,2001. Compar-ingtwomethodsforestimatingnetworksize.Hum.Organ.60(1),28–39. Mitzenmacher,M.,2004.InternetMath.1,226.
Newman,M.E.J.,2003.SIAMRev.45,167.
Onnela,J.-P.,Saramäki,J.,Hyvönen,J.,Szabó,G.,Lazer,D.,Kaski,K.,Kertész,J., Barabási,A.-L.,2007.Proc.Natl.Acad.Sci.U.S.A.104,7332.
Parzen,E.,1962.Ann.Math.Stat.,1065.
Roberts,S.G.,Dunbar,R.I.,2011.Evol.Hum.Behav.32,186.
Roberts, S.G., Dunbar, R.I., Pollet, T.V., Kuppens, T., 2009. Soc. Networks 31, 138.
Rosenblatt,M.,etal.,1956.Ann.Math.Stat.27,832.
Saramäki,J.,Leicht,E.,López,E.,Roberts,S.G.,Reed-Tsochas,F.,Dunbar,R.I.,2014. Proc.Natl.Acad.Sci.U.S.A.111,942.
Sutcliffe,A.,Dunbar,R.,Binder,J.,Arrow,H.,2012.Br.J.Psychol.103,149. Sutton,J.,1997.J.Econ.Lit.,40.
Zhou,W.-X.,Sornette,D.,Hill,R.A.,Dunbar,R.I.,2005.Proc.R.Soc.Lond.B:Biol. Sci.,p.439.