2256. Application of empirical mode decomposition and
Euclidean distance technique for feature selection and
fault diagnosis of planetary gearbox
Haiping Li1, Jianmin Zhao2, Jian Liu3, Xianglong Ni4
1, 2, 4Mechanical Engineering College, Shijiazhuang, 050003, China 3College of Communication and Information Engineering,
Nanjing University of Posts and Telecommunications, Nanjing, 210003, China 1Corresponding author
E-mail:1hp_li@hotmail.com, 2jm_zhao@hotmail.com, 3by.liujian@gmail.com, 4nixianglong@hotmail.com
Received 23 December 2015; received in revised form 14 July 2016; accepted 18 August 2016 DOI https://doi.org/10.21595/jve.2016.16762
Abstract. Planetary gearbox plays an important role in large and complex mechanical equipment due to the advantage that it can provide larger transmission ratio in a compact space than fixed shaft gearbox. However, its fault diagnosis is a dilemma due to the special structure and harsh working conditions. This paper applies Empirical Mode Decomposition (EMD) and Euclidean Distance Technique (EDT) for planetary gearbox feature selection and fault diagnosis. EMD is a self-adaptive signal processing method that can be applied to non-linear and non-stationary signal and it can also get the aim of de-noising. EDT can give out the quantitative fault diagnosis result. And its theoretical knowledge is easy to understand. An intrinsic mode function (IMF) selection method based on energy ratio is proposed to select IMFs which include sensitive fault information. A two-stage feature selection and weighting method based on EDT is applied to get a new combinative feature and 36 feature parameters are extracted before this process. Then, the feature vector matrix of each raw signal can be computed out by extracting the new combinative feature from every IMF. Finally, the diagnosis result can be obtained through calculating the Euclidean Distance value between two feature vector matrixes. Namely, the health state of the tested signal is as same as the trained signal which the Euclidean Distance between them is the minimum. The performance of the proposed method is validated by experimental data and industrial data. Keywords: planetary gearbox, feature extraction, selection and weighting, fault diagnosis, empirical mode decomposition, Euclidean distance technique.
1.Introduction
Due to the advantage that it can provide larger transmission ratio in a compact space than fixed shaft gearbox, planetary gearbox is increasingly used in many kinds of rotary machinery in recent years, such as wind turbines, cranes and military equipment (e.g. tanks and helicopter), etc. However, the special internal structure and the harsh working conditions make it very difficult to the fault diagnosis of the planetary gearbox [1].
1) The fault feature frequencies of planetary gearbox are very low and along with serious noise pollution. The feature extraction is also very difficult.
Compared with fixed shaft gearbox, the structure of planetary gearbox is compact relatively. The main components of a single stage planetary gearbox usually consist of one sun gear, one ring gear, one planet carrier and three or four planet gears. So it can achieve larger transmission ratio. Because of the special structure and adverse working conditions, the fault feature frequencies of planetary gearbox are very low (such as the fault feature frequencies of planet gear and ring gear) and along with serious noise pollution. Therefore, the feature extraction of planetary gearbox is also very difficult.
2) The vibration signal transmission path is very complicated. And the vibration signal acquired from planetary gearbox usually is strong non-linear and non-stationary.
The special internal structure makes the signal transmission path very complicated. The signal transmission path concerns both fault and accelerometer location. Additionally, since there are
several gears meshing in a compact space, the vibration signal acquired from planetary gearbox usually is coupled with strong non-linear and non-stationary data.
3) The component parts of vibration signal of planetary gearbox are complicated. Therefore, frequency spectrum analysis is very difficult.
Due to the special internal structure, the component parts of vibration signal of planetary gearbox are complicated. Fault feature frequencies are related to the teeth number of each gear, the number of planet gears, meshing phase and so on. In addition, gears failure, manufactured error and the location varying between planet gears and accelerometer will bring amplitude and frequency modulation to vibration signal. So, frequency spectrum analysis is very difficult.
It can draw a conclusion from the analysis described above that planetary gearbox fault diagnosis is very difficult. And efficient and accurate methods are particularly needed to prevent it from failure. Many researchers made important contributions to planetary gearbox fault diagnosis. Samuel and Pines introduced vibration-based techniques for helicopter transmission diagnostics roundly [2]. Some researchers focused on model-based method [3-7]. Some researchers got fault diagnosis results using frequency analysis [8-12]. Other researchers solved the dilemma using evaluating method [13] and condition monitoring method [14]. The intelligent and quantitative method is particularly needed.
The procedure of the intelligent fault diagnosis methods is mainly made up by data acquisition, data processing, features selection and fault diagnosis. In this aspect, major efforts have been made by many researchers and organizations. Some documents [15-18] introduced the common fault features in detail, such as maximum, minimum, kurtosis and energy, etc. In addition, the data processing techniques that utilized to extract the features were also explained by them. However, when applied on planetary gearbox fault diagnosis, the effectiveness of them still needs to validate. Empirical mode decomposition (EMD) [19-23], as a new time-frequency analysis technique, has been developed and widely applied in fault diagnosis of rotating machinery recently. EMD can decompose the complicate signal into a set of complete, simple and almost orthogonal components named intrinsic mode function (IMF). The IMFs represent the natural oscillatory mode embedded in the signal and work as the basis functions, which are determined by the signal itself, rather than pre-determined kernels. Thus, it is a self-adaptive signal processing method that can be applied to non-linear and non-stationary signal perfectly. In addition, Euclidean Distance Technique (EDT) is a useful method to automotive fault diagnosis. EDT can give out the quantitative result. And compared with other similar methods, its theoretical knowledge is easy to understand. Therefore, this paper proposed a feature selection and fault diagnosis method based on EMD and EDT.
Hereafter, the paper is organized as follows. Section 2 introduces the proposed feature selection and fault diagnosis method. Section 3 illustrates the method by experimental data of a planetary gearbox test rig. Section 4 validates the proposed method using experimental data and industrial data. Finally, the conclusions are drawn in Section 5.
2.Methodology
2.1.EMD theory and IMF selection 2.1.1.EMD theory
Hilbert Huang Transform (HHT) is a new signal processing method which developed by Huang et al. It contains two parts: EMD and Hilbert spectrum analysis method. As the kernel of HHT, EMD has been developed and widely used in fault diagnosis of rotating machinery recently. Using EMD, the complex signal can be decomposed into a set of complete, simple and almost orthogonal components named intrinsic mode functions (IMF). The IMFs represent the natural oscillatory mode embedded in the signal and work as the basis functions, which are determined by the signal itself. The detailed theory of HHT, including EMD, can be seen in documents [19-23]
and it will not be introduced any more in this paper. 2.1.2.IMF selection method based on energy ratio
After getting all the IMFs of a signal, sensitive IMFs which contain main fault information should be selected to promote the velocity of calculation. This paper proposes an energy ratio-based method to select sensitive IMFs because the energy value of a fault signal must be higher than the normal signal’s. The specific steps are as follows.
1) Assume a test signal ( ) produce IMFs ( ) ( = 1, 2,…, ) after processed by EMD and compute the energy value of ( ), ( ) ( = 1, 2,…, ):
( )= , = , ( = 1,2, . . . , ), (1)
where is the th point of ( ), is the th point of ( ) and is the total number of data points.
2) Calculate the ratios of ( = 1, 2,…, ) and ( ):
=
( ), ( = 1,2, . . . , ). (2)
Then select the first ratios, ( , , . . . , ), and the corresponding IMFs can be thought as they contain main fault information.
3) Because the IMFs produced by EMD are arranged from high frequency to low frequency naturally and the feature frequencies of planetary gearbox are usually very low, the ( + 1)th IMF which contain main fault information can be obtained by adding the residual - IMFs together to decrease error.
In total, a test signal ( ) produce IMFs ( )( = 1,2,…, ) after processed by EMD and select out + 1 IMFs as the sensitive IMFs.
2.2.Feature extraction, selection and weighting based on EDT 2.2.1.Feature extraction
A good feature parameter is crucial to fault diagnosis of planetary gearbox. This paper summarizes 36 feature parameters which may be appropriate for planetary gearbox fault diagnosis [2, 15-18] which can be seen in Table 1.
0 100200 300400 500600 -1 0 1 2 3 4 5 6 0 0.5 1 1.5 2 2.5 -6 -4 -2 0 2 4 6
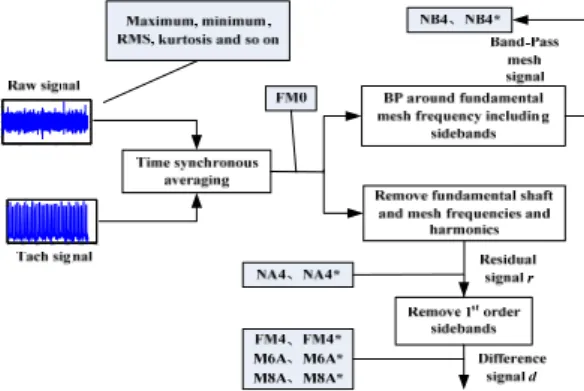
The feature extraction methods of the 36 features are different, as Fig. 1 shows. This is a supplement to Ref. [15] and it will be not introduced here anymore.
Table 1. The 36 feature parameters
No. Name Definition
Maximum value = ( )
Minimum value = ( )
Peak to peak = −
Average value = 1
Mean square value =1
Root mean square (RMS) = 1
Peak value = | | Variance =1 ( − ) = − Standard deviation = 1 ( − ) = − Energy = Skewness =1 ∑ ( − ̅) Kurtosis =1 ∑ ( − ̅)
Square mean absolute root = 1 | |
⁄
Mean absolute value ′ = 1 | |
Shape factor = | ′| =| | Crest factor = = Impulse factor = ′ = Abundance factor = = Clearance factor = = Mean frequency =1 ( )
Frequency center =∑ ( ) ⋅ ( )
∑ ( )
Root mean square frequency = ∑ ( ) ⋅ ( )
∑ ( )
Standard deviation frequency = ∑ ( ( ) − ) ⋅ ( )
∑ ( ) FM0 0 = ∑ FM4 4 = ∑ − ∑ − FM4* 4 ∗= (1⁄ ) ∑ − (1⁄ ) ∑′ (1⁄ ) ∑ − M6A 6 = ∑ − ∑ − M6A* 6 ∗= (1⁄ ) ∑ − (1⁄ ) ∑′ (1⁄ ) ∑ − M8A 8 = ∑ − ∑ − M8A* 8 ∗= (1⁄ ) ∑ − (1⁄ ) ∑′ (1⁄ ) ∑ − NA4 4 = ∑ ( − ) (1⁄ ) ∑ ∑ − NA4* 4 ∗= 1⁄ ∑ ( − ) (1⁄ ) ∑ ∑ − NB4 4 = 1⁄ ∑ ( − ) (1⁄ ) ∑ (1⁄ ) ∑ − NB4* 4 ∗= 1⁄ ∑ ( − ) (1⁄ ) ∑ (1⁄ ) ∑ − ER = = 1⁄ ∑ ( ) 1⁄ ∑ EOP = ∑ ( − ) ∑ ( − )
Where is the vibration signal acquired by the accelerometer. is the total number of the data points. ( ) is the th meature of the frequency spectrum of and ( ) is the frequency value of ( ). is the maximum peak-to-peak amplitude of the signal ; is the amplitude of the th harmonic, and is the total number of harmonics in the frequency range. is the current time record number in the run ensemble. is difference signal which = − . Where
is the signal containing the mesh frequencies, their harmonics and their first-order sidebands. is residual signal which = − . Where is the signal containing only the mesh frequencies and their harmonics. is envelop signal of band-pass filtered signal computed using the Hilbert transform. equals − · and is the th measurement of the resulting signal. , , and are the mean values of , , and , respectively.
2.2.2.Feature selection and weighting based on EDT
In the application of fault diagnosis for planetary gearbox, different features may be sensitive to different kinds of faults. Therefore, feature selection is needed after extracting all of the 36 features [24]. Lei and Zuo proposed a two-stage feature selection and weighting technique via EDT in Ref. [17]. But they ignored the influence of working condition changing. And the method was implemented on fixed gearbox not planetary gearbox. This paper improves the method by considering not only the health state but also the working condition and applies to planetary gearbox. The specific steps can be described as follows:
Assume that is the number of the health statuses of planetary gearbox; is the number of the samples of the th health status and extract features from each sample. Thus, a feature set { , , , = 1, 2,…, ; = 1, 2,…, ; = 1, 2,…, } can be obtained. Where , , is the
th feature of the th sample of the th health status. Meanwhile, assume that is the number of working conditions. Then the improved feature selection and weighting procedures based on EDT are as follows.
(1) Calculating the average Euclidean Distance between the samples of the same health status:
, =
1
( − 1) , , − , ,
,
, , = 1,2, … , , ≠ , (3)
Then getting the average Euclidean Distance of health statuses:
( )= 1
, . (4)
(2) Defining the variance factor under the same health status with considering the changing of vibration signal as follows:
( )
=max , min ,
. (5)
(3) Calculating the mean values of each feature of all samples under the same health status:
, = 1 , , . (6)
Then, calculating the average Distance between the mean values of different health statuses:
( )
= ( − 1)1 , − ,
,
(4) Defining the variance factor between different health statuses with considering the changing of features as follows:
( )
=max , − ,
min , − ,
, , = 1,2, … , , ≠ . (8)
(5) Defining a variance factor with considering vibration signal and features as follows:
=
( )
max ( ) +
( )
max ( ) . (9)
(6) Calculating the ratio of ( ) and ( ) with assigning the : =
( )
( ). (10)
Then normalizing the obtained values: =
max( ). (11)
(7) The appropriate features are sensitive to the changing of health status and insensitive to the changing of the working condition. Assume that , is the mean value of the ratio corresponding
to Eq. (11) of working condition, calculating the -value as follows:
= − , . (12)
Because the selection procedure has removed the influence of working condition changing, the features with ≥ 0 are appropriate. Although the appropriate features are selected, they have different sensitivities. Therefore, feature weighting is essential to achieve a more accurate diagnosis result. Repeat the Step (1)~(7), the different sensitivities of the selected features can be obtained. Namely, each selected feature can get a weighting coefficient ( = 1, 2,…, ). Where is the number of the selected features and ≤ 36. Thus, a new assembled feature can be obtained as follows:
= ⋅ . (13)
The is the feature we wanted.
2.3.Feature selection and fault diagnosis method
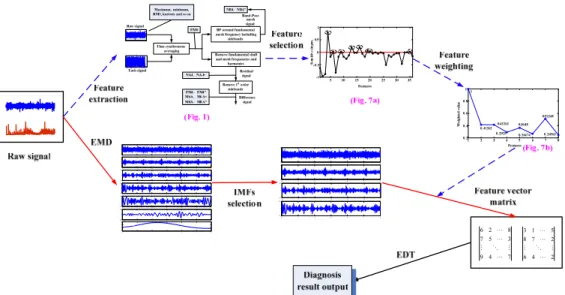
The flow chart of the feature selection and fault diagnosis method for planetary gearbox based on EMD and EDT which proposed in this paper is shown in Fig. 2. It consists of the following procedural steps. (1) Get a new feature parameter through feature extraction, selection and weighting, the main steps as the blue flow (dotted) line shows. (2) Obtain several sensitive IMFs by EMD decomposition and IMFs selection, as the red flow line shows. (3) Compute out the feature vector matrix of each raw signal by extracting the new feature from every IMF. (4) Gain the diagnosis result through calculating the Euclidean Distance value between two feature vector
matrixes. Namely, the health state of the tested signal is as same as the trained signal which the Euclidean Distance between them is the minimum.
3.Experimental evaluation
In this section, we examine the performance of the proposed method by using it to analyze the experimental signals of a planetary gearbox in a test rig.
0 1 2 3 4 5 6 -2 0 2 0 1 2 3 4 5 6 -0.2 0 0.2 0 1 2 3 4 5 6 -0.1 0 0.1 0 1 2 3 4 5 6 -0.05 0 0.05 0 1 2 3 4 5 6 -0.05 0 0.05 0 1 2 3 4 5 64 4 6 8 10x 10-3 0 1 2 3 4 5 6 -5 0 5 0100200300400500600 -10 1 23 45 6 0 1 2 3 4 5 6 -2 0 2 0 1 2 3 4 5 6 -0.2 0 0.2 0 1 2 3 4 5 6 -0.1 0 0.1 0 1 2 3 4 5 6 -5 0 5 6 2 8 7 5 3 9 4 7 00.511.522.5 -6 -4 -2 0 24 6 3 1 5 8 7 2 6 4 2
Fig. 2. Flow chart of the method proposed in this paper
3.1.Experimental setup
Fig. 3 shows the planetary gearbox test rig. And the gear parameters of the planetary gearbox can be seen in Table 2.
Fig. 3. Planetary gearbox experimental system
Table 2. Planetary gearbox configuration parameters
Gear Sun gear Planet gear (number) Ring gear
Number of teeth 13 64(3) 146
Four accelerometers were mounted on the tested planetary gearbox, as depicted in Fig. 4(a). Fig. 4(b) is the structure of the planetary gearbox.
The sampling frequency and time of this experimental system is 20 kHz and 2s, respectively. Motor drives the input shaft, shaft 1, at 400, 800 and 1200 rpm three kinds of rotary speed. To each speed, 0, 0.4, 0.8 and 1.2 Nm four different kinds of loads are implemented.
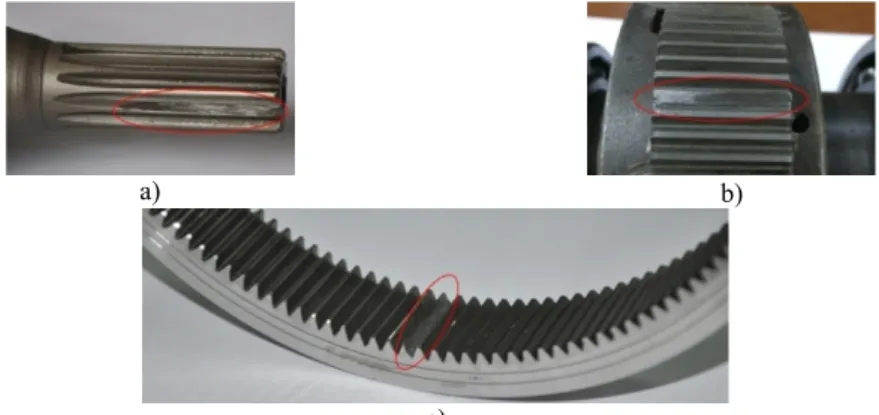
In order to demonstrate the effectiveness of the proposed method, wear failure is introduced to the gears and seeded on one tooth of sun gear, planet gear and ring gear, respectively. The specific failures are as Fig. 5 shows.
a) b)
Fig. 4. a) Mounted location of each accelerometer; b) structure of the tested planetary gearbox
a) b)
c)
Fig. 5. Seeded wear failure of every gear: a) sun gear; b) planet gear; c) ring gear
3.2.Results analysis and discussion
3.2.1.Feature extraction, selection and weighting
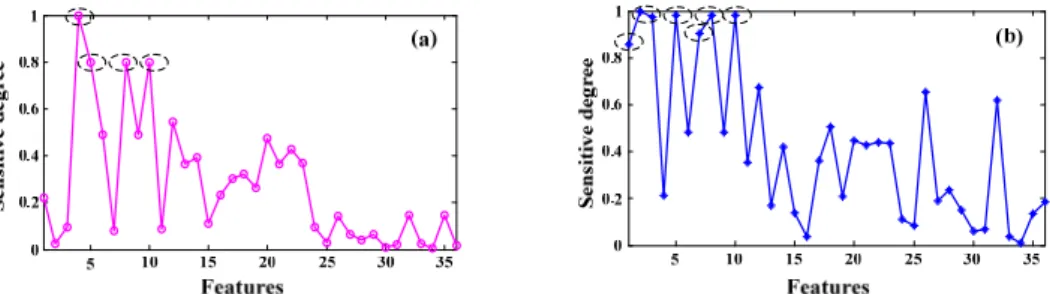
The vibration signal acquired from the planetary gearbox test rig is utilized to analyze according to the feature extraction, selection and weighting method proposed in Section 2.2. Fig. 5 shows the sensitive degree of the 36 features. Where Fig. 6(a) is the result of health status and working condition change at the same time, Fig. 6(b) is the result of working condition changes. It can be seen from the two figures that some features have high sensitive degree no matter health status and working condition change at the same time or only the working condition changes, for example # (mean square value), # (variance) and # (energy), some features have high sensitive degree only when working condition changes, for example # (maximum value), # (minimum value), # (peak to peak) and # (peak value). In addition, # (average value) can be of high sensitive degree only when health status and working condition change at the same time.
The appropriate features which are sensitive to the changing of health status and insensitive to the changing of the working condition can be obtained by the D-value of Fig. 6(a) and (b), as Fig. 7 (a) shows. The final sensitive degree of the 36 features can be seen in the figure. According to the principle described in Section 2.2.2, features (average value), (RMS), (Standard deviation), (square mean absolute root), (crest factor), (clearance factor), (mean frequency) and (ER)are selected because the sensitive degree value of them are greater than zero. Repeat the Steps (1)-(6) in Section 2.2.2 on the selected features, the weighting coefficients can be obtained as Fig. 6 (b) shows. Thus, the new feature which we wanted can be got and
calculated as follows:
= + 0.413 + 0.413 + 0.293 + 0.365
+0.267 + 0.513 + 0.246 . (14)
Fig. 6. a) The sensitive degree of the 36 features with health status and working condition change;
b) the sensitive degree of the 36 features with only working condition changes
Fig. 7. a) The final sensitive degree of the 36 features;
b) the weighting coefficients of the selected features
3.2.2.EMD decomposition and IMFs selection
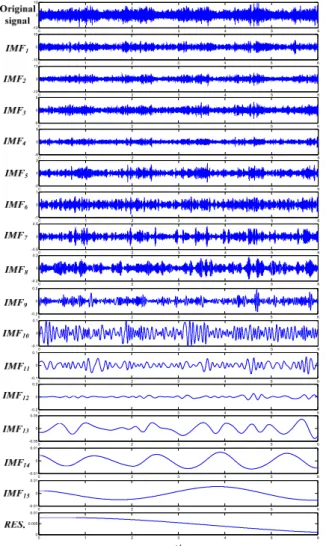
The vibration data used to EMD decomposition contain 4 kinds of health statuses, normal, sun gear fault, planet gear fault and ring gear fault, and each health status has 30 samples. After all of the samples processed by EMD, 15-23 IMFs can be obtained. Taking the planet gear fault signal which are acquired when the working condition is 1200 rpm and 1.2 Nm as example, the result of EMD decompsition can be seen in Fig. 8.
Table 3. Energy of each IMF and its ration to original signal’s
IMF Energy value Ratio IMF Energy value Ratio
IMF1 53709.870 36.984 % IMF9 85.834 0.059 % IMF2 47114.249 32.443 % IMF10 74.311 0.051 % IMF3 22002.869 15.151 % IMF11 29.018 0.020 % IMF4 10721.077 7.382 % IMF12 12.499 0.009 % IMF5 4602.699 3.169 % IMF13 13.578 0.009 % IMF6 2191.147 1.509 % IMF14 0.889 <0.009 % IMF7 563.228 0.388 % IMF15 0.763 <0.009 % IMF8 138.612 0.096 % RES. 1.862 <0.009 %
Where the energy value of original signal is 145223.241
According to the IMFs selection method proposed in Section 2.1.2, the energy ratio of each IMF and original signal can be obtained, see Table 3. It can be seen from Table 3 that the energy ratio of the first to the sixth IMF and original signal is much larger than the others, so the six IMFs are selected. In order to decrease computed error, this paper combines the seventh to the fifteenth
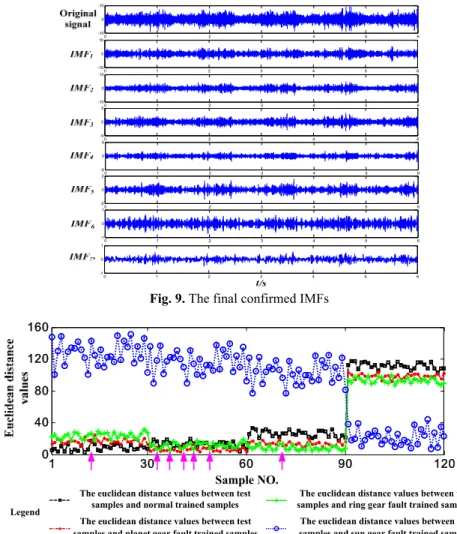
IMF and the residual signal together and make it as a new IMF, IMF7*, as Fig. 9 shows.
3.2.3.Diagnosis result
After obtaining the new feature and the IMFs which contain main fault information, the next step is extracting the from each selected IMF to constitute a feature vector to be used by EDT. 0 1 2 3 4 5 6 -10 0 10 0 1 2 3 4 5 6 -10 0 10 0 1 2 3 4 5 6 -5 0 5 0 1 2 3 4 5 6 -5 0 5 0 1 2 3 4 5 6 -2 0 2 0 1 2 3 4 5 6 -1 0 1 0 1 2 3 4 5 6 -0.5 0 0.5 0 1 2 3 4 5 6 -0.2 0 0.2 0 1 2 3 4 5 6 -0.2 0 0.2 0 1 2 3 4 5 6 -0.1 0 0.1 0 1 2 3 4 5 6 -0.1 0 0.1 0 1 2 3 4 5 6 4 -0.2 0 0.2 0 1 2 3 4 5 6 -0.05 0 0.05 0 1 2 3 4 5 6 -0.01 0 0.01 0 1 2 3 4 5 6 -0.01 0 0.01 0 1 2 3 4 5 6 4 0 0.005 0.01 0 1 2 3 4 5 6 -10 0 10
Fig. 8. The result of EMD decompsition of the planet gear fault signal
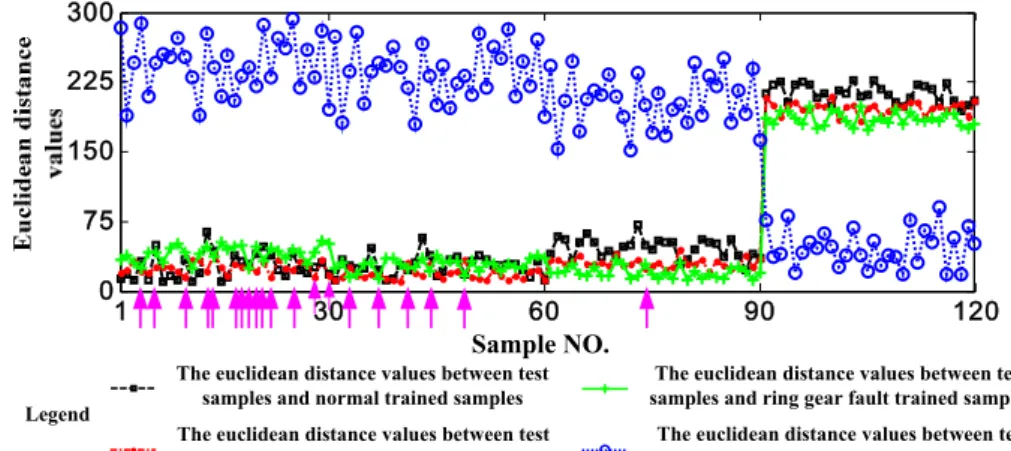
This paper uses the vibration data of 4 kinds of health statuses, normal, sun gear fault, planet gear fault and ring gear fault which are all acquired when the working condition is 1200 rpm and 1.2 Nm. Selecting 33 samples from each health status, the first to the third samples are used as the trained samples and the other 30 samples are utilized as the test samples. Therefore, there are 120 test samples. Extracting the new feature from the first to the sixth IMFs and IMF7* which
made up by the other IMFs and the residual signal of each sample. The feature vector is constituted by 7 numbers. Finally, calculating the Euclidean Distance values between each test sample and the 4 kinds of trained samples using the feature vectors, the results are shown as Fig. 10. It can be seen from the figure that the Euclidean Distance values between 91-120 test samples and the sun gear fault trained samples are less than others obviously. The reason is that the damage of sun gear
is a little serious than planet gear and ring gear. Similarly, it can be seen from the figure that the 1-30 test samples are in normal status, the 31-60 test samples are in planet gear fault status and the 61-90 test samples are in ring gear fault status. In addition, the status of the test samples which the arrow directing are judged incorrectly. For example, the real status of the test sample which the first arrow directing is normal, but it will be judged to be in planet gear fault status due to the Euclidean Distance value between it and planet gear fault trained sample is less than others. 7 test samples are judged incorrectly. Namely, the accuracy of the method proposed in this paper is 94.17 %. 0 1 2 3 4 5 6 -1 0 1 0 1 2 3 4 5 6 -10 0 10 0 1 2 3 4 5 6 -10 0 10 0 1 2 3 4 5 6 -5 0 5 0 1 2 3 4 5 6 -5 0 5 0 1 2 3 4 5 6 -2 0 2 0 1 2 3 4 5 6 -1 0 1 0 1 2 3 4 5 6 -10 0 10
Fig. 9. The final confirmed IMFs
1 30 60 90 120 0 40 80 120 160 Sample NO.
The euclidean distance values between test samples and normal trained samples The euclidean distance values between test samples and planet gear fault trained samples Legend
Diagnosed incorrect samples The euclidean distance values between test samples and ring gear fault trained samples The euclidean distance values between test samples and sun gear fault trained samples
Fig. 10. Diagnosis results using the method proposed in this paper
4.Methodological validation
In order to validate the proposed fault diagnosis method for planetary gearbox, experimental and industrial data are utilized.
4.1.Validation by experimental data
In order to validate the effectiveness of the proposed method, this paper uses the experimental data at first. The specific set can be seen in Table 4.
4.1.1.Validate the effectiveness of the method
The data used before is acquired when the working condition is 1200 rpm and 1.2 Nm, in order to validate the effectiveness of the method, the data that acquired when the working condition is 800 rpm and 0.4 Nm is also utilized to be analyzed. The process of the analyzing is as same as before and Fig. 11 shows the diagnosis results. Similarly, it can be seen that 11 test samples are judged incorrectly. Namely, the accuracy of the method proposed in this paper is 90.83 %. Therefore, the effectiveness of the proposed method can be validated.
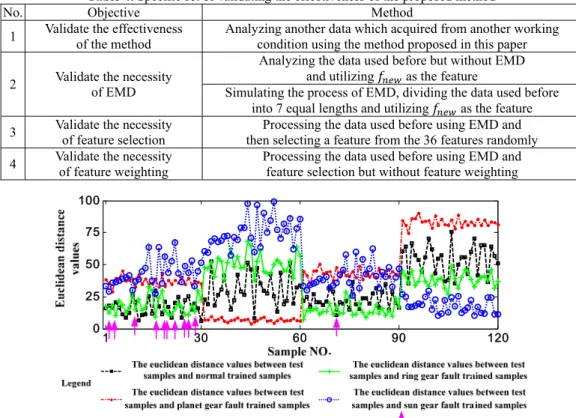
Table 4. Specific set of validating the effectiveness of the proposed method
No. Objective Method
1 Validate the effectiveness of the method Analyzing another data which acquired from another working condition using the method proposed in this paper 2 Validate the necessity of EMD
Analyzing the data used before but without EMD and utilizing as the feature
Simulating the process of EMD, dividing the data used before into 7 equal lengths and utilizing as the feature 3 Validate the necessity of feature selection then selecting a feature from the 36 features randomly Processing the data used before using EMD and 4 Validate the necessity of feature weighting Processing the data used before using EMD and feature selection but without feature weighting
1 30 60 90 120 0 25 50 75 100
Fig. 11. Diagnosis results using data acquired when the working condition is 1200 rpm and 0.4 Nm
1 30 60 90 120 0 45 90 135 180
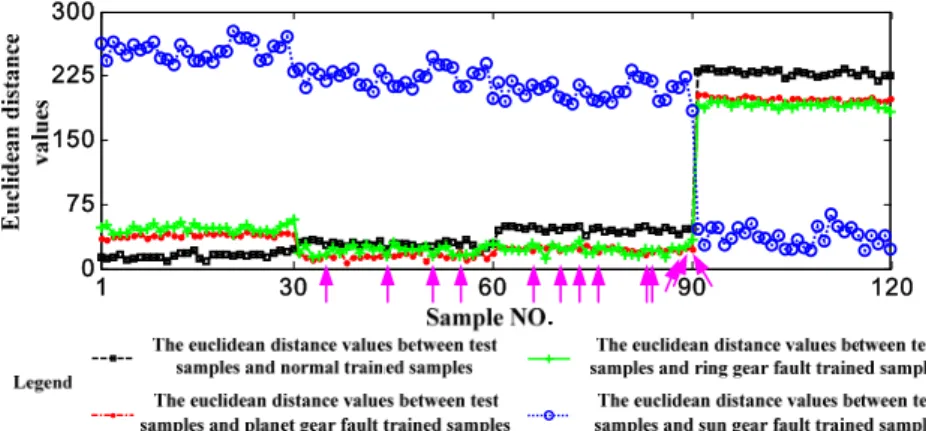
4.1.2.Validate the necessity of EMD
The data acquired when the working condition is 1200 rpm and 1.2 Nm is still utilized here but EMD will be not implemented. Fig. 12 shows the diagnosis results. Additionally, in order to validate the necessity of EMD further, this paper simulates the process of EMD by dividing the data used before into 7 equal lengths. Fig. 13 shows the diagnosis results. It is needed to emphasize that both of the two ways are still utilize as the feature. It can be seen from the two figures that 16 and 13 test samples are judged incorrectly, respectively. Namely, the accuracies are 86.67 % and 89.17 % and they are less than 94.17 %. So, the necessity of EMD can be validated.
It also can be seen from the two results that dividing a signal into several equal lengths also can increase the accuracy if EMD cannot be implemented.
1 30 60 90 120 0 75 150 225 300
Fig. 13. Diagnosis results of dividing the data used before into 7 equal lengths
1 30 60 90 120 0 1 2 3 x 10⁴ 1 30 60 90 120 0 0.5 1 1.5 2x 10 7
4.1.3.Validate the necessity of feature selection
The data acquired when the working condition is 1200 rpm and 1.2 Nm is still utilized here and EMD is also implemented, but the feature is selected randomly from the 36 features. Fig. 14 shows the results and it can be seen that 16 test samples are judged incorrectly. Namely, the accuracy is 86.67 % and it is much less than 94.17 %. So, the necessity of feature selection can be also validated.
4.1.4.Validate the necessity of feature weighting
The data acquired when the working condition is 1200 rpm and 1.2 Nm is still utilized but the selected features are not weighted. Namely, ∗= + + + + + + + .
Fig. 15 shows the results and it can be seen that there are 20 test samples are judged incorrectly. The accuracy is 83.33 % and it is also much less than 94.17 %. Therefore, the necessity of feature weighting can be validated.
1 30 60 90 120 0 75 150 225 300 Sample NO.
The euclidean distance values between test samples and normal trained samples The euclidean distance values between test samples and planet gear fault trained samples Legend
Diagnosed incorrect samples The euclidean distance values between test samples and ring gear fault trained samples The euclidean distance values between test samples and sun gear fault trained samples
Fig. 15. Diagnosis results without feature weighting
4.2.Validation by industrial data 4.2.1.Industrial data specifications
Industrial data was analyzed to validate the effectiveness of the method proposed in this paper further. And the industrial data was acquired from a helicopter planetary gearbox due to planetary gearbox is a main part of helicopter engine. Table 5 is the parameters of the planetary gearbox.
Table 5. The configuration parameters of the planetary gearbox of a helicopter
Gear Sun gear Planet gear (number) Ring gear
Number of teeth 94 36 (10) 167
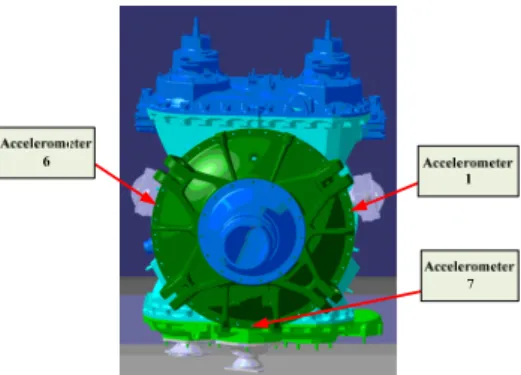
On the whole of the helicopter engine, there are 8 accelerometers. However, only the 1, 6 and 7 accelerometers are installed on the casing of the planetary gearbox. Namely, the three locations are useful and the diagram of the specific locations can be seen in Fig. 16.
Because of the specialty of helicopter, the rotary speed of the sun gear shaft is constant which is 574.74 rpm. And 30 %, 40 % and 50 % of the rated torque of the helicopter are implemented. The data is acquired during the flight time 600 h to 800 h. It is found through open-gearbox examination that the planetary gearbox is healthy after testing. Continue experiment has not been implemented with considering the economy and safety.
Fig. 16. The diagram of accelerometers installed on the casing of the planetary gearbox
4.2.2.Results analysis and discussion
Generally, though the planetary gearbox is healthy, the effectiveness of the proposed method also can be validated if the proposed method has a good performance when analyze the data acquired from different working conditions. Therefore, the signal acquired from the three kinds of torques is analyzed in this section. Following the procedure of the method proposed in Section 2, the diagnosis result is shown in Fig. 17. It can be seen from the results that 3 in 30 test samples are judged incorrectly. Namely, the accuracy is 90 %. The effectiveness of the proposed method can be validated once more.
1 5 10 15 20 25 30 0 0.5 1 1.5 2x 10 6
Fig. 17. Diagnosis results using helicopter planetary gearbox data
5.Conclusions
In this paper, the dilemmas of planetary gearbox fault diagnosis are point out first. Then a feature selection and fault diagnosis method based on EMD and EDT is proposed to solve these problems and output the diagnosis results intelligently and quantitatively. In the proposed method, an IMF selection method based on energy ratio is proposed first. Then a two-stage feature selection and weighting method based on EDT is applied to planetary gearbox fault diagnosis and 36 feature parameters are extracted before this process. Finally, compute out the feature vector matrix of each raw signal and gain the diagnosis results through calculating the Euclidean Distance value between two feature vector matrixes. A planetary gearbox test rig is established and four kinds of health conditions are simulated. Furthermore, the effectiveness of the proposed method is validated by industrial and experimental data.
References
[1] Lei Y. G., He Z. J., Lin J., Han D., Kong D. T. Research advances of fault diagnosis technique for
planetary gearboxes. Journal of Mechanical Engineering, Vol. 47, Issue 19, 2009, p. 59-67.
[2] Samuel P. D., Pines D. J. A review of vibration-based techniques for helicopter transmission
diagnostics. Mechanical Systems and Signal Processing, Vol. 282, 2005, p. 475-508.
[3] Feng Z. P., Zuo M. J. Fault diagnosis of planetary gearboxes via torsional vibration signal analysis.
Mechanical Systems and Signal Processing, Vol. 36, 2013, p. 401-421.
[4] Tsai S. J., Huang G. L., Ye S. Y. Gear meshing analysis of planetary gear sets with a floating sun
gear. Mechanism and Machine Theory, Vol. 84, 2015, p. 145-163.
[5] Liang X. H., Zuo M. J., Hoseini M. R. Vibration signal modeling of a planetary gear set for tooth
crack detection. Engineering Failure Analysis, Vol. 48, 2015, p. 185-200.
[6] Molina Vicuna C. Theoretical frequency analysis of vibrations from planetary gearboxes. Forsch
Ingenieurwes, Vol. 76, 2012, p. 15-31.
[7] Feng Z. P., Zuo M. J. Vibration signal models for fault diagnosis of planetary gearboxes. Journal of
Sound and Vibration, Vol. 331, 2012, p. 4919-4939.
[8] Lei Y. G., Han D., Lin J. Planetary gearbox fault diagnosis using an adaptive stochastic resonance
method. Mechanical Systems and Signal Processing, Vol. 38, 2013, p. 113-124.
[9] Feng Z. P., Liang M. Complex signal analysis for wind turbine planetary gearbox fault diagnosis via
iterative atomic decomposition thresholding. Journal of Sound and Vibration, Vol. 333, 2014, p. 5196-5211.
[10] Feng Z. P., Liang M. Fault diagnosis of wind turbine planetary gearbox under nonstationary
conditions via adaptive optimal kernel time-frequency analysis. Renewable Energy, Vol. 66, 2014, p. 468-477.
[11] Feng Z. P., Chen X. W., Liang M. Iterative generalized synchrosqueezing transform for fault
diagnosis of wind turbine planetary gearbox under nonstationary conditions. Mechanical Systems and Signal Processing, Vol. 52, Issue 53, 2015, p. 360-375.
[12] Hong L., Dhupia J. S., Sheng S. W. An explanation of frequency features enabling detection of faults
in equally spaced planetary gearbox. Mechanism and Machine Theory, Vol. 73, 2014, p. 169-183.
[13] Liang X. H., Zuo M. J., Pandey M. Analytically evaluating the influence of crack on the mesh
stiffness of a planetary gear set. Mechanism and Machine Theory, Vol. 76, 2014, p. 20-38.
[14] Chen J. L., Zhang C. L., Zhang X. Y. Planetary gearbox condition monitoring of ship-based satellite
communication antennas using ensemble multiwavelet analysis method. Mechanical Systems and Signal Processing, Vols. 54-55, 2015, p. 277-292.
[15] Lebold M., McClintic K., Campbell R., Byington C., Maynard K. Review of vibration analysis
methods for gearbox diagnostics and prognostics. Proceedings of the 54th Meeting of the Society for Machinery Failure Prevention Technology, Virginia Beach, VA, 2000, p. 623-634.
[16] Lei Y. G., Zuo M. J. Gear crack level identification based on weighted K nearest neighbor
classification algorithm. Mechanical Systems and Signal Processing, Vol. 23, 2009, p. 1535-1547.
[17] Liu Z. L., Qu J., Zuo M. J., Xu H. B. Fault level diagnosis for planetary gearboxes using hybrid
kernel feature selection and kernel fisher discriminant analysis. International Journal of Advanced Manufacturing Technology, Vol. 67, 2013, p. 1217-1230.
[18] Liu Z. L., Zhao X. M., Zuo M. J., Xu H. B. Feature selection for fault level diagnosis of planetary
gearboxes. Advances in Data Analysis and Classification, Vol. 8, 2014, p. 377-401.
[19] Huang N. E., Shen Z., Long S. R. The empirical mode decomposition and the Hilbert spectrum for
nonlinear and nonstationary time series analysis. Proceeding of the Royal Society of London, Vol. 454, 1998, p. 903-995.
[20] Li H., Zhang Y. P., Zheng H. Q. Wear detection in gear system using Hilbert-Huang transform.
Journal of Mechanical Science and Technology, Vol. 20, 2006, p. 1781-1789.
[21] Feng Z. P., Chu F. L. Transient hydraulic pressure fluctuation signal analysis of hydroturbine based
on Hilbert-Huang transform. Proceedings of the Chinese Society of Electrical Engineering, Vol. 25, 2005, p. 111-115.
[22] Feng Z. P., Li X. J., Chu F. L. Application of stationary wavelet packets decomposition based hilbert
spectrum to nonstationary hydraulic turbine vibration signal analysis. Proceedings of the Chinese Society of Electrical Engineering, Vol. 26, 2006, p. 79-84.
[23] Feng Z. P., Chu F. L. Frequency demodulation analysis method for fault diagnosis of planetary
[24] William H., Andrew H., Jonathan S. A helicopter powertrain diagnostics and prognostics demonstration. IEEE Aerospace Conference Proceedings, Vol. 6, 2000, p. 355-365.
Haiping Li was born in 1990 and he received the B.S. degree from Beijing Institute of
Technology, Beijing, China, in 2012. And received the M.S. degree from Mechanical Engineering College, Shijiazhuang, China, in 2014. He is now a Ph.D. student studying in Mechanical Engineering College, Shijiazhuang, China. His main research interests include signal processing, mechanical equipments fault diagnosis and prognosis.
Jianmin Zhao received the B.S. and M.S. degree in Tsinghua University, Beijing, China,
in 1985 and 1988, respectively. He received Ph.D. degree from the University of Birmingham, Birmingham, UK, in 2007. He is currently a Professor at Mechanical Engineering College, Shijiazhuang, China. He has published 50 journal papers and as a reviewer for the following journals: Journal of Systems Engineering and Electronics, Defense Technology, IEEE Transactions on Reliability, and European Journal of Operational Research. He is now leading a group in Key Lab of Reliability Centered Maintenance for application of condition based maintenance technologies to vehicles, wind turbines and helicopters. His currently research interests include degradation modeling for mechanical components, maintenance decision making, and warranty return policy.
Jian Liu was born in 1990. Currently he is a Ph.D. candidate in college of communication
and information engineering at Nanjing University of Posts and Telecommunications (NJUPT), Nanjing, China. His research interests are in the areas of stochastic resonance (SR) and its applications, including signal detection, signal transmission, signal processing, and digital communication system.
Xianglong Ni received the B.S. degree from Jimei University, Xiamen, China, in 2011.
And received the M.S. degree from Mechanical Engineering College, Shijiazhuang, China, in 2013. He is now a Ph.D. student studying in Mechanical Engineering College, Shijiazhuang, China. His main research interests include gearbox fault diagnosis and prognosis, degradation modeling, and maintenance decision making.