Learning Analytics in Online Language Learning: Challenges and Future Directions
Michael Thomas, Hayo Reinders and Anouk Gelan
Introduction
Over the last two decades universities have steadily increased investment in digital technologies and online learning in the belief that they will enhance learning and the student experience. The increased focus on online learning has led to the integration of digital technologies and platforms that have transformed the way language learners and teachers interact (Fischer, 2012). This integration has also enabled the
development of the field of learning analytics (LA), or “The measurement, collection, analysis, and reporting of data about learners and their contexts for purposes of understanding and optimising learning and the environment in which it occurs” (Siemens & Long, 2011, para 14). Despite the promise of LA (Dychoff, Zielke, Bültmann, Chatti & Schroeder, 2012), its use and influence in language learning and teaching have thus far been minimal. In seeking to address the challenges and future potential of learning analytics this chapter firstly examines some of the key questions raised by the research literature that will influence language education over the next decade and investigates what kind of data can be used to inform effective decision-making in online language learning contexts and how it can be visualised.
The second half of the chapter turns to consider preliminary data arising from the needs analysis phase of the VITAL Project (Visualisation Tools and Analytics to Monitor Online Language Learning and Teaching), a two-year EU-funded project that specifically addresses the gap in the research literature on analytics in language learning and teaching. VITAL aims to help teachers, students and course designers to
understand language learners’ engagement by tracking their digital footprints and answering such research questions as: Does the online student activity indicate whether the student is learning successfully? How can student engagement be
measured? Is it possible to predict how well students are going to do without focusing exclusively on their summative grades? What are the correlations between course design, tool usage, and student performance? By exploring the role that language learning can play in this respect, this chapter responds to the call made by Dawson, Gasevic and Mirriahi (2015), that in order to develop the field of LA further, it is necessary to “provide opportunities to bring in new voices from diverse disciplines into dialogue and experiment with alternate approaches that challenge the security of our often tightly held beliefs” (p. 2). Before examining preliminary data from the VITAL project, the first section of the chapter considers developments in the wider context of education.
The emergence of learning analytics
In the first wave of educational technology identified by the American technology association EDUCAUSE in 2000, learning management systems figured prominently. Investment in the technology led to its rapid development across global higher
education as a gateway to online teaching and learning evident in the increased prominence of Blackboard and Moodle. In the second wave, Web 2.0 collaborative technologies emerged between 2005 and 2010 and emphasized learner connectedness and creativity. Learning analytics belongs to a third wave in which instructors and learners are engaged in measuring learning activities. As a result of renewed interest in online and blended forms of learning and the emergence of massive open online courses (MOOCs), tracking learner movements and task activities that contribute to
The use of analytics has been prevalent in the business world since the 1990s where it has been justified as a way of making organisational processes more efficient and eliminating wastage. Given the consolidation of neoliberalism in higher education over the last decade (Block, Gray & Holborow, 2012) the application of business intelligence to education is a natural development. In education, the emergence of ‘big data’ (Bienkowski, Feng & Means, 2012) has led to significant interest in the field by a range of stakeholders from administrators to classroom instructors, each hoping to address problems such as student retention, low motivation and lack of engagement. In the educational context it is necessary to distinguish between academic analytics and learning analytics, where the former relates to business intelligence about the organisation (Campbell, Debloi & Oblinger, 2007) and the latter is increasingly concerned with using data to inform pedagogical processes, such as the design of tasks or the nature and scope of instructor-led interventions. Both processes depend heavily on the development of new techniques and algorithms in educational data mining in order to identify synergies and patterns in the data collected (Bienkowski, Feng & Means, 2012).
The purpose of learning analytics
Developing from earlier approaches that focused on summative tests and performance data associated with student success, interest in the field over the last five years has led to a diversified understanding which is more nuanced vis-à-vis the various
stakeholders involved. Through the analysis of large amounts of data about individual student behaviour, often triangulated from a variety of on- and offline sources
including virtual learning environments, test scores, and library and teaching room access, educators aim to identify learning habits and to design effective interventions
in more reflective learning practices based on access to real-time data about their patterns of activity. A data-driven approach may help course developers to create a case for pedagogical and institutional change. On the other hand, it is also necessary to have more studies investigating the factors influencing resistance to analytics, increased surveillance and threats to privacy.
Widespread use of social networking sites and other daily online activities has led to interest in the data traces web site users leave behind whenever they access online resources. Based on user experience, the Web now predicts and recommends products, services and friends for individual users’ networks. As higher education moves to a mass system, institutions are turning to consider the role of analytics to visualise complex data sets on engagement in an area increasingly underpinned by the idea of student-as-customer. The application of big data has led to research on
adaptive forms of modelling (i.e., the use of data from previous or different cohorts to engage in predictive testing of the impact of instructional models) that can be used to predict future student success or failure.
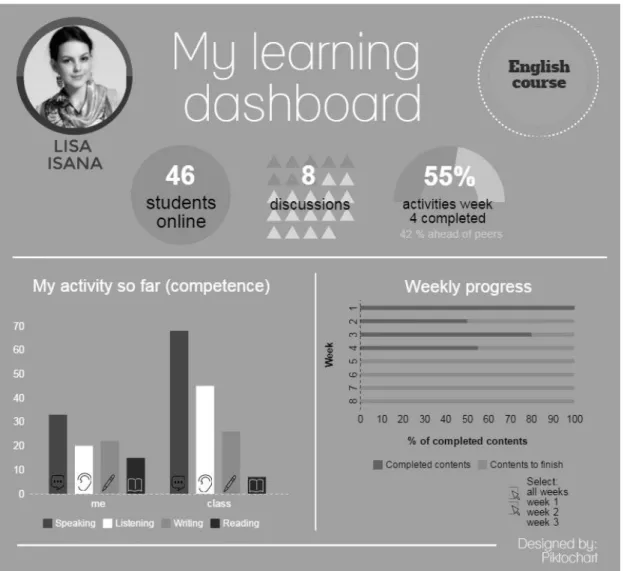
Over the last few years dashboards have become an integral component of many everyday applications and digital devices. They are used to record and display large amounts of data in visually appealing formats in real time (see Figure 1 for an example).
Figure 1: An example of a student dashboard
Students in higher education are less familiar with the use of dashboards in formal education however, and more research is required on the indicators they perceive as useful and how likely they are to use them to aid learning.
Learning analytics in language education
The increased use of digital technologies in language learning has been a steady trend over the last two decades. According to meta-analyses of research on computer-assisted language learning (CALL), a small but significant correlation between the use of technology and second language acquisition is evident (Plonsky & Ziegler,
about how language learners spend their time, utilise resources and learning materials and interact in online environments (Youngs, Moss-Horwitz & Synder, 2015)..
Chapelle (2001) argued that it is “necessary to identify the observable data that provide evidence of CALL qualities” (p. 36). In e-learning environments, data is routinely captured about what users do, when, with whom and how frequently. Such data can on the one hand be used to investigate the relationship between second language learning and CALL software (Fischer, 2007) and on the other hand to produce more adaptive environments that respond to the decisions learners make. Youngs, Moss-Horwitz and Synder (2015), for example, discuss the potential of data mining for online French learning and argue that learning analytics could prove useful to instructors by answering questions such as:
How much time do students spend on lessons, sections of lessons, exercises for lessons?
What do students do when they have questions?
Do they continue without the answer, or do they return to an explanation and then retry the exercise?
What is an average amount of time that students spend in an online language course, in each section, and on each exercise?
If the time is not ‘equivalent’ to the time students spend in a traditional course, does this mean that the online learner is disadvantaged in some way? (p. 348). While self-reporting on user activity through qualitative data capture in the form of stimulated recall or interviews can be unreliable on its own, the use of learners’ data logs may provide support about frequency of activity as Youngs et al. (2015) suggest. On the other hand, this quantitative focus may offer little insight into a rationale for students’ behaviour. As Fischer (2007) puts it, tracking “should certainly be a
substantial part of quantitative data collection” but “we should not use tracking in isolation because while it clearly shows what students do, it does not explain why they do what they do.” (p. 430). In line with normalised e-learning tools such as the anti-plagiarism application Turnitin, analytics requires an instructor to engage in interpretation and scrutiny of the data rather than accepting it at face value.
Related to this is the use of analytics to aid personalisation of feedback. Link and Li (2015) report a study of Blackboard Learn Performance Dashboard and Retention Center (an online dashboard that gives information about student
engagement with Blackboard’s Learning Management System) from a graduate-level research writing course for non-native English speaking students. According to them, the goal of learning analytics is to “enable practitioners to tailor educational
opportunities to each student’s level of need and ability” (p. 372). Moreover, the results of tracking can lead to evidence that provides the impetus for syllabus and course redesign and new strategies for effective feedback.
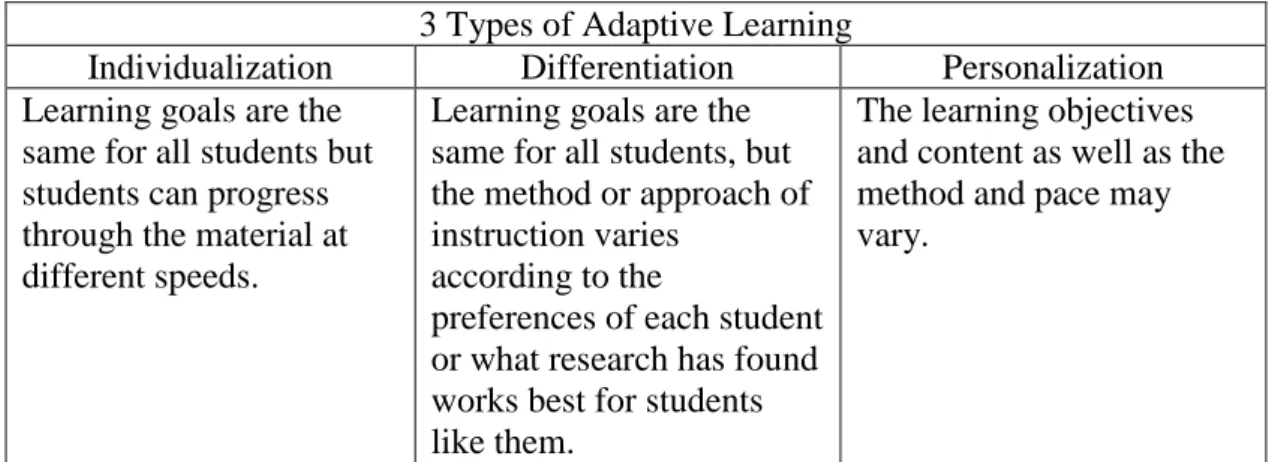
Analytics has also been linked to the development of opportunities for adaptive learning. According to Kerr (2015), adaptive learning is a “way of delivering learning materials online, in which the learner’s interaction with previous content determines (at least in part) the nature of materials delivered subsequently. Its purpose is to generate personalized learning” (p. 88). The widespread use of VLEs has largely led to the storage and delivery of standardized content rather than customised learning. Kerr provides a useful distinction between three key terms that are often used interchangeably but require clearer definition: individualization, differentiation and personalization (see Figure 2).
Figure 2. Individualization, Differentiation and Personalization 3 Types of Adaptive Learning
Individualization Differentiation Personalization Learning goals are the
same for all students but students can progress through the material at different speeds.
Learning goals are the same for all students, but the method or approach of instruction varies
according to the
preferences of each student or what research has found works best for students like them.
The learning objectives and content as well as the method and pace may vary.
Adapted from Kerr (2015), p. 88.
Popular online learning platforms such as Rosetta Stone and Duolingo attempt to harness historical data from users to select and plan the tasks that students are given. As Kerr suggests, they are based on an individualization approach in which some aspects of differentiation are evident. In order for them to be effective however they need to be able to collect more fine-grained data about individual language learners. One way of doing this is through dashboards. Verbert, Duval, Klerkx, Govaerts and Santos (2013) investigated the use of 15 dashboards. The indicators used, such as test results, time spent on various tasks, the frequency of use vis-à-vis language learning activities and resources, and the quantity of language learning discussions, were not shown to be specific to language learning and could have been used with any discipline. So while more recent forms of learning analytics are moving away from purely quantitative measures and toward a recognition of measuring social learning, it is still not clear which indicators can be visualised to provide meaningful knowledge of language learning processes.
In the specific case of language learning, complex algorithms will be needed because the process of SLA cannot be assumed to be linear (Larsen-Freeman, 1997). Kerr (2015) argues that the emergence of language proficiency scales such as the
Cambridge English Scale and the Pearson Global Scale of English are based on language knowledge rather than actual competence. Similarly, the development of adaptive learning in online platforms is connected with learning vocabulary and grammar items, particularly with lower-level learners where information about
frequency of usage is more relevant than at the more advanced stages. At the moment, developments within adaptive learning are more suited to subjects such as
mathematics, and English language teaching has yet to see significant interest. As a result the use of the platforms mentioned above (i.e., Rosetta Stone and Duolingo) rely more on individualisation rather than differentiation or personalisation in the language learning context.
While Kerr (2015) was interested in small-scale online environments, it is clear that the emergence of MOOCs has given a new emphasis to analytics, primarily as a response aimed at understanding drop-out rates, as well as the uneven participation of large, international student cohorts. Moving from an initial stage focused heavily on quantitative analysis, MOOCs have more recently prompted research on social interaction. CALL researchers seeking to develop a research agenda in this field can learn a great deal from the use of social network theory and visualisation techniques evident in Coffrin, Corrin, de Barba and Kennedy’s (2014) work, as well as the importance of different types of learner profiles identified by Dyckhoff et al. (2012).
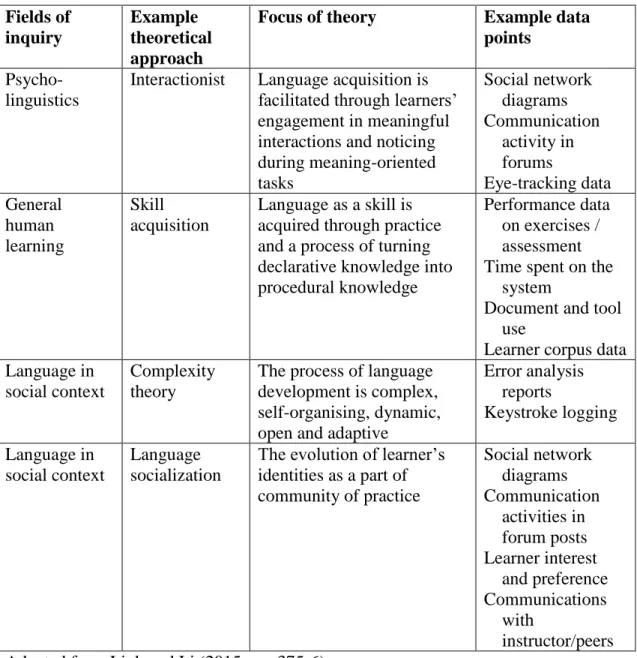
As CALL research begins to pay more attention to the use of analytics and the types of indicators that will be necessary to understand language learning processes, the role of theory will become increasingly important (Chapelle, 2001). Link and Li’s (2015) contribution is important here, as they provide a framework that integrates three theoretical approaches: interactionist, skills acquisition and complexity theory (see Figure 3).
Figure 3. The Role of Theory in Language Learning Analytics Fields of inquiry Example theoretical approach
Focus of theory Example data points
Psycho-linguistics
Interactionist Language acquisition is facilitated through learners’ engagement in meaningful interactions and noticing during meaning-oriented tasks Social network diagrams Communication activity in forums Eye-tracking data General human learning Skill acquisition Language as a skill is acquired through practice and a process of turning declarative knowledge into procedural knowledge
Performance data on exercises / assessment Time spent on the system
Document and tool use
Learner corpus data Language in
social context
Complexity theory
The process of language development is complex, self-organising, dynamic, open and adaptive
Error analysis reports Keystroke logging Language in social context Language socialization
The evolution of learner’s identities as a part of community of practice Social network diagrams Communication activities in forum posts Learner interest and preference Communications with instructor/peers Adapted from Link and Li (2015, pp. 375-6).
Link and Li also highlight a number of challenges associated with incorporating learning analytics, indicating that the transition may be slow. Such challenges include resistance from instructors who fear technology may replace them to those who reject online feedback and assessment and who need further training (Ali, Asadi, Gasevic, Jovanovic & Hatala, 2013). Ethics, security and privacy vis-à-vis the collected data remain a significant concern, particularly when data is viewed as capable of
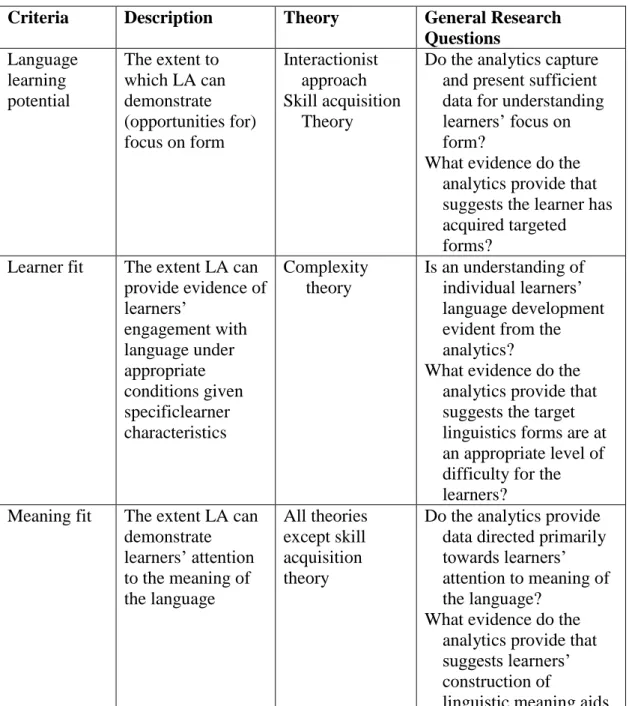
predicting student performance. The ethical challenges need to be set within the wider context of a theoretically informed approach according to Link and Li (2015), and their adaptation of Chapelle’s (2001) model of task and CALL-based activities provides a potential path for considering key pedagogical questions such as: What kinds of data can be collected on language learners? Who should have access to the data? Who should benefit? (see Figure 4).
Figure 4. Criteria for researching the use of learning analytics in online language learning
Criteria Description Theory General Research Questions Language learning potential The extent to which LA can demonstrate (opportunities for) focus on form Interactionist approach Skill acquisition Theory
Do the analytics capture and present sufficient data for understanding learners’ focus on form?
What evidence do the analytics provide that suggests the learner has acquired targeted forms?
Learner fit The extent LA can provide evidence of learners’ engagement with language under appropriate conditions given specificlearner characteristics Complexity theory Is an understanding of individual learners’ language development evident from the analytics?
What evidence do the analytics provide that suggests the target linguistics forms are at an appropriate level of difficulty for the learners?
Meaning fit The extent LA can demonstrate learners’ attention to the meaning of the language All theories except skill acquisition theory
Do the analytics provide data directed primarily towards learners’ attention to meaning of the language?
What evidence do the analytics provide that suggests learners’ construction of
language learning? Authenticity The degree of
correspondence in LA data collection and analysis between target language activities and tasks beyond the classroom Language socialization Do the analytics demonstrate a correspondence
between target language activities and tasks beyond the classroom? What evidence do the analytics provide that suggests learners see the connection between classroom activities and outside tasks?
Positive impact
The positive effects of LA use on stakeholders
Language socialization
Will users have a positive experience with using LA?
Practicality The adequacy of resources to support the use of LA in language classrooms
N/A What kind of available LA or predictive models may fit the pedagogical goals of CALL?
Are there any policies in place or measures taken to ensure transparency in data collection, management, analysis and storage?
Is there adequate support to help users of LA utilize the tool in an effective way?
Are the data from the LA tool sufficient to allow for the management and prediction of student success?
Adapted from Link and Li (2015), pp. 379-80.
This framework shows how the category of ‘Language Learning Potential’ allows analytics to collect data to understand and measure the “quality of interaction and practice” (p. 380). ‘Learner Fit’ leads to questions about how analytics can be used to understand individual learner development. ‘Meaning Focus’ questions the ways analytics can be used to evaluate attention to meaning. ‘Authenticity’ measures the fit between in-class and outside activities. ‘Positive Impact’ relates to the extent
analytics can be used in language research. The final category, ‘Practicality’, focuses on the type of support required by instructors, learners and administrators and
explores the adequacy of the resources needed to undertake learning analytics in the CALL context. One weakness in this approach is that the indicators are exclusively focused on instructors rather than on students. A more developed model would include variables that students perceive to be useful in their learning engagement and more research is needed in this area.
In turning to the first large-scale project on learning analytics and online language learning, Link and Li’s theoretical framework provides a useful starting point to consider the role of dashboards for language learners and instructors.
Case Study: The VITAL Project
VITAL (Visualisation Tools and Analytics to Monitor Online Language Learning and Teaching) is a two-year Erasmus+ project (2015-2017) funded by the European Commission. The project aims to reposition the debate about analytics in language education by focusing on its pedagogical potential for both instructors and students, thus moving away from the current emphasis on using analytics merely to administer learning. Improving the quality of language learner engagement is therefore a
significant component. Unlike previous research in the field, which relied on students to report on their own progress, VITAL draws on the opportunities afforded by new forms of online learning to trace their actual online activities. Based on these ‘digital traces’ it aims to identify and explore the patterns of engagement and interaction that can help language instructors and students understand their own learning
characteristics and to visualise them in an easily accessible format. Dealing exclusively with learning analytics in higher education in the European Union, the
co-ordinator; the University of Central Lancashire in the UK; and the University of Amsterdam in the Netherlands) and a technical partner (HT2 based in the UK). At the University of Central Lancashire, VITAL focuses on two different types of online language courses on Blackboard:
an MA TESOL degree
a BA degree programme in International Business Communication. The project aims to analyse the processes of autonomous learning in these different courses through the use of process mining algorithms to explore the
difference between the course outline, or intended usage of the activities, and what the language students actually do when online. Through the creation of dashboards for students, it aims to provide the learners with the important information to enable them to understand the key variables in their language learning processes, highlighting in particular the indicators of success and failure that may result from the analysis of learning patterns.
Unlike existing learning analytics projects, VITAL aims to use the new xAPI specification to aid the acquisition of more fine-grained data arising from learner activities. Formerly known as Tin Can API Experience, xAPI is a new standard for analytics that enables learning activities to be recorded as activity statements
consisting of <subject> <verb> <object> in which the activity of the student or actor always takes place within a context. For example, xAPI can be used to produce a recipe or instructional code to collect data between two points in time: learner A viewed document B. This data is then sent to a data warehouse or Learning Record Store (LRS). Based on the interoperability integral to xAPI, from there the data can be disseminated across a variety of reporting and visualisation tools and compatible devices such as tablets and smartphones.
VITAL is divided in three main phases. In the first stage a needs analysis was conducted with practitioners and students. Following this, a pilot phase established the tracking procedures using the xAPI specification and applied them to each course design selected for the project. This allowed researchers to explore how the language learners use the e-learning resources, what pathways were chosen, and which areas of the site were used, with which results and how frequently. Following the analysis of the pilot data and data collection procedures, a main study lasting for at least one semester will be conducted in late 2016. In the final phase of the project process mining techniques will be used to aid data analysis to understand the potential patterns in learner interaction.
One of the key deliverables of VITAL relates to the ethical and legal aspects of data collection from the language learners and is based on a UK national policy document on the Ethical Code of Practice for Learning Analytics (JISC, 2015) in order to mitigate any potential risks to learners. It emphasises data ownership, consent, transparency, privacy, validity, access, action, minimizing adverse impact, stewardship of data and security. The data collection is based on consent from students and does not affect their assessment. Moreover, the project’s ethical
framework puts students in control of their own data, emphasizing that it will be used only for the intention of enhancing their learning.
Methodology
During the first phase of VITAL a needs analysis was conducted at each of the three partner universities. Only the needs analysis conducted with participants from the University of Central Lancashire in the UK between March and May 2016 will be the focus of the analysis presented in this chapter.
The needs analysis included a questionnaire with instructors and educational staff and focus groups with students. The questionnaire for instructors and educational staff combined 11 open and closed questions, and as Brown suggests (2011), was the most appropriate method for exploratory research of the type required for learning analytics. The open responses provided the opportunity for stakeholders to give their views on the new area of emerging uses of learning analytics in which the agenda has not yet formed. Participants (m=54%; f=46%) were aged between 25 and 64 years and drawn from a range of roles including researcher, senior manager, course designer, teacher trainee, teacher and research student. Experience ranged from 2 to 20 years in higher education with 44 participants from the UK, 1 from France, 1 from Nigeria, 1 from Saudi Arabia and 1 from Cyprus.
Building on the questionnaire, focus groups with students were also conducted in order to understand their perspectives on the potential of learning analytics
(Heigham & Croker, 2009). The focus groups added a qualitative dimension which as Steel and Levy (2013) suggest, can help to close the gap that exists “between what students are actually doing and where research directions in CALL are taking us’ (p. 319). Two focus groups lasting between 30 and 80 minutes were held with a total of eight students. Volunteers were selected from an online MA in TESOL and final year undergraduate students from a BA in Intercultural Business Communication and they came from Brazil, Canada, China, Germany, Greece and Slovakia. The students (m=62%; f=38%) were aged between 20 and 55 and had English language proficiency ranging from 6.0 to 8.0 on IELTS.
Findings and Discussion
Data from the questionnaire indicated that 84% of instructors and educational staff were familiar with online applications and tools in their teaching and research context, but only 40.8% had used analytics applications. They were familiar with the use of dashboards to provide performance data on health and sports activities and as a result they could see the potential of using them to provide a clear visualisation of their online learner interactions. Instructors and staff who were familiar with learning analytics experienced it mostly through the integrated tracking function in Blackboard as well as through other applications that generated statistics about student
participation. Only 35% of those who had experience of using learning analytics said that they had been positive about their experience of analytics to date.
This data confirmed the finding of Verbert, et al’s (2013) study that more research is required on teachers and learners about the specific indicators that can be used to visualise the language learning process. Given the large amount of
information in the Blackboard dashboard, the focus group students indicated that customisation of student-facing dashboards was important and that they would like the option of being able to view or turn it off as and when they deemed necessary. Some of the interviewed MA students identified the importance of dashboard indicators such as their own grades and attendance information as well as a comparison of their activities as a “way of measuring progress” over a sustained period of time to show if they were “headed in the right or the wrong direction”. One MA student suggested, for example, that the dashboard could help language students by visualising their formative progress across the duration of their module.
Nevertheless, it was also a concern that if used in this way the dashboard might not be an accurate reflection of their out of class or self-directed engagement with language
resources. This confirms Link and Li’s (2015) adaptation of Chapelle’s (2001) model of CALL-based activities, underlining the specific need to investigate questions targeting language learners such as: What kinds of data can be collected? Who should have access to the data? Who should benefit?
Chinese undergraduate students commented that they would like to see the average grades of the group they belonged to as this was a typical feature of student life in their own country. This was the minority view however, and other students argued that being able to see this information on a day-to-day basis might increase anxiety and pressure to achieve group benchmarks rather than compete against themselves and their own personal targets. Both focus groups suggested that
dashboards should have a system for creating alerts and recommendations for further learning. Above all the dashboards should contain a range of functionality and each language learner should have the opportunity to customise and personalise them.
When discussing the potentially negative effects of learning analytics, both MA and undergraduate students identified some concerns about the partial nature of all quantitative data about their online learning and the need to not overemphasize its value. Unless this partial effect is understood and acknowledged it could lead to false actions by a teacher and to a demotivational effect on the learner. Being the subject of too much data capture and surveillance was another potential concern raised;
reflection is a key aspect of learning and sufficient time outside of a zone in which all activity is quantified was also deemed necessary and healthy for learning and
creativity.
The instructors and educational staff in the study also viewed dashboards as potentially valuable, with 86.4% agreeing that the ability of dashboards to visualise
information could be beneficial for their students. Comments by six different staff supported this viewpoint:
“I would be able to target specific students with additional support.”
“Such a dashboard would give insights into [the] online learning experience.” “I think it would be very useful to know the way my students learn, so I can improve the materials and the interaction I have with my students.”
“You can build a profile of each student to help understand them better in terms of their needs and their motivations”.
“A dashboard would provide a single-glance summary which could be very useful given that usage reports can be quite complex to interpret.”
“It would help to know the students and their learning styles, strengths and weaknesses better.”
These comments support the argument that targeting weaker students and gaining insights into different learning styles were perceived advantages of analytics. For the instructors and educational staff the top five highest ranking indicators of learning were activity type accessed (89.4%), students’ scores per activity (87.2%), time spent online (80.9%), formative assessment (78.7%), and level of interaction (78.7%). One instructor commented:
“I would like to see a map of learner-to-learner interaction - showing how they have interacted with each other, how many times; maybe it could be in a matrix table with student names along the top and down one side with the shared box indicated the number of interactions - or presented visually as a kind of neural map with more intense lines between students for more interactions.”
The instructors and staff also perceived dashboards as a potential source of learner motivation and agency:
“This would enable learners to take greater ownership for their online learning.”
On the other hand, one instructor argued that displaying individual student achievement against the average in the group raised concerns and could be
“demotivating.” This view was countered by one of the MA students who argued that students should have the choice of using this feature:
“one thing that I miss at the moment is progress against the rest of the group, because I don’t know whether I’m doing normal or just mediocre, for example on the discussion boards … you get the results … 65% or 75% or something but you don’t actually know [if you are in] … the top quarter [or] lower quarter and … know where you need to go”.
How and where to access dashboard information was also the subject of student discussion. The focus group with undergraduate students concluded that they should be integrated into the Blackboard VLE rather than offered as a 24/7 mobile
application and accessible anytime, anywhere. The opinions of the MA students were divided on this feature. One student wanted to be able to access a dashboard on a range of mobile devices (tablet, phone, laptop); on the other hand, three students suggested that it should be located only on the VLE in order to avoid creating anxiety, overdependence, or becoming a distraction.
While analytics applications are increasingly based on predicting students’ future behaviour based on statistical models, some of the MA students thought this might be too deterministic and lead to partial or false evaluations of their potential:
“I don’t know to what extent we can make predictions regarding learning. … so I’m not quite sure how useful that would be because it’s not a linear progress that we make … we discover something amazing so we make great progress at one point, things go a little more smoothly afterwards, I’m not quite sure how useful that would be.”
“I find predictions are very, very dangerous, because they restrict motivation, it also depends on the environment that somebody’s learning in if someone says you can’t do it, you don’t strive.”
The MA students also challenged the deterministic nature of analytics, pointing out that collecting data only from a VLE gives a limited and incomplete picture of engagement:
“Relying on statistical analysis can be demotivating, the statistics there are very black and white and that would definitely be a problem and could also build up a barrier between the teacher and the pupil.”
Instructors and educational staff likewise noted that carefully interpreting the data and developing appropriate strategies were integral and non-negotiable elements of using learning analytics.
When used strategically and in a non-deterministic fashion, analytics were perceived by students as having potential to improve or at least contribute to
improving more targeted feedback from instructors. One MA student indicated that a benefit could be controlling the amount of input or content that students receive:
“[dashboards seem] like a better alternative than a final exam at the end, so you can maintain your progress throughout the course with a dashboard … [they] would incorporate different things that you have to do for the course, maybe for English teaching for example they’d have to do some reading, some listening, some speaking, maybe have their recordings on there … maintaining a progress portfolio of their progress and how it works.”
Dashboard data may also help to enable language learners to improve revision
techniques: “you teach something today and then you like to revise the same material three months later, what were the results then and what are they now, and am I really getting better and why”. Comparison of their results with last year’s class was also suggested as a potential answer, but this was a feature that students wanted to be able to control individually and hide if necessary.
These results appear to confirm Link and Li’s (2015) research in which analytics may provide evidence for personalising learning, redesigning syllabi and courses and for developing new strategies for effective feedback. In identifying the potential value of dashboards, the questionnaire and focus group data also emphasized the importance of using theory as a guiding principle (e.g., Interactionist, Skill
acquisition, Complexity theory, Language socialization) in order to shape the types of data that can be collected and visualised (Link & Li, 2015). While earlier forms of LA focused on dashboards that merely logged time on task as suggested by Youngs, Moss-Horwitz and Synder’s (2015) questions (e.g., How much time do students spend on lessons, sections of lessons, exercises for lessons?), more work needs to be done to explore how dashboards can visualise the evolution of learners’ identities and how language acquisition is facilitated online through learners’ engagement in meaningful
Limitations and Future Directions
Some of the key issues mentioned by both instructors, educational staff and students as limitations included issues of data overload, privacy, engagement with technology, distancing students from teachers, the impact on motivation, the potential for
manipulating data and the adverse effects of creating competition between students. Digital footprints of language learning activity online (and in the future, combinations of on- and offline activity) may provide language students, instructors and course designers with important information about performance and behaviour that up until now they have only been able to infer rather than determine in any concrete way. While ethical, security and privacy issues are always near the forefront of these new developments, researchers need to accept that the analysis of behavioural data can not prove cause-effect relationships but it can be used to highlight
correlations that may help to understand learning. Moving beyond first-generation learning analytics, which aimed to identify students at risk of dropping out and
failure, research in the second generation is turning towards algorithms that attempt to predict language learner behaviour and understand online social interaction and collaboration. In order to overcome the technical and pedagogical challenges involved in this new phase, researchers in language learning and learning analytics will need to collaborate in cross-functional teams and, above all, involve students in the process of designing, measuring and analysing data about their own strategies for engagement.
References
Ali, L., Asadi, M., Gasevic, D., Jovanovic, J., & Hatala, M. (2013). Factors
influencing beliefs for adoption of a learning analytics tool: An empirical study. Computers & Education, 62, 130-148.
Bienkowski, M., Feng, M., & Means, B. (2012). Enhancing teaching and learning through educational data mining and learning analytics: An issue brief. U.S. Department of Education, Office of Educational Technology.
Block, D., Gray, J., & Holborow, M. (2012). Neoliberalism and applied linguistics. London: Routledge.
Brown, M. (2011). Learning analytics: The coming third wave. Louisville, CO: EDUCAUSE Learning Initiative.
Campbell, J. P., Deblois, P. B., & Oblinger, D. G. (2007). Academic analytics: A new tool for a new era. EDUCAUSE Review, 42(4), 41-57.
Chapelle, C. A. (2001). Computer applications in second language acquisition: Foundations for teaching testing and research. Cambridge, UK: Cambridge University Press.
Coffrin, C., Corrin, L., de Barba, P., & Kennedy, G. (2014). Visualising patterns of student engagement and performance in MOOCs. In Proceedings of the Fourth International Conference on Learning Analytics and Knowledge – LAK 14 (pp. 83-92). New York: ACM Press.
Dawson, S., Gasevic, D., & Mirriahi, N. (2015), Challenging assumptions in learning analytics. Journal of Learning Analytics, 2(3), 1-3
Dychoff, A. L., Zielke, D., Bültmann, M., Chatti, M. A., & Schroeder, U. (2012). Design and implementation of a learning analytics toolkit for teachers. Educational Technology & Society, 15(3), 58-76.
EDUCAUSE LI (2011). Learning analytics: The coming third wave. Retrieved https://net.educause.edu/ir/library/pdf/ELIB1101.pdf
Fischer, R. (2007). How do we know what students are actually doing? Monitoring students’ behavior in CALL. Computer Assisted Language Learning, 20(5), 409-442.
Fischer, R. (2012). A conceptual overview of the history of the CALICO Journal: The phases of CALL. CALICO Journal, 30(1), 1-9.
JISC (2015). Code of practice for learning analytics. Retrieved
https://www.jisc.ac.uk/guides/code-of-practice-for-learning-analytics Kerr, P. (2015). Adaptive learning. ELT Journal, 70(1), 88-93.
Larsen-Freeman, D. (1997). Chaos/complexity science and second language acquisition. Applied Linguistics, 18(2), 141-165.
Link, S., & Li, Z. (2015). Online interaction and learning analytics. In E. Dixon & M. Thomas (Eds.), Researching language learner interactions online: From social media to MOOCs (pp. 369-385). Texas: CALICO.
Plonsky, L., & Ziegler, N. (2016). The CALL-SLA interface: Insights from a second-order synthesis. Language Learning & Technology, 20, 17-37.
Long, P., & Siemens, G. (2011). Penetrating the fog: Analytics in learning and education. EDUCAUSE Review, 46(5).
Verbert, K., Duval, E., Klerkx, J., Govaerts, S., & Santos, J. L. (2013). Learning analytics dashboard applications. American Behavioural Scientist, 57(10), 1500-1509.
Volk, H., Kellner, K., & Wohlhart, D. (2015). Learning analytics in English language teaching. Journal of Universal Computer Science, 21(1), 156-174.
Youngs, B., Moss-Horwitz, S., & Synder, E. (2015). Educational data mining for elementary French on-line: A descriptive study. In E. Dixon & M. Thomas (Eds.), Researching language learner interactions online: From social media to MOOCs (pp. 347-368). Texas: CALICO.