Comfort in Automated Driving:
Analysis of Driving Style Preference in Automated
Driving
Von der Fakultät für Human- und Sozialwissenschaften der Technischen Universität Chemnitz genehmigte
Dissertation
zur Erlangung des akademischen Grades doctor rerum naturalium (Dr. rer. nat.)
vorgelegt von: Hanna Bellem, geboren am 29.11.1987 in Herrenberg eingereicht am: 21.09.2017
Disputation am: 25.05.2018
Erstgutachter: Prof. Dr. Josef F. Krems, Technische Universität Chemnitz Zweitgutachter: PD Dr. Christhard Gelau, Berlin
Summary
Over the last years, driving automation has increasingly moved into focus in human factors research. A large body of research focusses on situations in which the human driver needs to regain control. However, little research has so far been conducted on how SAE level 3+ automated driving should be designed with focus on occupant comfort.
This thesis aims at identifying a comfortable driving style for automated vehicles. As a basis, it was necessary to pinpoint driving metrics, which vary between driving styles and can be manipulated in order to design a comfortable driving style. Hence, Study 1 was conducted, in which drivers (N = 24) manually drove on a highway or on urban and rural roads with certain driving styles. Results show relevant metrics (i.e., lateral and longitudinal acceleration, lateral and longitudinal jerk, quickness, and headway distance in seconds) and that these metrics vary across maneuvers and thus, a maneuver-specific analysis is recommended. As these metrics are derived from manual data, it remained unclear after Study 1, in which range the metric values should vary for comfortable automated driving.
Therefore, as a second step, the main metrics were varied and the subsequent combinations implemented in an automated vehicle as well as in a dynamic simulator with two different configurations. The combinations were then subject to ratings by 72 participants. Results show that the metrics and values found in Study 1, are able to elicit a range of comfort ratings in automated driving. It was also found, that acceleration is a key variable in experiencing comfort. However, it is not the sole predictor. Additionally, as higher levels of automated driving with larger velocities are still bound to considerable constraints for on-road testing, the second study was also used to validate a dynamic driving simulator to allow comfort during automated driving to be studied. In comparison to ratings on a test track, the dynamic simulator setting with longitudinal orientation is able to show both relative and absolute validity of comfort ratings.
In the third and final step, different approaches to automated maneuvers were rated by participants (N = 72) regarding the comfort they experienced. A lane change, an acceleration, and a deceleration maneuver were chosen as test maneuvers. The lateral or longitudinal acceleration was varied in each of these maneuvers. Results, again, show comfort ratings are maneuver specific. On one hand, symmetrical and early-onset lane change maneuvers and symmetrical acceleration maneuvers were preferred. However, symmetrical deceleration maneuvers and deceleration maneuvers with a slower acceleration decrease evoke the highest comfort ratings. These ratings made it possible to offer guidelines for the design of automated driving styles.
Furthermore, dependence on a number of personality traits was analyzed. Results suggest the general preference for certain driving styles to be unaffected by personality. However, it seems,
participants with certain personality types are less particular about their preference for certain driving styles.
Summed up, comfortable automated driving is – under the investigated circumstances –
characterized by maneuvers with sufficient headway distance and smooth applications of small acceleration and small jerk. These should, even so, still provide sufficient motion feedback. Surrounding traffic seems to play an important role through urgency and should be considered for on-road implementation. Differences in personality did not seem to play a crucial role.
Zusammenfassung
Automatisiertes Fahren ist in den letzten Jahren zunehmend in den Fokus von Human Factors Forschung gerückt. Bisher wurde jedoch wenig Forschung betrieben, die sich mit dem Thema eines komfortablen Fahrstils für Fahrzeuge mit SAE Level 3+ beschäftigt.
Ziel dieser Arbeit ist es, einen komfortablen Fahrstil für automatisierte Fahrzeuge zu beschreiben. Im ersten Schritt war es hierzu notwendig, diejenigen Metriken zu identifizieren, die zwischen verschiedenen manuellen Fahrstilen variieren und so manipuliert werden können, dass ein komfortabler Fahrstil entsteht. Hierzu fuhren Probanden (N = 24) in Studie 1 manuell mit jeweils bestimmten Fahrstilen auf der Bundesautobahn oder auch auf Überland- bzw. innerstädtischen Strecken. Die Ergebnisse zeigen, dass je nach Manöver unterschiedliche Metriken relevant sind. Entsprechend wird eine manöverspezifische Analyse empfohlen. Die zentralen Metriken sind laterale und longitudinale Beschleunigung, lateraler und longitudinaler Ruck, Quickness und der Zeitabstand zum Vorausfahrenden. Da diese Metriken auf Fahrdaten aus manueller Fahrt beruhen, bleibt nach Studie 1 offen, welche Ausprägungen oder Wertebereiche zu komfortablem automatisierten Fahren führen.
Aus diesem Grund, wurden die zentralen Metriken im zweiten Schritt variiert und die jeweiligen Kombinationen in einem automatisierten Fahrzeug sowie in einem dynamischen Simulator mit zwei Orientierungen implementiert. Diese Kombinationen wurden von 72 Probanden bewertet. Die Ergebnisse zeigen, dass Metriken und Wertebereiche aus Studie 1 in der Lage sind, eine Spanne an Komfortbewertungen für automatisiertes Fahren aufzuspannen. Es zeigt sich hierbei zudem, dass Beschleunigung eine Schlüsselrolle im Komforterleben spielt, zeitgleich aber auch nicht der einzige Prädiktor für Komforterleben ist. Zusätzlich diente Studie 2 zur Validierung eines dynamischen Fahrsimulators im Hinblick auf Untersuchungen zum Komfortempfinden beim automatisierten Fahren. Da momentan Realfahrtstudien mit SAE Level 3+ Fahrzeugen besonders in höheren Geschwindigkeitsbereichen noch mit sehr großen Hindernissen und Aufwänden verbunden sind, bietet
sich ein dynamischer Simulator als vielversprechende Methode an. Verglichen mit Komfortbewertungen auf einer Teststrecke, zeigt der untersuchte, longitudinal orientierte dynamische Simulator sowohl relative als auch absolute Validität.
Im dritten Schritt wurden verschiedene Ansätze zur Parametrierung automatisierter Manöver von Probanden (N = 72) bezüglich wahrgenommenen Komforts bewertet. Insgesamt wurden der Längs- und Querbeschleunigungsverlauf in Spurwechsel-, Beschleunigungs- und Verzögerungsmanövern variiert. Insgesamt führen symmetrische Manöver zu guten Komfortbewertungen. Wieder zeigt sich jedoch auch, dass die Ergebnisse manöverspezifisch betrachtet werden sollten. Während Spurwechsel mit früherem stärkerem Beschleunigungsverlauf ebenfalls gute Bewertungen erzielen, führen Verzögerungsmanöver mit späteren stärkeren Beschleunigungswerten eher zu höheren Komfortbewertungen. Diese Bewertungen erlauben Rückschlüsse und weißen Implikationen für die Gestaltung automatisierter Fahrstile auf.
Zudem wurde der Einfluss verschiedener Persönlichkeitsaspekte in Studie 3 untersucht. Diese scheinen die allgemeine Präferenz für komfortable Manöverausprägungen nicht zu beeinflussen. Bestimmte Persönlichkeitsmerkmale scheinen jedoch dazu zu führen, dass diese Präferenzen nicht so stark ausgeprägt sind.
Zusammengefasst ist komfortables automatisiertes Fahren, wie es in dieser Arbeit untersucht wurde, durch Manöver charakterisiert, die ausreichenden Längsabstand sowie harmonische Manöververläufe mit kleinen Beschleunigungs- und Ruckwerten aufweisen. Diese Manöver bieten jedoch trotzdem noch ausreichend Rückmeldung über die Bewegung. Der umgebende Verkehr scheint aufgrund von entstehender Dringlichkeit eine wichtige Rolle zu spielen und sollte bei der Implementierung beachtet werden. Persönlichkeitsunterschiede scheinen keine Schlüsselrolle zu spielen.
Acknowledgements
Many people have supported me in one way or another during my work on this dissertation. I would like to take this opportunity to show my gratitude.
First, I would like to thank my supervisor Prof. Dr. Josef F. Krems for all the valuable advice and support. I would also like to thank Dr. habil. Michael Schrauf and Eberhard Kaus for their guidance and feedback throughout different phases of my work. In addition, I would like to show my gratitude to my second examiner of this thesis, PD Dr. Christhard Gelau, and the reviewers of my published work for their time and effort.
I am also immensely grateful to my colleagues Kathrin Zeeb, Katja Blömacher, Manuela Härtel, Malte Klüver, and Barbara Thiel, who have discussed various points and questions with me over and over again, sharing their experience and supporting me in uncountable ways. You were great sparing partners for discussions on theoretical models, study design, and methodological issues, amazing co-authors, and the best colleagues to share an office with. A warm thank you also to Vivan Govender who has helped me tremendously as a friend and a native speaker in both English and matlab. I would also like to thank Frank Schuster for his support when matlab got the better of me. A freaky thank you also to Lisa and Matthias Graichen for all the support, discussions, and creative input. All of you, most importantly, thank you for getting me through the motivational ups and downs of the last years.
Additionally, I would like to show my gratitude for all the colleagues managing and taking care
of ‘the technical side of things’: Jürgen Luther (also for the insights in to the corporate jungle and how
to still have your fun), Stephanie Preuß (also for enhancing the quality of simulator studies and the support in defending work on driving comfort), and Thorben Schönenberg.
A warm thank you also goes out to Matthias Beggiato, Tibor Petzoldt, Franziska Hartwich, and the whole research group at TU Chemnitz for the helpful discussions. And to Sebastian Hergeth for sharing his experience and reviewing my draft.
Of course, the studies and interview I have conducted would not have been possible without the many participants, who volunteered their time and effort. I owe them my sincere gratitude.
And finally, I would like to thank the rest of my friends and my family for their support, their believing in me, nagging me about finishing my thesis, and knowing when not to. Thank you Sören for always being there, encouraging me to get some work done when my motivation was low, but also making sure my life-balance was never too unbalanced. Thank you!
i
Table of Contents
Index of Abbreviations ... iv
Index of Tables ... v
Index of Figures ... vi
1 Introduction and background ... 1
1.1 Automating vehicles and traffic ... 2
1.2 Experts’ perspective on comfortable automated driving style ... 4
1.3 Driving comfort ... 6
1.4 Physiological basics of motion perception ... 9
1.4.1 Visual perception of motion ... 10
1.4.2 Vestibular perception of motion ... 11
1.4.3 Further sensory channels relevant for motion perception ... 12
1.5 Personality and driving ... 13
1.5.1 Sensation seeking ... 14
1.5.2 Trust in automated systems ... 14
1.5.3 Locus of control ... 17
1.6 Driving style ... 18
1.6.1 Definition of driving style ... 19
1.6.2 Assessing driving style ... 20
1.6.3 Driving style in context of driving automation and comfort ... 22
1.6.4 Summary of driving style ... 23
1.7 Research objective ... 23
2 Study 1: Objective metrics of comfort ... 25
2.1 Introduction ... 25
2.2 Part 1: Study I on rural and urban roads ... 29
2.2.1 Material and method... 30
2.2.2 Results ... 31
ii
2.3 Part 2: Study II on highway ... 34
2.3.1 Material and method... 36
2.3.2 Results ... 37
2.3.3 Discussion ... 40
2.4 Conclusion of Study 1 ... 42
2.5 Results in context ... 43
3 Study 2: Can we study autonomous driving in moving-base driving simulators? ... 44
3.1 Introduction ... 44
3.2 Method ... 47
3.2.1 Participants ... 47
3.2.2 Design ... 48
3.2.3 Apparatus and stimuli ... 49
3.2.4 Procedure ... 54 3.3 Results ... 54 3.4 Discussion ... 59 3.4.1 Potential limitations ... 61 3.4.2 Conclusion ... 62 3.5 Additional analysis ... 63
3.6 Summary of insights from Study 2 ... 65
4 Study 3: Preferences in automated driving and their dependence on personality traits . 67 4.1 Introduction ... 67
4.2 Method ... 70
4.2.1 Participants ... 70
4.2.2 Simulator ... 71
4.2.3 Maneuvers ... 72
4.2.4 Design and procedure ... 74
4.2.5 Questionnaires ... 75
iii
4.3.1 Data analysis method ... 77
4.3.2 Data analysis results ... 77
4.4 Discussion ... 80
4.4.1 Limitations ... 82
4.4.2 Conclusion ... 83
4.5 Additional analysis ... 83
4.6 Summary of insights from Study 3 ... 85
5 Summary & conclusion ... 86
5.1 Summary of results ... 86 5.2 Implications ... 89 5.2.1 Scientific implications ... 89 5.2.2 Practical implications ... 90 5.3 Limitations ... 90 5.4 Conclusion ... 92 References ... 93 Appendix ... 108 Appendix A – Interview ... 108
Appendix B – Post hoc tests simulator and testing ground ... 111
iv
Index of Abbreviations
BTL model Bradley Terry Luce model (Bradley & Terry, 1952; Luce, 2012) DBI Driving Behaviour Inventory
DBQ Driving Behaviour Questionnaire DSQ Driving Style Questionnaire FMS Fast Motion Sickness Scale
NHTSA National Highway Traffic Safety Administration JND Just Noticeable Difference
LOC Locus of Control
MDSI Multidimensional Driving Style Inventory SAE Society of Automotive Engineers
SSS Sensation Seeking Scale TAS Thrill and Adventure Seeking TTMD Time To Minimum Distance
v
Index of Tables
Table 1 Overview of automation levels per SAE International’s J3016 (2014). ... 3
Table 2 24 Table 3 Metrics able to distinguish between driving styles per maneuver on rural and urban roads. 32 Table 4 Metrics able to distinguish between driving styles per maneuver on a highway. ... 38
Table 5 Demographic data per setting of groups and ANOVA or Pearson’s chi2 results comparing the groups. ... 48
Table 6 Results from the repeated-measures ANOVAs concerning comfort rating. ... 55
Table 7 Analysis of rating variance for the different scenarios of Study 2. ... 63
Table 8 Mean comfort ratings of different maneuver scenarios per environment in Study 2 on a scale from 1 to 7. ... 65
Table 9 Values of internal consistency for the respective questionnaires. ... 79
Table 10 Main effects of the 25 and 75 percentile comparisons or male and female comparison. .... 80
Table 11 Post hoc test for the lane change maneuver in the test track environment. ... 111
Table 12 Post hoc test for the deceleration maneuver in the test track environment. ... 111
Table 13 Post hoc test for the lane change maneuver in the lateral simulator environment. ... 111
Table 14 Post hoc test for the deceleration maneuver in the lateral simulator environment. ... 112
Table 15 Post hoc test for the lane change maneuver in the longitudinal simulator environment. . 112 Table 16 Post hoc test for the deceleration maneuver in the longitudinal simulator environment. 112
vi
Index of Figures
Figure 1. Model of factors influencing trust in automation by Hoff and Bashir (2015). ... 15
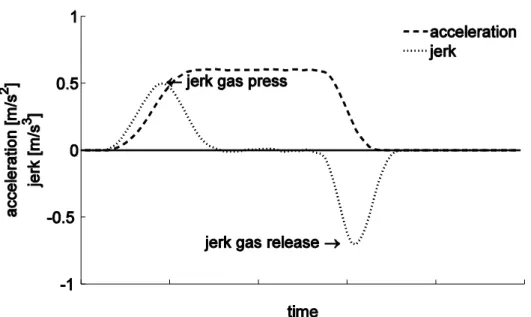
Figure 2. Exemplary acceleration. The development of acceleration and jerk are depicted over the course of a maneuver. ... 28
Figure 3. Illustration of quickness. A lane change to the left is shown with high quickness (top) and low quickness (bottom). ... 29
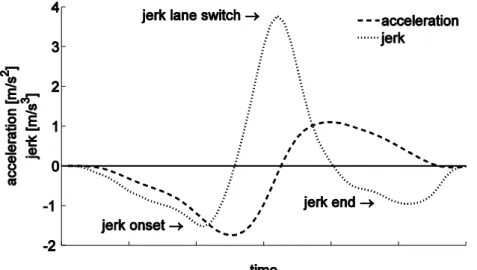
Figure 4. Exemplary lane change to the left characterized by lateral acceleration and lateral jerk. The different maxima in jerk are marked using arrows. ... 36
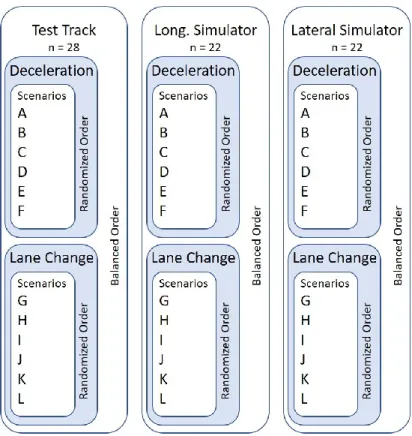
Figure 5. Illustration of the study design. The between-factor Environment encompasses two within maneuvers with six within scenarios each per environment. ... 50
Figure 6. Illustration of the advanced moving-base simulator at the Daimler AG. ... 51
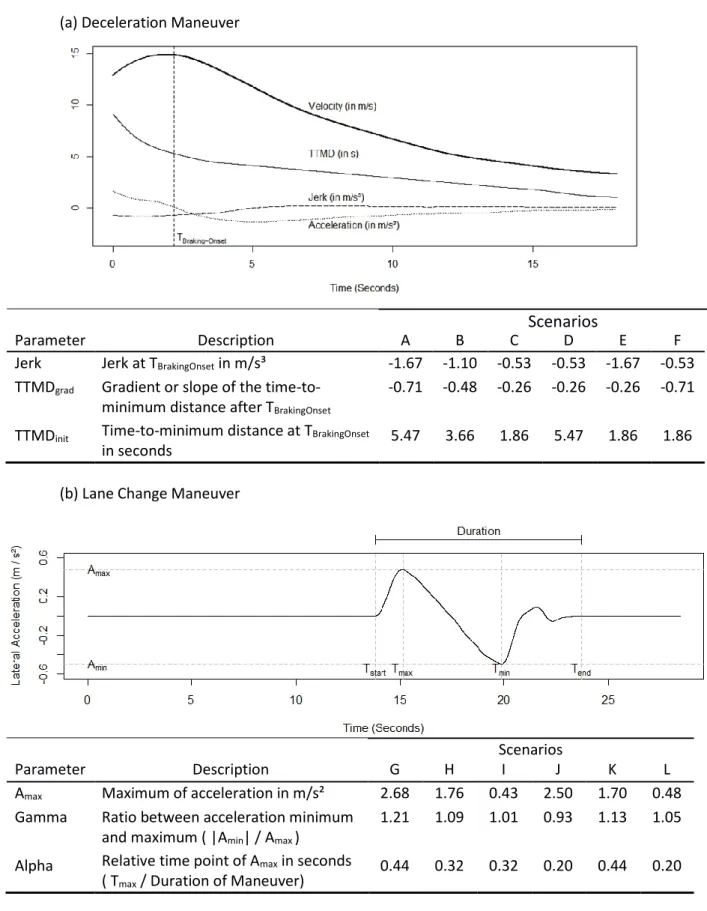
Figure 7. Illustration of the parameters for both the lane change maneuver and the deceleration maneuver for comfortable driving. ... 53
Figure 8. Illustration of the comfort ratings. Squared comfort ratings were averaged across environments and scenarios, and subsequently transformed back to their original scaling. Error bars indicate 95% confidence intervals. ... 56
Figure 9. Results of the multilevel analyses of the deceleration maneuver. In the left column, standardized regression coefficients are illustrated in a coefficient plot. ... 57
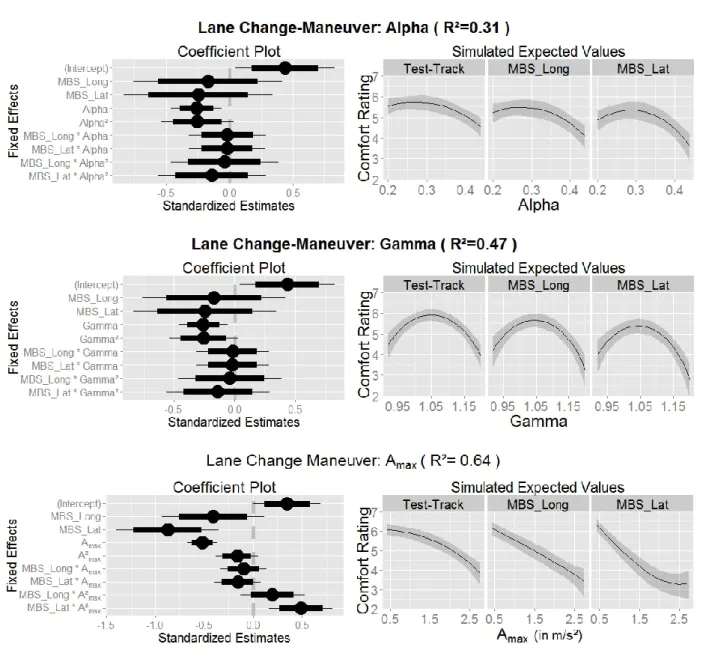
Figure 10. Results of the multilevel analyses of the lane change maneuver. In the left column, standardized regression coefficients are illustrated in a coefficient plot. ... 58
Figure 11. Illustration of the moving-base simulator. ... 71
Figure 12. An exemplary lane change to the left is illustrated... 72
Figure 13. The trajectories of the three lane changes are illustrated. ... 73
Figure 14. Three exemplary accelerations are illustrated. ... 74
Figure 15. Three decelerations behind a vehicle are illustrated. ... 75
Figure 16. Illustration of the study procedure. ... 76
Figure 17. The utility scale values for each variation are depicted per maneuver along with their respective 95 % confidence intervals. ... 78
1
1
Introduction and background
Automated driving is currently one of the most important and popular automobile topics. Vehicle automation is changing the way we drive and experience driving. It is predicted to have a beneficial impact on many aspects of driving, such as traffic flow, comfort, allocation of time resources, and – very importantly – safety. As safety has a special relevance, many studies in the field of automated driving to date have focused on safety aspects, e.g. takeover quality or time (e.g. Radlmayr, Gold, Lorenz, Farid, & Bengler, 2014; Zeeb, Buchner, & Schrauf, 2015). These studies supply valuable insights for automation levels, in which the human driver is still needed as a fallback.
Little focus has so far been placed on the aspect of comfort in automated vehicles (see Hartwich, 2017). This, however, seems crucial to investigate. Uncomfortable solutions, much like untrusted ones, will have a detrimental influence on system usage (Jamson, 2006; Lee & Moray, 1992; Lee & See, 2004; Muir, 1994; Siebert, Oehl, Höger, & Pfister, 2013). If automated systems are not engaged, the predicted benefits cannot emerge. To ensure drivers experience a comfortable ride in automated systems, this thesis focusses on identifying and describing comfortable automated driving.
To address comfortable automated driving, three studies were conducted. The first study focuses on identifying comfort related driving metrics and their characteristics derived from manual driving. The second study focuses on transferring these insights into automated vehicles and on method validation. The final study incorporates all findings and evaluates different approaches to design comfortable automated driving.
Before these central studies of this thesis are presented, an introduction into important underlying concepts will be given. First, an overview over vehicle automation is given in Chapter 1.1. Hereby and in the thesis in general, the focus lies on passenger cars. An interview follows in Chapter 1.2, which was conducted with an expert group that has experience in on-road higher level automated driving. Following the interview, it is necessary to define comfort and give an overview over relevant literature. As another fundamental factor, the basics of motion perception will be discussed subsequently in Chapter 1.4. The interpersonal perspective will then be taken into account by reviewing the influence of personality on driving in Chapter 1.5. This leads to the distinction multiple driving styles, which are described in Chapter 1.6. The following part of this thesis begins with the research objective of this thesis in Chapter 1.7, which leads to the conducted studies in Chapters 2 through 4. Finally, an overall discussion and conclusion are given in Chapter 5.
2
1.1
Automating vehicles and traffic
The term automation refers to “technology that actively selects data, transforms information,
makes decisions, or controls processes” (Lee & See, 2004, p. 50). Manufacturers, politicians, as well as the general public hope to reduce traffic accidents and fatal injuries, environmental pollution, load of infrastructure in metropolitan areas, and traffic congestion by automating traffic. Above that, automated traffic is expected to increase traffic efficiency, safety, and comfort. Automated driving may also have side effects on drivers, society, and our understanding of driving experience. As Bainbridge (1983), Parasuraman, Sheridan, and Wickens (2000), as well as Walker, Stanton, and Young (2001)
point out, automation does not necessarily reduce drivers’ workload, but changes the task the driver has to perform.
Automation of traffic further gives rise to a plethora of questions (see e.g., Gasser, 2013). These concern legal issues, such as liability, societal questions, such as the need for special driver’s
education, ethical issues, or human-machine-interaction issues. The latter are comprised of questions regarding trust, situation awareness, mental models, take-over readiness, and also of joy of driving and comfort. So far, most research has been conducted concerning take-over behavior, situation awareness, and mental models (see e.g., Beggiato & Krems, 2013; Endsley, 1996; Merat, Jamson, Lai, & Carsten, 2012; Radlmayr et al., 2014; Zeeb et al., 2015).
Across different fields of research and addressed questions, a common framework to classify automation levels is essential. Various frameworks of levels of automation have been described. For one, Parasuraman et al. (2000) outline a 10-level scale that classifies automation based on how much control and information the driver retains. Their scale ranges from humans having full control and the automation offering no assistance (level 1) to the automation deciding and acting on its own while disregarding the human operator (level 10). While this classification can be broadly applied to all kinds of human computer interaction, different organizations have defined taxonomies specifically for the driving context. Most commonly cited are SAE International (SAE International, 2014), NHTSA (National Highway Traffic Safety Administration, 2013) and Bundesanstalt für Straßenwesen (Gasser et al., 2012; Gasser, 2013). With publishing the Federal Automated Vehicles Policy (National Highway Traffic Safety Administration, 2016) the NHTSA has adopted SAE’s taxonomy making the SAE taxonomy the leading taxonomy. The SAE taxonomy offers not only a detailed description of each level, but also describes respective automated systems and provides definitions of related terms. An overview of SAE’s
3 Table 1
Overview of automation levels per SAE International’s J3016 (2014).
Level 0 1 2 3 4 5 No automation Driver assistance Partial automation Conditional automation High automation Full automation Monitoring Driver monitors the driving environment Automated driving system monitors the
driving environment Execution steering and acceleration Human driver Human driver and automated system Automated system Automated system Automated system Automated system Fallback Human driver Human driver Human driver Human driver Automated system Automated system Driving
modes - Some Some Some Some All
In general, there is a responsibility shift in all taxonomies between levels two and three. Whereas the driver must monitor the systems’ actions continuously in level two, this is not necessary in levels three and upwards. This thesis aims at improving driving comfort for automated driving systems on SAE automation levels 3 and higher.
The studies reported in this thesis were conducted on different automation levels depending on their objective. Study 1 was conducted as a manual driving study at level 0. Study 2 was conducted on level 3, whereas Study 3 was conducted on level 4. As it was always clear in the last two studies that the automation performs all aspects of driving including e.g., lane changes, it was not possible for participants to distinguish from experience whether the system operated on levels three, four, or five, because participants experienced neither a take-over situation nor limits of system capability. To date only few people have experienced automated driving on SAE levels three and higher in on-road traffic. In order to gain access to this valuable information and wealth of experience before conducting studies, an interview was conducted with seven of these experts in the following chapter.
4
1.2
Experts’ perspective on comfortable automated dri
ving style
In the summer of 2013 a team of researchers from Daimler AG succeeded in enabling an automated vehicle to drive the Bertha Benz Memorial Route from Mannheim to Pforzheim in Germany by itself (Ziegler et al., 2014). These researchers have gained valuable insights on how it feels to be a passenger in an automated vehicle in real traffic. To get a first impression of when automated driving is experienced as comfortable and what influences experiencing a comfortable automated driving style, an interview was conducted as a part of this thesis in 2013 with seven of the experts. The goal of this interview was to obtain first-hand information on how automated driving is experienced and where crucial points regarding experiencing comfort may lie. The interviews were recorded and transcribed. The answers were then grouped and analyzed in a descriptive manner per topic or question.
In detail, participants were asked to describe different driving styles they had experienced in manual or automated driving and what characterizes these. Participants were then asked to state which driving style they prefer for automated driving and which aspects play the most important role. The interview consisted of written demographic questions and 13 predefined verbal questions (see Appendix A – Interview for the translated English version and the German original questions).
To correctly interpret the answers, it is important to bear in mind the characteristics of the sample. All participants both developed automated driving and had gained practical experience with automated driving. The minimum practical experience with SAE level three driving was approx. 25 km, whereas the maximum was between 3,000 and 4,000 km. On a 7-point scale on affinity towards technology six out of seven participants marked the highest possible affinity towards technology. These values may possibly also indicate exalted trust in technology in contrast to the general public. Furthermore, the interviewees were all developers of the system they were interviewed on. They had an accurate mental model and knew about the system’s strengths and weaknesses. All interviewees were men between the age of 30 and 42 years of age. Their manual driving experience ranged between 8 and 30 hours per week (M = 12.93 hrs., SD = 7.73 hrs.), whereas they held their drivers license for an average of 19 years (SD = 4.51 yrs.).
When asked about driving styles in general, participants mentioned four in total: ambitious, dynamic, jerky-restless, and comfortable. Ambitious driving style was mentioned only once and was described as similar to a sporty or dynamic driving style but without breaking speed limits and with as
5
little lateral acceleration as possible. Both the ambitious and the dynamic driving style share cutting corners and using the whole width of the street, i.e. following the racing line. Dynamic driving was additionally characterized by not necessarily adhering to speed limits, increased lateral acceleration in curves, and by high fuel consumption. Both driving styles were mentioned either in describing
participants’ own driving style or by describing the driving style of other human drivers. The jerky -restless driving style was characterized as not being anticipatory, resulting in frequent switches between acceleration and brake pedal, driving with too little headway, jerky steering, being too fast in curves, steering too late upon entering a curve, driving too far to the right or left of the lane or swerving in the lane, irrational behavior, and reminding participants of a student driver having his/her first lesson. All participants expressed that this student driver driving style would be the worst-case driving style for automated vehicles. Likewise, all participants agreed on a comfortable driving style being the preferred style for automated vehicles. Comfortable driving was characterized by anticipatory and consistent driving, more headway distance, more distance to a vehicle which is being overtaken before cutting back in, less overtaking in general, little change in lateral or longitudinal acceleration, defensive and smooth driving, which is allowed to take more time.
Acceleration behavior was mentioned as being a very important factor in automated driving by all participants. A jerk-free, consistent way of driving was asked for. Other important aspects were anticipatory driving, foreseeable driving behavior, headway distance, velocity in relation to the speed limit and to others while overtaking, as well as feedback.
On a different notion, the experts were asked whether they experienced being driven by another driver or an automated vehicle differently. This was done to get an impression of how easily results of existing research on passengers in manually driven cars can be transferred to automated vehicles.
All interviewees stated that driving as a passive driver in an automated vehicle feels somehow
different than being a passenger in another human drivers’ car. For one it was said that, the fact alone of sitting in the driver’s seat, leads to a feeling of being responsible and perceiving a loss of control in an automated car. Whereas, they feel less responsible as a passenger to a human driver. All interviewees stated that they draw information about whether the driver is in control of the situation and vehicle by observing his/her behavior. Most participants stated that it is easier to presume what a human driver can handle, because oneself can be used as reference. System limits and detection quality of an automated system cannot be estimated as easily. This issue is also brought up in research on trust (see Chapter 1.5.2).
6
In summary, experts, who had experienced automated driving, preferred a comfortable driving style in automated vehicles. They wished for anticipatory and comprehensible behavior. This is in line
with Lee and See’s (2004) theory on trust, in which the predictability of a system is theorized to have a large effect on trust in automation. Concerning measurable driving style, small acceleration and jerk as well as adhering to the speed limit and keeping sufficient headway distance were wished for. Most participants accepted arriving later at their destination if aforementioned criteria are met.
The results of this interview, alongside insights found in literature and described in the next section, are used as a starting point and a reference for the investigations conducted throughout this thesis.
1.3
Driving comfort
Comfort is an essential aspect of the driving experience and is one of the major goals in automated driving. This is apparent not only in the interview described in Chapter 1.2, but also in studies. For example, Tischler (2013) asked 491 participants in which situations they enjoyed driving the most. In total, 83 % of the participants mentioned situations with high driving comfort. As experienced comfort influences trust in and acceptance of an automated system (Siebert et al., 2013) and both trust and acceptance are a vital component for the usage of automation and purchasing decisions (Engeln & Vratil, 2008; Lee & Moray, 1992; Lee & See, 2004; Muir, 1987; Parasuraman & Riley, 1997), it is advisable to ensure comfort or the developed automated system will not be used and fails to deliver the intended benefits (Jamson, 2006; Regan, Stevens, & Horberry, 2014). In addition, Hartung, Mergl, and Bubb (2005) argue that vehicles are increasingly distinguished by the comfort they provide.
Although – or maybe because – comfort is such an everyday term no sufficing definition can be found. The existing models and definitions of comfort as a general concept tend to contradict each other. For example, whereas some see comfort on one end of a spectrum and discomfort on the other (e.g., Vergara & Page, 2000), Zhang, Helander, and Drury (1996) define comfort and discomfort as relatively independent constructs which can occur simultaneously. They see discomfort as something evoked by biomechanical circumstances, whereas comfort is associated with well-being and relaxation. For Zhang et al. (1996) the presence of discomfort does not necessarily rule out comfort and the absence of discomfort does not necessarily imply comfort.
7
The International Organization for Standardization (1997, p.9) defines comfort in ISO 5805 as
a “complex subjective entity depending upon the effective summation of all the physical factors
present in the induced environment, as well as upon individual sensitivity to those factors and their summation, and such psychological factors as expectation.” This ISO norm points out that the perception of comfort is influenced both externally, e.g. physical influences from the environment, and also internally, e.g. sensitivity and psychological factors. The summation of these factors ultimately result in experiencing comfort, thus making the experience subjective and individual. Slater (1985)
defines comfort as “a pleasant state of physiological, psychological, and physical harmony between a
human being and the environment.” (p. 4). This definition also incorporates both internal and external factors. Especially when taking loss of control into account, which may be experienced in higher automated driving, the psychological aspect of experiencing comfort seems to gain influence (see also Elbanhawi, Simic, & Jazar, 2015). For Summala (2007) the concept of comfort is closely linked to the feeling of control and safety. He sees comfort as a pleasant mood or emotion without strong activation or arousal. In his Multiple Comfort Zone Model, Summala (2005, 2007) proposes that four driving-related factors influence feeling comfortable: safety margins, the vehicle-road system, rule following, and travel progress and expectation. The first factor, safety margins, describes both sufficient time and space margins to the surroundings. This factor shows a link to driving style. The factor vehicle-road system is mainly concerned with vibrations, thermal, and visual issues, e.g., glare. For the factor rule following, Summala (2007) assumes, e.g., not being concerned with being fined to be influential on experienced comfort. The last factor, travel progress as expected, is assumed to cause discomfort when, e.g., the driver has to drive slower than he/she had expected due to traffic congestion. Progressing faster or as expected, contributes to experiencing comfort. Summala (2007) assumes that if the factors are held within a certain range or above a certain threshold, a comfortable state is maintained and no corrective longitudinal or lateral control actions will be undertaken by the driver.
Ellinghaus and Schlag (2001) provide work in a field closely related to comfort in automated vehicles: passenger comfort. They see passenger comfort as a result of a variety of influences. Among these are ergonomic influences, vibrations, how safe the vehicle is perceived, but also trust in the driver and the congruency with expected movements. Expectations also play a crucial role in Krist’s
(1994) model of comfort. She hypothesizes that experienced comfort or discomfort is the result of a constant comparison between expectancies and reality. Further, she assumes that only the discrepancies and the unresolved issues reach conscious perception. As, according to Krist (1994) existing discrepancies imply discomfort, comfort exists only without discrepancies between
8
expectation and reality, which do not reach conscious perception. This may be the reason why participants seem to find it easier to state their degree of discomfort than their degree of comfort. Hence, studies such as by Hartwich, Beggiato, Dettmann, and Krems (2015) have focused on assessing discomfort instead of comfort.
Throughout the different definitions of comfort, three aspects are commonly shared (de Looze, Kuijt-Evers, & van Dieën, 2003). Firstly, comfort is always subjectively perceived and may vary between people under the same circumstances. Secondly, comfort can be affected by various kinds of influence, i.e., internal and external influences. Thirdly, experiencing comfort is always a reaction.
In literature, the most common terms used to describe experiencing comfort during driving are ride comfort and driving comfort. Ride comfort is a term usually used from an engineering point of view, e.g. work on chassis. Although Heißing and Ersoy (2011, p. 421) broadly define ride comfort as
“the overall comfort and well-being of the vehicle’s occupants during vehicle travel”, ride comfort is usually seen as not only dependent on acceleration, jerk (i.e. the derivative of acceleration), or headway distance, but also on road surface conditions, the suspension system, the precision and
promptness of the vehicle response to a driver’s commands, and side slip angle (Fenton & Chu, 1977; Hernandez & Kuo, 2003; Mitschke & Wallentowitz, 2004; Wu, Liu, & Pan, 2009).
In contrast, the term driving comfort is used inconsistently. It can include aesthetic components such as interior design or directly perceivable characteristics from a passenger’s point of
view, such as accelerations, jerks, headway distance, and interior noise levels (Probst, Krafczyk, Büchele, & Brandt, 1982; Summala, 2007; Wei & Rizzoni, 2004).
In this thesis, the term more common in human factors research, automated ‘driving comfort’
will be used. The influence of various factors, such as vibrations or aesthetic elements is acknowledged. Focus, however, will lie on factors which can be directly controlled and manipulated through driving style.
Another related concept is driving pleasure. Driving pleasure is a pleasure deriving from the interaction between driver and vehicle during the active piloting of the vehicle (Tischler, 2013). As this thesis focusses on automated driving, many important factors for driving pleasure, such as e.g. delay
between pressing the acceleration pedal and the vehicle’s response, cease to be applicable.
Engeln and Vratil (2008) further make a clear distinction between comfort and pleasure in general. They define comfort as the avoidance of uncomfortable actions or stimuli. They assume comfort and the number or intensity of negative stimuli to have a linear relationship. The less negative
9
stimuli, the more comfort is experienced. In contrast, they see pleasure as intrinsic motivated actions and perception of stimuli. This relationship is described similar to the relationship of arousal and performance described by the Yerkes-Dodson law (Yerkes & Dodson, 1908). An individual ideal level has to be found. Engeln and Vratil (2008) differentiate between comfort and pleasure in that way that pleasure can only be perceived when actively engaging in an action. Comfort, on the other hand, can also be experienced without active engagement.
One of the main problems of comfort in research, apart from the lack of a commonly shared definition, is the methodological issue of measuring experienced comfort. There have been attempts at measuring comfort via physiological measures (Engeln & Vratil, 2008; Uenishi, Tanaka, Yoshida, Tsutsumi, & Miyamoto, 2002) or indirectly by measuring discomfort (Seidl, 2000; Hartwich et al., 2015). Most research, however, relies on questionnaire data and verbal feedback. Even so, no acknowledged, standardized questionnaire exists. An adequate and satisfactory objective and/or subjective instrument has yet to be found. According to Engeln and Vratil (2008) a residual variance remains even when using objective measures.
In sum, even though contradicting models of comfort and the role of discomfort exist, comfort seems to be an individual experience evoked and influenced through both internal and external factors. In the specific case of automated vehicles, driving comfort can be understood as not only the absence of uneasiness and anxiety, which might arise from both internal and external factors, e.g. loss of control in automated driving, but also as a feeling of well-being and an attribution of positive valence towards how a maneuver is driven by the automated vehicle (see Bellem, Thiel, Schrauf, & Krems, 2018). For the purpose of this thesis an implementable understanding of experiencing comfort via driving style has to be found. Thus, this thesis tries to find a suitable approximation of human experience of comfort in highly and fully automated vehicles.
1.4
Physiological basics of motion perception
As pointed out by numerous definitions of comfort (e.g., Slater, 1985) physiology plays an essential role in experiencing comfort. In order to analyze comfortable driving, the physiological basics of perception leading to a comfortable experience must be considered.
Decker (2008) presents an overview over human perception and driving metrics. He matches the vestibular, visual, auditory, sensorimotor, and haptic sensory channels to different driving metrics,
10
such as orientation and position in the environment, velocity, acceleration, or steering wheel angle. In some cases, more than one sensory channel can perceive a certain metric, e.g. both the vestibular and the sensorimotor channel can perceive acceleration. In other cases, more than one sensory channel is necessary to correctly interpret input. This can be the case when walking forwards, while one’s head
is turned to the side. Visual and vestibular information suggest a sideways movement as the sensory organs are located in the turned head. Only when taking additional, i.e. sensorimotor, cues into account, is it possible to correctly interpret the direction of the body (Zenner, 2010).
Even though perception is triggered by objective and measurable cues, it cannot be quantified in a general manner. For one, human perception varies interpersonally and intrapersonally –
depending e.g. on sleepiness or distraction – and may change due to adaption (Zenner, 2010). Further, the increase of different stimuli may lead to differences in perceiving said increases (Stevens, 1962).
In driving, the visual channel is reported to be the most important sensory channel (MacAdam, 2003; Reymond, Kemeny, Droulez, & Berthoz, 2001; Vollrath & Krems, 2010). Vestibular perception is ranked as the second most important input (see MacAdam, 2003), but is expected to increase in importance in highly and fully automated driving as visual focus and attention may be averted from the driving relevant areas of interest. Both visual and vestibular perception will be described with special relevance to automated driving in the following section. The perception of other less dominant cues, such as haptic cues, e.g. the perception of pressure resulting from being pressed into a seat upon acceleration, will be mentioned but play a minor role in this thesis.
1.4.1 Visual perception of motion
Three main types of motion can be perceived visually (Goldstein, 2008). The first type is seeing an object moving through a stationary background without moving one’s eyes. The second type is
following a moving object through a stationary background by focusing on the object. The third type is moving though the stationary environment. Naturally, a combination is also possible, e.g. watching a moving object while oneself is moving.
Goldstein (2008) describes two explanations for the visual perception of motion: the physiological approach – the reafference principle – and the behavioral approach of the optical array. The reafference principle was first described by von Holst and Mittelstaedt (1950). It assumes that three kinds of signals are necessary to perceive motion. These are a motoric signal, which is sent to
11
the muscles moving the eye balls, a so called efferent copy, which is a copy of the motoric signal, and an afferent signal, which is given when a retinal image moves and stimulates the receptors. If either the efferent copy or the afferent signal is stronger than the other, motion is perceived.
The optical array is based on Gibson’s work on the perception of motion. According to him, humans and many animals can not only see light, but also patterns and changes of pattern (Gibson, 1958, 1968; Goldstein, 2008; Lee, 1980). These patterns make up the optical array. Movement is detected by changes in the optical array. Here, a distinction is made between ego movement – or locomotion – and the movement of objects in the visual array. An object moving through the static environment changes the perspectives of the array’s texture. The object is registered as covering and uncovering parts of the static background. In locomotion, the whole optic array moves in a flow pattern, whereas the point towards which the movement is directed – the focus of expansion –
remains motionless. A contracting optical flow signalizes backward motion, whereas an expanding optical flow signalizes forward motion. The extent of the optical flow, i.e. how fast the objects move, allows an identification of how far away they are. This explains why objects closer to the observer seem to be moving much faster than objects close to the horizon when looking out of the window of a fast car or train. The speed of optical flow also allows the observer to approximate his or her own speed.
In addition, the optic flow field can also be used to not only perceive the distance to an object, but also to determine a time to collision (Lee, 1976).
In automated driving, not only the movement of the environment relative to the driver is an important factor. Further, visual motion cues can also be obtained from steering wheel motions. The movement of the steering wheel according to automated movements can support initial trust building but may be rendered unnecessary after sufficient trust has been built. Thus, moving the steering wheel during automated driving may be a trust related factor and may indirectly influence experienced comfort.
1.4.2 Vestibular perception of motion
Situations exist in which visual perception alone is insufficient. In highly and fully automated driving, it can further be hypothesized that visual attention will not be directed at driving related tasks. In these cases, vestibular perception of motion is important to perceive motion and subsequently experience comfort. Even on its own, the vestibular sensory channel has been shown to be critical for driving (see Reymond et al., 2001).
12
Responsible for sensing vestibular motion cues is the vestibular organ located in the inner ear (Zenner, 2010). The vestibular organ in each ear consists of two otolith organs or maculae and three semicircular canals. The different specialized capacities of maculae and semicircular canals reflect in the difference in their anatomical structure. The maculae are specialized in translatory motion detection. This corresponds to the perception of longitudinal or lateral acceleration. The semicircular canals, on the other hand, are specialized in angular acceleration. This corresponds to perceiving the yaw, roll, and pitch of a vehicle while driving. The three semicircular canals are arranged thus one canal is aligned with one direction or dimension. A specific activation pattern results for each combination of angular acceleration.
Kingma (2005) analyzed thresholds for perceiving motion through the vestibular system by accelerating participants on a sled in either longitudinal or lateral direction. Visual, auditory, and proprioceptive cues were eliminated or masked by darkness, headphones and a constantly vibrating seat. The threshold for longitudinal acceleration was found to be at 0.085 m/s2. The corresponding
threshold in lateral direction was found at 0.065 m/s2. The longitudinal velocity threshold lies at
0.135 m/s and the lateral velocity threshold at 0.104 m/s. Müller, Hajek, Radic-Weissenfeld, and Bengler (2013) identified average just notable differences (JNDs) at 0.09 m/s2 for acceleration and
0.53 m/s3 for jerk. Gianna, Heimbrand, and Gresty (1996) found thresholds depending on the gradient
of acceleration. In stepwise acceleration with a correct response rate of 67 % the threshold lay at 0.48 m/s2. When using ramps of 0.028 m/s3 and 0.079 m/s3 respectively, thresholds are found at
0.12 m/s2 and 0.19 m/s2. When using a parabolic increase of .0152 m/s4 the threshold lies at
0.167 m/s2. This implicates that not only the acceleration itself but also the way it changes is relevant
to the perception of motion (see also Soyka, Robuffo Giordano, Beykirch, & Bülthoff, 2011). The JNDs as well as insights into the course of acceleration changes will be taken into account in the design of maneuvers throughout this thesis.
In general, a smooth integration of visual and vestibular cues seems to be important because a visual-vestibular conflict can lead to uneasiness and motion sickness (Lackner, 2009; Reason, 1978; Sivak & Schoettle, 2015).
1.4.3 Further sensory channels relevant for motion perception
As mentioned above, motion can also be perceived through proprioceptors or haptic cues. Proprioceptors are receptors within muscles and joints, which allow the brain to interpret information
13
from the vestibular system in context (Zenner, 2010). Haptic cues are, e.g., the pressure when being pressed into the seat upon strong accelerations. Another possible motion cue is the movement of hair or feeling air flow on skin. These factors, as aforementioned pressure, usually imply strong forces, such as strong acceleration. Because this thesis focusses on comfort, such factors will not be analyzed further.
The auditory channel does not allow the direct perception of motion, but noise or sound are also known to influence driving experience (Huang, Griffin, & Morioka, 2009; Wu et al., 2009). Increased sound levels have a detrimental influence on comfort (Engelbrecht, 2013; Wu et al., 2009). Sound or noise can be elicited from the engine or from the movement itself. However, loud noises are, again, only expected in a dynamic driving style and will not be regarded in this thesis
In sum, vestibular and visual motion perception are central to experiencing comfortable automated driving. Both will receive special attention in the design and implementation of trajectories throughout this thesis.
1.5
Personality and driving
After an introduction into the biological basis of perceiving comfort related influences on the human body, this chapter will focus on the influences of personality on driving and preference for certain driving behavior.
Iversen (2004) shows in her study how drivers’ attitudes are a relatively good predictor of their driving behavior and that both attitudes and behavior are comparatively stable over time. Likewise Lajunen, Corry, Summala, and Hartley (1998) state in their definition of driving style, that the way a person drives is also influenced by their personality. Multiple studies have been conducted to identify which facets of personality influence which aspects of driving. Out of these, this thesis will focus on the personality traits sensation seeking, trust in automated systems, and locus of control, because either their significance for automated driving has been acknowledged in literature (e.g., Lee & See, 2004; Muir, 1987; Rudin-Brown & Parker, 2004) or because of their influence on manual driving and thus potential to influence experiencing automated driving (e.g., Jonah, 1997; Rundmo & Iversen, 2004). In the following, it will be described how these traits influence manual driving and why they seem promising as an influence on experiencing comfortable automated driving.
14 1.5.1 Sensation seeking
Sensation seeking is “a trait defined by the seeking of varied, novel, complex, and intense
sensations and experiences, and the willingness to take physical, social, legal, and financial risks for the
sake of such experience.” (Zuckerman, 1994, p. 27). Zuckerman (1971) further divides the concept into four subscales: thrill and adventure seeking, experience seeking, disinhibition, and boredom susceptibility. A summary of 40 studies reveals a positive relationship between sensation seeking and risky driving (Jonah, 1997). In addition, Jonah (1997) points out, that the subscale Thrill and Adventure Seeking shows the strongest relationship to risky driving. Rimmö and Åberg (1999) found that sensation seeking is associated with traffic violations, but not so much with mistakes, inattention or errors. The authors suspect that the relationship between sensation seeking and accidents is mediated by violation frequencies. In addition to increased traffic violations, such as speeding and ignorance of traffic rules, a relationship between sensation seeking and risk perception and thus risky behavior was observed by Rundmo and Iversen (2004). This, in turn, is reported to lead to more damage and injuries (Rundmo & Iversen, 2004). All in all, sensation seeking seems to have an influence on human driving.
As highly and fully automated driving are novel and often thrilling for novices, sensation seeking – or specifically Thrill and Adventure Seeking – seem promising in this context. It is imaginable that persons with distinctly stronger thrill and adventure seeking may be more open to highly or fully automated driving and may thus accept a wider variety of behaviors as comfortable driving or may even expect a driving style with stronger accelerations.
1.5.2 Trust in automated systems
Multiple studies have identified trust as a key variable in the usage of automation (e.g., Hergeth, 2016; Hoff & Bashir, 2015; Lee & See, 2004; Muir, 1987; Pop, Shrewsbury, & Durso, 2015). Because trust is a common concept and widely spoken of in everyday life, multiple models and definitions of trust exist (for an overview see Lee & See, 2004). However, most definitions and models seem to have three points in common (Hoff & Bashir, 2015; Muir, 1987): Firstly, trust is given by a someone, who trusts, to a trustee. One has trust in something or someone. Secondly, trust is always directed at possible future events. It always corresponds to an expectation of something or a confidence in someone which is connected to a risk. Thirdly, trust may be bound to one or multiple characteristics of its object. One may, for example, trust in someone else’s judgement and honesty, but not in their loyalty. Hoff and Bashir (2015) combine the last two points and add that the trustee
15
must always have an incentive to perform. In case of automation this may be based on the intended functionality of the system.
Even though the definitions of trust mostly share the mentioned points, Muir (1987) criticizes their failure to incorporate the multidimensional nature of trust, which she sees suggested by the plethora of definitions. Barber (1987) tries to incorporate the multidimensionality in his definition of trust. For him the basis of trust is dependent on the existence of norms or standards. These can be, for example, of social, technical, or moral nature. Further, he assumes trust can mean two things, which are different in their character and yet can at the same time be intertwined: For one, trust is the expectation that a person or system will competently perform a task in question. Apart from this, trust concerns fiduciary obligations. Here the expectation lies in the assumption that the trusted person or
system will perform the task even when it is opposing his/her/its own interests, placing others’
interests before their own. In short, Barber (1987) sees two aspects of trust: competently performing a task and performing said task even if it may be opposing to the trustee’s interests.
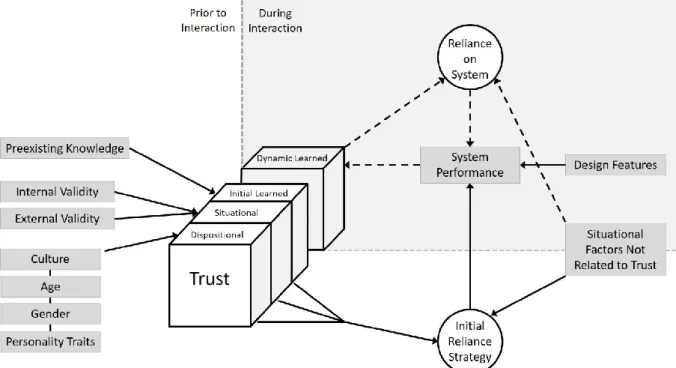
Figure 1. Model of factors influencing trust in automation by Hoff and Bashir (2015). Adapted from
“Trust in automation”, by K. Hoff and M. Bashir, 2015, Human Factors, 57(3), p. 427 with author’s
permission.
As the definitions vary, so do the theories of underlying factors. The most commonly named underlying factors are predictability, dependability or reliability, faith, competence, responsibility, familiarity, understandability, robustness, and feedback or explanation of intention (Muir & Moray, 1996; Parasuraman & Riley, 1997; Rempel, Holmes, & Zanna, 1985; Jian, Bisantz, & Drury, 2000;
16
Stanton & Young, 2000). Lee and Moray (1992) condensed these factors into three groups: performance, process, and purpose. Dependability, robustness, competence, and reliability describe a well performing system. Being able to understand underlying mechanisms and the intention of the system are grouped using the term process of automated systems. And finally, the purpose of automated systems describes the designer’s intended purpose or competence of the automated
system.
After a comprehensive review of literature on trust in automated systems, Hoff and Bashir (2015) propose a layered model of trust. According to this model depicted in Figure 1, trust consists of the layers dispositional, situational, and initial learned trust even before the first interaction with an automated system. The initially learned trust is determined by previously existing knowledge or experience with other systems. Situational trust varies depending on the internal variability of the operator or driver, e.g. expertise, mood, or attentional capacity, and the external variability, e.g. system complexity, task difficulty, or perceived risk. Finally, dispositional trust is said to be influenced by culture, age, gender, and other personality traits. During an interaction, a dynamically learned facet is added. This facet is influenced by the current system performance, which itself is influenced by various factors. Research on these factors has thus far not been conclusive. This model infers that trust can on one hand be influenced by the quality of the system and system interaction, but on the other hand unvarying aspects also persist. The distinction between preexisting and dynamically learned trust can be found in literature describing that trust can be built and adapted through interaction (Muir & Moray, 1996). According to Lee and See (2004) both cognition and emotion are essential for building trust, but emphasis lies on emotion or so called gut feeling. Once trust is built, it is not necessarily stable, but prone to changes depending on experiences (Hoff & Bashir, 2015; Lee & See, 2004). According to Lee and See (2004) not only the system failure as such influences trust in the system, but more importantly the system’s predictability.
All in all, trust is an important factor when it comes to the usage of automated systems. It may lead to a differing behavior in activating SAE level three+ automated systems and may further influence how easily comfort is experienced. Therefore, it is interesting to analyze whether varying levels of trust towards automation also influence experienced comfort in automated driving. A person with high trust in automated systems may be more open as to what he/she experiences as comfortable.
17 1.5.3 Locus of control
Locus of control (LOC) is the third personality trait which will be examined in this thesis. LOC describes whether a person perceives an event to be due to own preceding behavior or due to external influence. The former describes an internal locus of control, whereas the latter describes an external locus of control. The concept has first been described by Rotter (1966) in his theory on social learning. He describes LOC as an important puzzle piece in the description of personality. Further, he postulates that learning through reinforcement is influenced depending on whether people perceive the event to be a result of their own action or the result of external forces. According to Rotter (1966) people, who have an external locus of control are less likely to see a connection between their behavior and following events and are thus less likely to adapt their expectancies for future reinforcement than people with an internal locus of control.
Whereas initial research on locus of control has been conducted on social learning, the concept was later applied and adapted to specific topics such as driving. Research on the influence of LOC on manual driving has, however, been inconclusive. Some studies show relationships between LOC and driving related factors, such as accident involvement, seat belt use, or traffic violations (Hoyt, 1973; Montag & Comrey, 1987; Özkan & Lajunen, 2005). Others find inconclusive or no relationships (Arthur & Doverspike, 1992; Iversen & Rundmo, 2002).
Regardless of its unclear role in manual driving, LOC may play a decisive role in automated driving. Here, it is not of interest to group driving behavior due to internal or external LOC, but to assess whether being driven by an automated vehicle is perceived differently depending on LOC. A clear distinction is made, because control really is external. It is possible that persons with a more external LOC are used to not feeling in control and may be more at ease than people with internal LOC,
who may feel a strong loss of control and thus be more skeptical of an automated vehicle’s actions.
Rudin-Brown and Parker (2004) found participants scoring high on internal LOC retain more direct involvement in driving with an adaptive/active cruise control system. Thus, they were also quicker in overriding the system in system failure situations. Jenssen (2010) found that persons scoring high on external LOC are more likely to trust the functionality of in-vehicle devices. This may perhaps also be extended to higher level automated vehicles. This permits the notion, that passive drivers with an external LOC accept a larger variety of driving behaviors as comfortable, whereas passive drivers with an internal LOC may be more critical.
18
On a related note concerning driving velocity, Horswill and McKenna (1999) found participants to feel more comfortable with higher speeds when instructed to imagine being the driver, i.e. in control, in comparison to when being instructed to imagine being the passenger, i.e. control being external. These results lead to the idea that persons might prefer lower speeds when being passive drivers in automated vehicles than when actively driving themselves. This, in turn, shows that control is an important factor in the experience of automated driving.
After this review of literature, the three introduced aspects of personality, sensation seeking, trust, and locus of control, seem promising for to influencing experiencing automated driving. Their potential influence will play a role especially in the final study of this thesis.
1.6
Driving style
Next to the general physiological basics of motion perception and the influence of individual personality, another interpersonal influence may play a role in experiencing comfortable automated
driving style: one’s own driving style.
It is still discussed whether driving style can be seen as a facet of personality, as it is internalized and research shows it to be stable over time (see Murphey, Milton, & Kiliaris, 2009; Sagberg, Selpi, Bianchi Piccinini, & Engström, 2015; Tricot, Sonnerat, & Popieul, 2002). Even though phenotypical driving styles are dependent on multiple factors, such as traffic congestion, drivers show a preference for a certain driving style (MacAdam, Bareket, Fancher, & Ervin, 1998).
A driver in manual driving is used to the vehicle behaving according to his or her own driving style. This makes it reasonable, that comfort ratings of automated driving will be made by contrasting
the automated driving style to one’s own. Further, Ellinghaus and Schlag (2001) report that passengers in a manually driven vehicle base their rating of comfort mainly on the driver’s driving style. This is a reason to assume a similar relationship in automated driving (Elbanhawi et al., 2015; Verberne, Ham, & Midden, 2015). Thus, it appears crucial to identify the essential components of an automated driving style, which provide passengers with comfort and ease. The concept of driving style, its assessment, and first insights related to automated driving will be described below.
19 1.6.1 Definition of driving style
Definitions and classifications of driving style vary throughout literature (see Sagberg et al., 2015). There have been multiple approaches to a definition. The definition by Elander, West, and French (1993) is one of the most commonly cited definitions. The authors describe manual driving style as a person’s habitual way of driving. They further assume that this established habit, in turn, is influenced by general and driving specific attitudes and beliefs. Lajunen et al. (1998) also view driving style as something which is internalized and influenced by a person’s character, their perception of
their own driving abilities, and their driving experience.
There are more definitions to be found in literature. However, most definitions share three aspects (see also Sagberg et al., 2015). The first aspect is that driving style is relatively stable and habitual or internalized. Secondly, driving styles differ between drivers. And finally, driving style can be influenced by internal and external constraints, motives, or choices and thus can also be consciously altered. Different research shows the importance of external constraints in the analysis of driving style. A driver may show different driving styles depending on the current environment, e.g. traffic congestion level, road type, or weather (Ericsson, 2000; Murphey et al., 2009; Sagberg et al., 2015; Tricot et al., 2002). Hence, Sagberg et al. (2015, p. 1251) define driving style as a “habitual way of
driving, which is characteristic for a driver or a group of drivers”. This habitual way explicitly may
include both internal and external influences.
Not only approaches to a definition of driving style vary, but also the presumed underlying factors or components. According to Elander et al. (1993) the existence of different driving styles results from two causes: (1) a different approach to what is a good or a bad driving style in combination with the appraisal of one’s driving skill level and (2) differing attitudes towards driving. Among others, these attitudes also consider how likely the driver believes to be involved in an accident. In a similar way, Groot, Centeno Ricote, and Winter (2012) define the willingness to take risks and the amount of
confidence in one’s own abilities to be the main components of driving style. These aspects are reported to be mainly responsible for different driving styles in younger and older drivers. MacAdam et al. (1998) ascribe the existence of different driving styles to a person’s level of aggressiveness, which
manifests in readiness to overtake, be overtaken, or to follow. A link to sensation seeking can be presumed. The willingness to take risks or engagement in risky behavior seem to be a shared factor in all models.