TRADING AND DERIVATIVES ACTIVITIES
OF BANKS AND SECURITIES FIRMS
Joint report by the
Basle Committee on Banking Supervision and the
Technical Committee of the International Organisation of Securities Commissions ("IOSCO")
Survey of disclosures about trading and derivatives activities of banks and securities firms
In November 1995, the Basle Committee on Banking Supervision1 (Basle
Committee) and the Technical Committee of the International Organisation of Securities Commissions2 (IOSCO Technical Committee) issued a report on the public disclosure of
trading (on-balance-sheet instruments and off-balance-sheet derivatives) and non-trading derivatives activities3 of banks and securities firms. The report contained a survey of
disclosures about trading and derivatives activities in 1994 annual reports for a sample of large, internationally active banks and securities firms, as compared with 1993. It also contained a series of recommendations, both quantitative and qualitative, to stimulate further improvements in disclosure practices. These recommendations drew on the concepts developed in the Discussion Paper on Public Disclosure of Market and Credit Risks by
Financial Intermediaries ("the Fisher report"), released by the Euro-currency Standing
Committee of the G-10 central banks in September 1994 and on the Framework for
Supervisory Information About the Derivatives Activities of Banks and Securities Firms ("the
Supervisory Information Framework"), released jointly by the Basle Committee on Banking Supervision and the IOSCO Technical Committee in May 1995.
This document provides a follow-up survey that includes the 1995 disclosures about trading and derivatives activities of the internationally active banks and securities firms covered in the November 1995 report. It is intended to provide large banks and securities firms with a picture of the advances in disclosure practices over the 1993-1995 period and encourage further enhancements at the international level. As was discussed extensively in the November 1995 report, the Basle Committee and the IOSCO Technical Committee have stressed that meaningful public disclosures play an important role in reinforcing the efforts of supervisors to foster financial market stability. Improved disclosures should also benefit banks and securities firms themselves, enhancing their ability to evaluate and manage their
1 The Basle Committee on Banking Supervision is a committee of banking supervisory authorities which
was established by the central-bank Governors of the Group of Ten countries in 1975. It consists of senior representatives of bank supervisory authorities and central banks from Belgium, Canada, France, Germany, Italy, Japan, Luxembourg, Netherlands, Sweden, Switzerland, United Kingdom and the United States. It usually meets at the Bank for International Settlements in Basle, where its permanent Secretariat is located.
2 The Technical Committee of IOSCO is a committee of the supervisory authorities for securities firms in
major industrialised countries. It consists of senior representatives of the securities regulators from Australia, Canada, France, Germany, Hong Kong, Italy, Japan, Mexico, Netherlands, Spain, Sweden, Switzerland, United Kingdom, and the United States.
exposures to other counterparties and reducing the likelihood that they become susceptible to market rumours and misunderstandings during periods of financial stress.
Compared with 1994, the banks and securities firms included in the survey continued to enhance their trading and derivatives-related disclosures in 1995 annual reports. Management discussion of the risks associated with trading and derivatives activities and the methods used to manage these risks continued to be expanded. Institutions also provided more detailed discussions of accounting and valuation techniques for their trading and derivatives positions. Particularly noteworthy was the increase in the number of institutions that provided quantitative disclosures drawn from their internal value-at-risk methodologies. More than half of the banks included in the survey provided such quantitative information. The Committees strongly encourage these institutions to continue their efforts to develop more meaningful disclosures for their trading and derivatives activities.
Despite these improvements at many leading financial intermediaries, there remain significant disparities, both within and across countries, as regards the type and usefulness of the information disclosed. Moreover, a significant proportion of institutions continue to disclose little about their trading and derivatives activities. These institutions are strongly encouraged to consider the quantitative and qualitative recommendations contained in the November 1995 report, which are reproduced in the Annex. They should also consider the types of disclosures provided by their peers at the international level, as outlined in Tables 2-6 of this year's disclosure survey. The Basle Committee and the IOSCO Technical Committee will continue to monitor improvements in banks' and securities firms' disclosure practices over the coming years.
Comparison of disclosures over the 1993-1995 period
This survey of trading and derivatives-related disclosures focuses on the 1993-1995 annual reports of 67 banks and 12 securities firms, representing a sample of large, internationally active institutions in the G-10 countries (summarised in Tables 1-6). The 1995 results also include two Hong Kong securities firms. These are reported separately in the last column of Tables 2-6 (not aggregated with the G-10 countries because only 1995 financial statements were reviewed). For the most part, the institutions reviewed represent the largest banks and securities firms involved in derivatives in their countries, as measured by the total notional amounts of derivative instruments.4 The institutions reviewed are listed in Table 1,
4 The internationally active banks and securities firms included for each country were those
headquartered in the country and not subsidiaries of foreign banks or securities firms. Luxembourg banks were not included in this analysis, since the large dealers and end-users of derivatives located in Luxembourg are subsidiaries of banks centred in other G-10 countries. Large, internationally active banks for which Luxembourg authorities carry out consolidated supervision tend to be moderate end-users of derivatives instruments.
In a number of jurisdictions, the largest institutions involved in securities activities are either universal banks or majority-owned subsidiaries of internationally active banks. Thus, in order to avoid
3
-which presents the notional amount of the institutions' off-balance-sheet derivatives positions in the national currency and in US. dollars at the closing date of the financial statements.5
As was noted in last year's survey, the tabulation of disclosures is in part a subjective exercise and the review required criteria and judgements to determine whether or not an institution had made a particular disclosure. For example, one bank or securities firm might explicitly provide certain quantitative information, whereas in another bank's or securities firm's annual report, similar information might only be inferred from other complementary data. For purposes of this analysis, indirect communication of information was generally not included in the tables.
While the information on trading and derivatives disclosures included in Tables 2 through 6 is extensive, the tables are not intended to imply recommendations for "best practice" disclosures. The tables instead provide a relatively comprehensive overview of the types of trading and derivatives-related disclosures of large, internationally active banks and securities firms and the evolution of such disclosures over the 1993-1995 period. The Committees believe that the survey should provide an important input to support banks' and securities firms' continued efforts to develop meaningful disclosures in this area.
For the vast majority of the institutions reviewed, disclosure about trading and derivatives activities is provided on a consolidated basis and appears in two main places in the annual report:
• Management's discussion and analysis: This is an analysis of the firm's
financial condition and performance (including financial data) that typically includes a narrative of the firm's risk exposures and techniques for managing risk. This part of the annual report is not typically audited by independent accountants.
double counting, the securities firm portion of this analysis focuses on the stand-alone securities firms of the United States, Japan, and Hong Kong. Securities firms in France, Italy, the Netherlands, Spain, and one major United States broker-dealer, CS First Boston, Inc., were excluded. Firms in these countries and CS First Boston, Inc. are subsidiaries of bank holding companies and, accordingly, are included as applicable in the disclosure analysis for the large, internationally active banks, as are the securities activities of the major universal banks in the G-10 countries.
In the case of Japan - where the close of the annual reporting cycle is March 31, 1996 - the choice of institutions included in Table 1 also depended on the availability of financial statements at the time of the writing of this report. For Canadian banks, the close of the annual reporting cycle is October 31, 1995.
In some cases, there were differences in the scope of disclosures provided in domestic as compared to foreign language annual reports.
5 Since the release of the November 1995 survey, there were two mergers among the institutions included
in the sample: Bank of Tokyo and Mitsubishi Bank in Japan, and Chase Manhattan Corp. and Chemical Banking Corp. in the United States. In order to maintain the same number of institutions in 1995 as in 1994, Sumitomo Bank and State Street Bank were added to this year's survey. For consistency purposes, these new institutions are also included in the 1994 and 1993 results.
In some countries, this portion of the annual report may be referred to as the financial review or management report.
• Annual financial statements: These financial statements generally include the
statements of financial position (balance sheet), income, changes in stockholders' equity and changes in financial position or cash flow. Footnotes, which present information on financial statement line items in narrative and tabular form, are also considered to be a part of the financial statements. The annual financial statements and their footnotes are audited by independent accountants.
This survey considers disclosures in both of these areas of the annual report.
The remainder of this report presents in greater detail developments in qualitative and quantitative disclosures of trading and derivative activities since 1993. In reviewing quantitative trading and derivatives disclosures, the report addresses information about gross position indicators, credit risk, market risk and earnings. Market risk and earnings information is broken down by trading and non-trading (e.g., end-user) activities.6 The
qualitative and quantitative information is summarised in Tables 2-6 at the end of this section.
(1) Qualitative information
As illustrated in Table 2, the banks and securities firms included in the sample continued to expand the qualitative, summary discussion of their trading and derivatives activities in 1995 annual reports as compared with 1994. This trend can be observed for almost all of the disclosure items reviewed in Table 2. The increase in qualitative information provided is particularly noteworthy when looking at the whole 1993-1995 period.
A significant proportion of internationally active banks and securities firms reviewed now provide a comprehensive overview of the business objectives of their trading and derivatives activities, the associated risks, and the methods used to manage these risks. For example, 71 institutions discussed objectives and strategies for trading activities and 66 for non-trading activities, as compared with 38 and 37, respectively, in 1993. The number of institutions discussing how credit and market risk arises increased from 34 and 35, respectively, in 1993 to 66 and 68 in 1995. While there was a significant increase in the number of institutions discussing operating and legal risks, more than half of the institutions included in the survey still do not discuss how these risks arise and how they are managed. This is particularly noteworthy given the prominent losses over the past two years resulting from operating or legal problems.
6 In some countries, it is customary to distinguish derivatives as being held for either trading or end-user
purposes. Other countries identified derivatives as being held for dealing purposes or hedging purposes, or used other designations.
5
-This year's survey placed greater emphasis on disclosures of valuation and accounting policies for trading and derivatives activities, an area where the November 1995 report recommended various improvements. In 1995 annual reports, 58 institutions discussed the methods and assumptions used in valuing financial instruments, compared with 45 in 1994 and 26 in 1993. Twenty-six institutions provided a discussion of their market valuation adjustments or reserves, and 45 discussed their valuation methodology when no quoted prices are available.
The number of institutions providing a general discussion of their accounting policies for derivative instruments increased from 63 in 1993 to 72 in 1995. A significant number of institutions provided further detail on their accounting policies, for example, by distinguishing between accounting methods for different types of derivatives instruments (60) or by discussing hedge accounting criteria (48). Only 13 institutions discussed the accounting treatment for credit losses related to derivative instruments.
In sum, there have been notable enhancements in the qualitative discussions provided by the banks and securities firms included in the survey. At the same time, there remain differences across institutions, both nationally and internationally, regarding the level of detail provided for such disclosures.
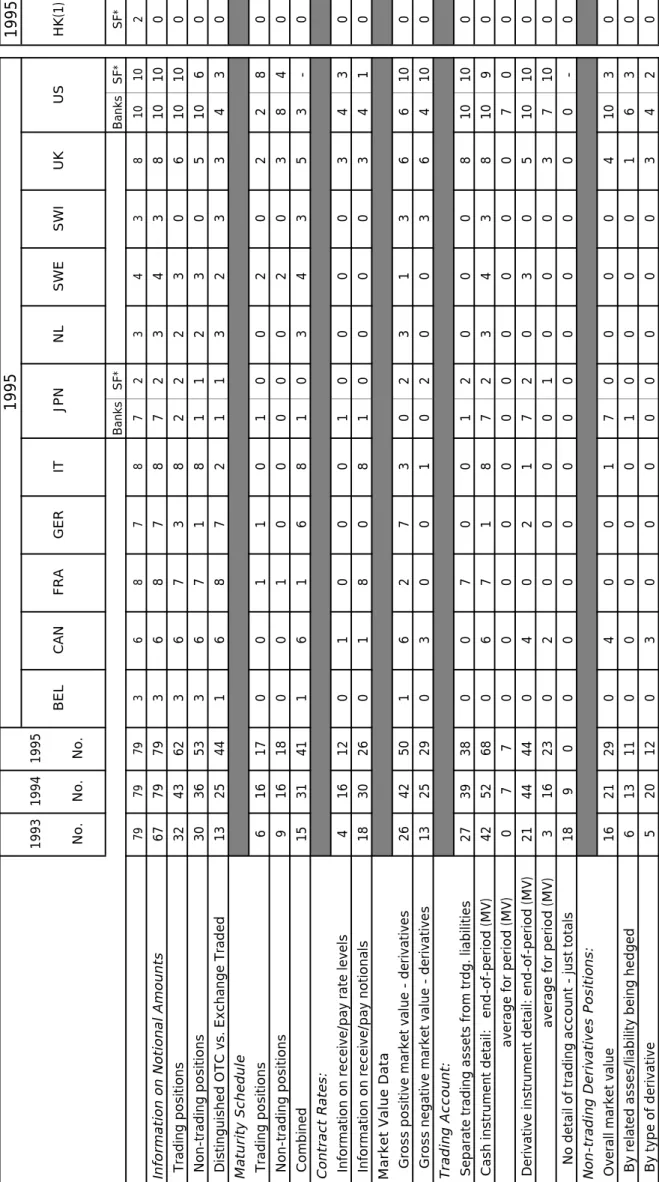
(2) Quantitative information
Table 3 presents an overview of disclosures about notional amounts and market values of instruments held for trading purposes (on- and off-balance-sheet) and derivatives held for non-trading purposes. These measures are indicative of an institution's involvement in derivative instruments.
As in 1994, all of the 67 banks and 12 securities firms provided information about the notional amounts of their derivatives holdings. In 1995, there was a significant increase in the number of institutions that separated out trading from non-trading positions, with a majority of institutions now providing this information. Moreover, 44 institutions distinguished OTC from exchange-traded instruments in 1995, as compared with 25 in 1994.
As regards market value data, there was some increase in the number of institutions providing quantitative disclosures of trading account market values. For example, 68 institutions disclosed market values of cash instruments in the trading account, compared with 52 in 1994. Forty-four disclosed such information for derivatives, the same as in 1994. There was an increase in the number of institutions disclosing information on the overall market value of derivatives held outside of the trading account (for example for hedging purposes) from 21 in 1994 to 29 in 1995.
(a) Credit risk
In comparison to 1994, banks and securities firms generally expanded the quantitative information provided on credit risk (Table 4). In some cases, this information was provided separately for derivatives instruments; in other cases, cash and
derivatives-related disclosures were combined. The most common type of disclosure on credit exposure was information on gross positive market values (without netting), current credit exposures (with netting), and risk-based capital credit-equivalent amounts. No institution provided data on the volatility of credit exposure of its derivatives holdings over the reporting period. Fifteen disclosed information on the potential credit exposure, a measure of how much current credit exposure could increase in the future as a result of movements in underlying rates or prices.
Survey institutions also provided more information on the credit quality of their trading and derivatives portfolios. For example, 41 institutions disclosed information on counterparty credit quality, as compared with 27 in 1994 and just 6 in 1993. Similarly, the number of institutions disclosing information on credit concentrations grew to 46 in 1995, compared with 31 in 1994 and 11 in 1993. As in 1994, few institutions provided information on collateral and other credit enhancements, actual credit losses, or on non-performing contracts for their derivatives portfolios.
(b) Market risk
Trading activities
A noteworthy development in 1995 was the continued expansion in the number of institutions disclosing quantitative information on their exposure to market risk (Table 5). Increasingly, the banks included in the survey are basing such disclosures on their internal value-at-risk methodologies. Value-at-risk is an estimate of potential trading losses over a given time horizon, measured at a certain level of statistical confidence. In 1995, 36 banks provided such value-at-risk-based disclosures, as compared with 18 in 1994 and 4 in 1993.
In addition to disclosing a point in time value-at-risk number for the end of the financial statement period, a significant number of banks also provided information on their value-at-risk exposures over the whole reporting period. For example, 20 banks disclosed the average value-at-risk number for the reporting period, as compared with 10 in 1994 and zero in 1993. Seventeen banks disclosed the high and low value-at-risk numbers in 1995, compared with 7 in 1994 and zero in 1993. Moreover, 10 banks directly related daily value-at-risk estimates to actual changes in portfolio value, one of the key recommendations of the September 1994 Fisher Report. Institutions typically used graphical means to compare daily value-at-risk estimates with actual portfolio outcomes.
There was also an increase in the number of institutions disclosing the assumptions lying behind their value-at-risk estimates, an area where the Basle Committee/IOSCO report identified the need for further improvements. In 1995 annual reports, 35 banks disclosed the confidence interval used, 33 the holding period, and 14 the method of aggregation across risk factors.
Historically, the major securities firms have not provided quantitative market risk disclosures of their trading and derivatives activities in their annual reports. As part of the
7
-Derivatives Policy Group's "Framework for Voluntary Oversight" on over-the-counter derivatives, released in March 1995, the securities firms that are major US. derivatives dealers are providing to United States supervisors on a quarterly basis measures of "capital-at-risk", defined as the maximum loss expected to be exceeded with a probability of one percent over a two-week period. In addition, these dealers provide supervisors with the results of a series of core risk factor stress tests of their over-the-counter derivatives portfolios.
Non-trading derivatives activities
As in last year's survey, the most common form of disclosure by the surveyed banking institutions that used derivatives for non-trading purposes involved schedules of notional amounts, maturities and (for swaps) contractual rates paid and received. For the 1993-1995 period, the most prevalent means of conveying how derivatives are used to manage a bank's interest rate risk was a gap position schedule (used by 26 of the banks in 1995 as compared with 25 in 1995).7 Many banks publishing a gap schedule for interest rate risk cautioned that it represented only a point-in-time picture of risk and did not capture options risk and other dynamic characteristics of the balance sheet.
The number of banks that furnished quantitative information on value-at-risk measures for their non-trading activities remained low. Fifteen banks provided a discussion of the effect on capital or earnings of a specified rate shock. No bank disclosed the duration of derivatives held for non-trading purposes. A few of the banks providing information on their non-trading derivatives holdings described in varying detail whether the derivatives were linked to specific components of the balance sheet or were used to manage overall risk exposures.
(c) Earnings
Trading activities
As illustrated in Table 6, 64 institutions provided information on the impact of their trading activities on earnings (whether cash, derivatives, or both), compared with 59 in 1994 and 48 in 1993. The most noteworthy development in 1995 was that almost twice as many institutions provided a breakdown of their trading income by risk exposure or type of business (34 in 1995 compared with 18 in 1994).
7 Gap schedules disclosed by banks organise financial assets and liabilities according to maturity in a number of time bands. The difference between assets and liabilities in each time interval ( "gap" or net exposure) forms the basis for assessing interest rate risk. Derivatives of various maturities can be used to adjust the net exposure of each time interval to alter the overall interest rate risk of the institution. Historically, securities firms have not presented gap table disclosures in their annual reports.
Non-trading derivatives activities
With regard to derivatives held for non-trading purposes, the number of institutions disclosing details about how derivatives affect accrual-based accounting income and expense (historical cost accounting) remained relatively low in 1995. Ten banks reported the effect that derivatives accounted for on an accrual basis had on revenue, compared with 11 in 1994. Eight banks and 6 securities firms reported the overall effect on net interest margins of their non-trading derivatives activities. Thirteen banks disclosed deferred gains or losses on non-trading derivatives and 5 provided information on when the deferrals would be reflected in future earnings. Twenty-one banks and 3 securities firms disclosed the unrealised gains and losses associated with non-trading derivatives positions, compared with 18 and 3, respectively, in 1994.
Table 1
Banks and securities firms included in survey 31 December 1995 (except as noted)
In alphabetical order, by country
Notional Amounts (Billions) (1)
National US
Country Institution Currency Dollars
Belgium Bank Brussel Lambert 5,920 201
Generale Bank 6,190 210
Kredietbank 8,192 278
Canada (2) Bank of Montreal 667 498
Bank of Nova Scotia 654 488
Canadian Imperial Bank of Commerce 1179 880
National Bank 88 66
Royal Bank of Canada 1245 929
Toronto Dominion Bank 616 460
France (3) Banque Nationale de Paris 8,890 1,814
Credit Agricole 2,568 524
Credit Commercial de France 1,800 367
Credit Lyonnais 5,160 1,053
Indosuez 3,856 787
Paribas 9,197 1,877
Societe Generale 12,460 2,543
Union Europeenne de CIC 2,004 409
Germany Bank Gesellschaft Berlin 316 220
Bayerische Hypotheken u. Wechselbank 229 160
Bayerische Vereinsbank AG 651 454
Commerzbank 1,112 776
Deutsche Bank 2,367 1,651
Dresdner Bank 919 641
Westdeutsche Landesbank 510 356
(1) Notional amounts of off-balance-sheet derivative instruments (2) Fiscal year-end (FYE) of 31 October 1995
(3) The 1995 notional amounts are not directly comparable to the 1994 amounts included in last year's report.
Banks and securities firms included in survey 31 December 1995 (except as noted)
In alphabetical order, by country
Notional Amounts (Billions)
National US
Country Institution Currency Dollars
Italy Banca Commerciale Italiana 121,789 77
Banca CRT 37,123 23
Banca di Roma 49,225 31
Banca Nazionale del Lavoro 50,228 32
Banco Napoli 40,825 26
Credito Italiano 93,177 59
Istituto Mobiliare Italiano 83,189 52
San Paolo di Torino 290,404 183
Japan (4)
Banks: Bank of Tokyo Mitsubishi 304,893 2,869
Fuji Bank 200,929 1,891
Industrial Bank of Japan 220,070 2,071
Long-Term Credit Bank of Japan 69,170 651
Sanwa Bank 158,910 1,495
Sumitomo Bank 174,727 1,644
Tokai Bank 71,304 671
Securities firms: The Nikko Securities Co., Ltd. 9,522 90
The Nomura Securities Co., Ltd. 15,929 150
Netherlands ABN-AMRO Bank 1,482 924
ING Bank 441 275
Rabobank 637 397
Sweden Nordbanken 1,052 158
Skandinaviska Enskilda Banken 3,707 557
Sparbanken Sverige (Swedbank) 1022 153
Svenska Handelsbanken 2,732 410
Switzerland Credit Suisse 2,254 1,959
Swiss Bank Corp. 2,970 2,581
Union Bank of Switzerland 2,049 1,781
Table 1(con't)
Banks and securities firms included in survey 31 December 1995 (except as noted)
In alphabetical order, by country
Notional Amounts (Billions)
National US
Country Institution Currency Dollars
United Kingdom Barclays 1,012 1,569
Hambros (5) 175 271
HSBC 985 1,527
Lloyds 926 1,435
National Westminster 1,206 1,869
Royal Bank of Scotland (6) 176 273
Schroders 67 104
Standard Chartered 206 319
United States
Banks: (7) Bank of New York Co. 47 47
BankAmerica Corp. 1,581 1,581
Bankers Trust N.Y. Corp. 1,702 1,702
Chase Manhattan Corp. 4,834 4,834
Citicorp 2,590 2,590
First Chicago Corp. 815 815
J.P. Morgan & Co. 3,447 3,447
NationsBank Corp. 1,007 1,007
Republic New York Corp. 268 268
State Street 59 59
Securities firms: The Bear Stearns Companies, Inc. (8) 128 128
Donaldson, Lufkin & Jenrette, Inc. 39 39
The Goldman Sachs Group, L.P. (9) 1,091 1,091
Lehman Brothers Holdings, Inc. (10) 1,209 1,209
Merrill Lynch & Co., Inc. (11) 1,610 1,610
Morgan Stanley Group, Inc. (10) 985 985
Paine Webber Group, Inc. 41 41
Prudential Securities, Inc. 28 28
Salomon, Inc. 1,659 1,659
Smith Barney Holdings, Inc. 48 48
Hong Kong
Securities firms Peregrine Investments Holdings Ltd. N.A. N.A.
Jardine Matheson Holdings Ltd. N.A. N.A.
(5) FYE 31 March 1996 (6) FYE 30 September 1995
(7) Source: Publicly available regulatory financial statements filed with the Federal Reserve (8) FYE 30 June 1995
(9) FYE 24 November 1995 (10) FYE 30 November 1995 (11) FYE 29 December 1995
TABLE 2
QUALITATIVE INFORMATION
1995 1993 1994 1995 No. No. No. BEL C A N FRA GER IT J P N NL SWE S W I U K US Banks SF* Banks SF* 7 9 7 9 7 9 36878 7 2 3438 1 0 1 0Discussion of Ojectives: Objectives & strategies for trading
3 8 5 8 7 1 26875 7 2 0438 1 0 9
Objectives & strategies for non-trading activities
3 7 5 7 6 6 26875 6 1 2408 1 0 7
Discussion of Risks : Placed in context with balance sheet risks
3 7 5 8 7 2 16776 7 1 2438 1 0 1 0
Discussion of specific risks: Credit risk - described how risk arises
3 4 5 5 6 6 26573 7 2 2435 1 0 1 0
* Risk management method described
3 0 5 6 7 1 26673 7 2 3438 1 0 1 0
Market risk - described how risk arises
3 5 5 6 6 8 26773 7 2 1436 1 0 1 0
* Risk management method described
2 9 5 8 7 4 26775 7 2 3438 1 0 1 0
Liquidity risk - described how risk arises
1 9 3 7 4 6 16521 2 0 0417 9 8
* Risk management method described
1 5 3 8 4 7 16521 2 0 1418 9 7
Operating & Legal Risks - described risks
1 0 2 6 3 2 16110 6 1 0212 3 8
* Risk management method described
8 2 1 3 1 06110 6 0 1213 3 7
Discussion of leveraged instruments
0 5 8 00000 0 0 0030 5 0
Discussion of How Market Values Estimated
2 6 4 5 5 8 04878 2 2 0133 1 0 1 0
* Disc. of market valuation adjustments/reserves
9 1 4 1 8 05301 0 0 0023 2 2
* Disc. of valuation where no quoted prices
2 7 3 1 4 5 03717 2 1 1013 1 0 9
Discussed - Accounting Policies for Derivatives
6 3 7 1 7 2 36878 1 1 3438 1 0 1 0
* Accounting methods for various types of derivatives
5 3 5 6 6 0 36860 1 0 3438 1 0 8
* Hedge accounting criteria
3 5 4 1 4 8 11868 1 0 1131 1 0 7 * Terminations of derivatives 1 2 2 8 3 3 02208 7 0 1012 1 0 0
* Netting of assets/liabilities arising from derivatives
1 2 2 1 2 7 04040 1 0 0035 1 0 0
* Accounting treatment for derivatives credit losses
9 9 1 9 03360 0 0 0010 6 0
TABLE 3
GROSS POSITION INDICATORS
1995 1995 1993 1994 1995 No. No. No. BEL C A N FRA GER IT J P N NL SWE S W I U K US HK(1) Banks SF* Banks SF* SF* 7 9 7 9 7 9 36878 7 2 3438 1 0 1 0 2
Information on Notional Amounts
6 7 7 9 7 9 36878 7 2 3438 1 0 1 0 0 Trading positions 3 2 4 3 6 2 36738 2 2 2306 1 0 1 0 0 Non-trading positions 3 0 3 6 5 3 36718 1 1 2305 1 0 6 0
Distinguished OTC vs. Exchange Traded
1 3 2 5 4 4 16872 1 1 3233 4 3 0
Maturity Schedule Trading positions
6 1 6 1 7 00110 1 0 0202 2 8 0 Non-trading positions 9 1 6 1 8 00100 0 0 0203 8 4 0 Combined 15 31 41 16168 1 0 3435 3 -0
Contract Rates: Information on receive/pay rate levels
4 1 6 1 2 01000 1 0 0003 4 3 0
Information on receive/pay notionals
1 8 3 0 2 6 01808 1 0 0003 4 1 0
Market Value Data Gross positive market value - derivatives
2 6 4 2 5 0 16273 0 2 3136 6 1 0 0
Gross negative market value - derivatives
1 3 2 5 2 9 03001 0 2 0036 4 1 0 0
Trading Account: Separate trading assets from trdg. liabilities
27 39 38 00700 1 2 0008 1 0 1 0 0
Cash instrument detail: end-of-period (MV)
4 2 5 2 6 8 06718 7 2 3438 1 0 9 0
average for period (MV)
0 7 7 00000 0 0 0000 7 0 0
Derivative instrument detail: end-of-period (MV)
21 44 44 04021 7 2 0305 1 0 1 0 0
average for period (MV)
3 1 6 2 3 02000 0 1 0003 7 1 0 0
No detail of trading account - just totals
1 8 9 0 00000 0 0 0000 0 -0
Non-trading Derivatives Positions: Overall market value
16 21 29 04001 7 0 0004 1 0 3 0
By related asses/liability being hedged
6 1 3 1 1 00000 1 0 0001 6 3 0 By type of derivative 5 2 0 1 2 03000 0 0 0003 4 2 0
TABLE 4
CREDIT RISK
1995 1993 1994 1995 No. No. No. BEL C A N FRA GER IT J P N NL SWE S W I U K US Banks SF* Banks SF* 7 9 7 9 7 9 36878 7 2 3438 1 0 1 0Current credit exposure (i.e., with netting)
2 2 3 8 3 6 03410 3 1 0034 1 0 7
Volatility of credit exposure
0 0 0 00000 0 0 0000 0 0
Gross positive market value
2 6 4 2 5 0 16273 0 2 3136 6 1 0
Potential credit exposure
1 9 15 06011 0 0 3001 3 0
Counterparty credit quality
6 2 7 4 1 16470 0 0 2226 5 6 By counterparty type 4 2 1 3 0 16470 0 0 2206 1 1
By internal or external credit rating
6 1 1 1 7 01120 0 0 0020 5 6 Information on Concentrations 1 1 3 1 4 6 15478 0 0 3006 5 7
Exposure by geographic area
8 2 0 2 1 12470 0 0 1001 1 4
Exposure by industry groups
1 1 3 0 3 6 04470 0 0 3006 5 7
Other (e.g., exposures > x% of capital)
8 1 5 8 00008 0 0 0000 0 0
Collateral & other credit enhancements
0 2 3 00100 0 0 0010 1 0
Actual credit losses
4 9 10 03000 1 0 0000 6 0 Nonperforming contracts 1 8 8 01000 1 0 0000 6 0
For banks, RBC credit equivalent - derivatives
34 45 45 06371 7 0 3407 7
TABLE 5
MARKET RISK INFORMATION
1995 1995 1993 1994 1995 No. No. No. BEL C A N F R A GER IT J P N N L SWE SWI U K U S HK(1) Banks S F * Banks S F * S F * 7 9 7 9 7 9 36878 7 2 3438 1 0 1 0 2
Trading Activities: Disclosed Value-at-Risk Data:
4 1 8 3 6 02572 7 0 0033 7 0 0
Provided data on daily VAR
4 1 8 2 2 02211 6 0 0033 4 0 0
Provided data on VAR (holding period > daily)
2 4 16 00361 1 0 0020 3 0 0
Those disclosing VAR also provided: High/Low VAR
0 7 17 00101 5 0 0022 6 0 0 Average VAR 0 1 0 2 0 01111 6 0 0032 5 0 0
Daily change in value of portfolio
0 5 11 00000 2 0 0020 7 0 0
Average daily change in value of portfolio
0 3 4 00000 0 0 0000 4 0 0
Changes in portfolio value exceeding VAR
0 6 10 00010 3 0 0010 5 0 0 Confidence interval 2 1 2 3 5 02472 7 0 0033 7 0 0 Holding period 0 1 6 3 3 01461 7 0 0033 8 0 0
Method of aggregation across risk factors
0 4 14 00400 2 0 0013 4 0 0 Scenario analysis 1 2 6 00040 0 0 0020 0 0 0
Other trading acct. market risk data
0 3 1 0 01202 0 1 0004 0 0 0
Non-trading Derivatives Effect of derivatives on duration
1 2 0 00000 0 0 0000 0 0 0
Effect of derivatives on int. repricing 'gap' positions
23 25 26 06008 1 0 0003 8 0 0
Derivatives' expected cash flows by maturity dates
0 1 1 1 0 00000 0 0 0003 7 0 0
Scenario analysis: impact of rate shock
5 1 4 1 5 16100 0 0 0001 6 0 0
VAR for non-trading portfolios
0 4 5 00001 0 0 0000 4 0 0
TABLE 6
EARNINGS INFORMATION
1995 1993 1994 1995 No. No. No. BEL C A N FRA GER IT J P N NL SWE S W I U K US Banks SF* Banks SF* 7 9 7 9 7 9 36878 7 2 3438 1 0 1 0Trading Activities: Information on trading income
4 8 5 9 6 4 35678 2 1 3038 1 0 8
By risk exposure/line of business
8 1 8 3 4 03040 1 0 3032 1 0 8 By instrument type 1 2 1 3 1 4 03100 0 1 0000 1 8
By cash positions vs. derivative instruments
2 2 2 3 1 8 02108 0 0 0000 4 3 Other 2 9 2 9 3 4 33678 0 0 0016 0 0
Net interest revenue from cash positions
2 9 3 5 2 6 03508 1 0 0022 5 0
Non-trading Derivatives Revenue impact (amount or %) Of derivatives alone
5 1 1 1 0 01101 1 0 0002 4 0
Overall sensitivity of net interest margins
1 5 1 8 1 4 00008 0 0 0000 0 6
Amount of deferred gains/losses
7 8 1 3 01006 0 0 0003 3 0
Amortization period - deferred gains/losses
2 6 5 00000 0 0 0002 3 0
Unrealised gain or loss on derivatives
1 2 2 1 2 4 32002 1 0 0004 9 3
Annex
Recommendations contained in the November 1995 Basle Committee/IOSCO report:
Public Disclosure of the Trading and Derivatives Activities of Banks and Securities Firms
Recommendations
This section focuses on recommendations for further improvements in disclosure practices of large banks and securities firms with significant involvement in trading and derivatives activities. The recommendations may also be useful for other financial and non-financial companies with significant trading and derivatives activities.
The Basle Committee and the IOSCO Technical Committee encourage banks and securities firms to continue their efforts to improve disclosure practices by providing meaningful summary information, both qualitative and quantitative, about their trading and derivatives activities. Disclosures should provide a picture of the scope and nature of an institution's trading and derivatives activities, as well as information on the major risks associated with these activities, including credit risk, market risk and liquidity risk. Institutions should also disclose information on the actual performance in managing these risks, particularly with regard to exposure to market risk.1 In addition, disclosures should
provide meaningful, summary information on how trading and derivatives activities contribute to an institution's earnings profile.
As discussed in the Fisher report, institutions are encouraged to disclose quantitative information on their risk exposures and on their performance in managing these exposures in a manner that is consistent with the methodologies employed in their internal risk measurement and performance assessment systems. This should help ensure that disclosure practices keep pace with innovations in risk management practices over time, particularly in areas undergoing rapid evolution such as market risk, where an increasing number of institutions are introducing or developing further their value-at-risk methodologies. Disclosures should focus on material risk exposures and the amount of information should stand in relation to the importance of the activity in the institution's overall business, risk profile and earnings.
For fundamental disclosures of an institution's derivatives activities (trading and non-trading, including related on-balance-sheet positions), institutions are also encouraged to
1 To date, statistical approaches for measuring performance in managing credit risk have not been
developed as extensively in banks and securities firms as have market risk performance measures. Therefore, measuring an institution's performance in managing credit risk is generally more difficult than for market risk at this time. As these statistical techniques are developed further and become established, institutions should disclose summary information consistent with these performance measurement techniques.
look to the common minimum framework that is presented in the Supervisory Information Framework paper. The common minimum framework calls for information on an institution's overall derivatives market activity and exposure to credit and, to a certain extent, market liquidity risks. The minimum framework can serve as a reference point for institutions that currently provide little or no quantitative information on their derivatives activities. Furthermore, disclosure of information that is consistent with the common minimum framework could improve the consistency and comparability of basic annual report disclosures.
The remainder of this section discusses these various points in greater detail, focusing first on qualitative disclosures and then discussing quantitative disclosures.
(A) Qualitative disclosures
Qualitative disclosures should provide an overview of an institution's overall business objectives, its risk-taking philosophy, how trading and derivatives activities fit into these overall objectives, as well as the principal internal control procedures that are in place for managing these activities. In addition, qualitative disclosures provide management with the opportunity to elaborate on and provide depth to the quantitative disclosures provided in the annual report.
More specifically, banks and securities firms are encouraged to consider the following types of summary qualitative information about their trading and derivatives activities:
Risks and management controls
- An overview of key aspects of the organisational structure central to the institution's risk management and control process for its trading and derivatives activities.
- A description of each of the major risks arising from an institution's trading and derivatives activities (including credit risk, market risk, liquidity risk, operational and legal risk) and the methods used to measure and manage these risks (for example limit policies for exposures to market risk and credit risk and how value-at-risk measures are used to manage market risks). In addition, a discussion of how the institution assesses its performance in managing these various risks. - Information about the overall objectives and strategies of trading activities
(involving all on- and off-balance-sheet components) and whether the institution is a wholesale market maker, engages in proprietary trading, or takes positions as an accommodation to customers.
- In the case of non-trading derivatives activities, a description of the general objectives for these activities. For example, in the case of banks, such disclosures could clarify how these instruments are being used to hedge risks inherent in
3
-banking activities such as foreign exchange or interest rate risk, or, where relevant, if they are being used for other risk management activities.
- A summary of activity in and the risks associated with high risk instruments or complex instruments such as leveraged derivatives.
Accounting and valuation methods
- A discussion of the accounting policies and methods of income recognition that apply to trading activities (involving both cash instruments and derivatives) and to non-trading derivatives activities. Disclosures about accounting polices should be sufficient to enable the user of financial statements to understand important distinctions that may exist in the accounting treatments of various types or uses of derivatives instruments. In the absence of clear accounting standards for many types of derivatives activities, it is particularly important that an institution discuss the accounting treatments applied to its various derivatives holdings. For example, it would be useful to summarise the methods used to account for derivatives, the types of derivatives accounted for under each method and the criteria to be met for each accounting method to be used (e.g. criteria for recognising hedges). Furthermore, institutions are encouraged to specify the accounting treatment applied if the criteria for a given method are not met. Other important types of information include the accounting treatments for terminations of derivatives contracts, derivatives that are hedges of anticipated transactions, balance sheet netting of assets and liabilities arising from derivatives and credit losses on derivatives instruments.
- A general discussion of the valuation methodologies used as well as information on whether adjustments are made after positions have been market to market. In the case of instrument categories for which there are no quoted market prices, a general discussion of the market value estimation techniques used and a summary of the procedures for checking the accuracy of these estimates.
For background on the types of qualitative information about derivatives and related activities that may be appropriate for disclosure purposes, banks are encouraged to consider the report, Risk Management Guidelines for Derivatives and securities firms the report, Operational and Financial Risk Management Control Mechanisms for
Over-the-Counter Derivatives Activities of Regulated Securities Firms. These reports were issued,
respectively, by the Basle Committee and the IOSCO Technical Committee with a joint cover note in July 1994 and they highlight key attributes of the risk management systems of banks and securities firms.
(B) Quantitative disclosures
(1) Market activity, credit risk and market liquidity
Large, internationally active banks and securities firms should provide summary information about the composition of their trading portfolios. This information could include the end-of-period and average market values of major categories of on- and off-balance-sheet instruments held for trading purposes. Moreover, this disclosure could distinguish between trading assets and trading liabilities.
With regard to derivatives activities (trading and non-trading), institutions should provide financial statement users with a clear picture of their involvement in the derivatives markets, both OTC and exchange-traded. Institutions could draw from the common minimum framework of the Supervisory Information Framework paper for guidance about basic disclosures of their derivatives activities and how these activities affect the overall risk profile of the institution. Where appropriate, institutions are encouraged to place information on derivatives in the context of related on-balance-sheet positions.
The common minimum framework is presented in detail in Section III. and Annex 3 of the Supervisory Information Framework paper. It focuses primarily on meaningful summary information relating to overall market activity, credit risk and, to a certain extent, market liquidity. Information on market activity is provided by broad risk category (interest rate, exchange rate, precious metals, other commodities and equities), by broad instrument category (futures, forwards, swaps and options) and by maturity band (one year or less, over one year to five years, greater than five years). The minimum framework provides insight into whether derivatives are used primarily for trading or non-trading purposes (e.g. hedging) and whether an institution is primarily involved in exchange-traded or OTC derivatives activities. The framework also includes a variety of information on credit risk, taking into account counterparty credit quality as well as the availability of collateral and guarantees. Finally, the framework provides information on non-performing derivatives contracts and actual credit losses on these instruments.
Annex 4 of the Supervisory Information Framework paper presents definitions for the concepts used in the common minimum framework. For institutions that base their disclosures on the type of information contained in the common minimum framework, Annex 4 provides a basis for greater clarity and comparability of these disclosures. For example, for basic disclosures of information such as replacement cost, it should be clear to the financial statement user whether or not this information takes account of legally enforceable bilateral netting agreements.
Institutions that have developed alternative, more sophisticated internal methodologies for the type of information contained in the common minimum framework could base their public disclosures on these methods. For example, some institutions have developed simulation models for measuring potential credit exposure, which may produce
5
-more precise estimates of exposure than the add-ons approach of the Basle Capital Accord included in the common minimum framework. Furthermore, where material, institutions are encouraged to consider disclosing additional summary information about credit and liquidity risks (such as information on credit concentrations and funding risk). The "catalogue" section of the Supervisory Information Framework paper, issued in May 1995 and the risk management guidelines released by the Basle Committee and the IOSCO Technical Committee in July 1994 discuss meaningful information that could be presented in annual report disclosures.
(2) Market risk
Currently, institutions employ a wide range of techniques to measure and manage their exposure to market risks, including value-at-risk methodologies, duration or gap analysis and scenario analysis. However, more and more large banks and securities firms are measuring and managing their market risk exposure based on a value-at-risk approach, which involves the assessment of potential losses due to adverse movements in market rates and prices of a specified probability over a defined holding period.
Given the diversity and rapid evolution of measurement and risk management techniques in the area of market risk, it does not now seem desirable to recommend a uniform approach for market risk disclosures. Instead and as argued in the Fisher report, institutions should provide summary quantitative information on their exposure to market risk based on the methods they use for internal risk measurement purposes, together with information on their actual performance in managing these risks. The guidelines for managing the risks of derivatives, released by the two Committees in July 1994, stressed that dealer banks and securities firms should produce daily information on profits and losses on their trading activities for internal risk management purposes. Institutions are encouraged to draw from this internally-generated information for public disclosure purposes. Moreover, daily profit and loss disclosures should be combined with the corresponding daily value-at-risk numbers. The Fisher report provides a detailed discussion, including a series of illustrative examples, on how institutions could disclose such quantitative, performance-based information on market risks.
Quantitative disclosures should be supplemented with information on the major assumptions and parameters necessary to understanding an institution's market risk disclosures. For example, in the case of market risk disclosures based on value-at-risk measures, institutions could specify the type of model used (variance/covariance, historical simulation, etc.), the portfolios covered by the model, as well as information on the model's parameters such as the holding period, confidence level and the observation period.
(3) Earnings
Institutions are encouraged to disclose information on how trading activities (derivatives and cash positions) affect earnings, as well as information on the earnings impact
of non-trading derivatives activities. As with market risk information, the Committees encourage institutions to base these disclosures on their internal measurement and accounting systems. The Committees recognise that accounting standards and valuation techniques differ across member countries and that earnings disclosures are therefore not directly comparable at the international level. This makes it all the more important for institutions to provide additional qualitative information explaining the accounting and valuation techniques used in the financial statements (see qualitative section above).
For additional guidance on the type of earnings information that institutions could disclose, the Committees recommend that institutions refer to the "catalogue" section of the Supervisory Framework paper, which includes discussion of the following types of information:
- Revenues from trading activities: a summary of trading revenues, for cash and derivatives instruments combined, broken down by major risk category (interest rate, foreign exchange, equities, commodities and other). Alternatively, institutions could provide a breakdown by major product trading desk (i.e. bonds, swaps, foreign exchange, equities, etc.).
- Non-trading derivatives holdings: quantitative information about the effect on earnings of off-balance-sheet positions held by the organisation to manage interest rate risk, currency risk and other risks. This information provides insight into how derivatives are being used to manage non-trading risks (for example, exposure to interest rate risk) and the degree to which these efforts have been successful. - Unrealised or deferred losses: for derivatives that are accounted for on a historical
cost basis, summary information on the notional amounts, market values and unrealised losses on these instruments. In addition, information on the amount of realised losses on derivatives positions that have been deferred and the timing of their future recognition in the profit and loss account. This information provides insight into how future earnings and capital may be affected by losses that have not yet been realised or that have been deferred.
- Derivatives valuation reserves and actual credit losses: information on the valuation reserves that an institution has established for derivatives activities, together with information on any material credit losses on derivatives instruments experienced during the period covered by the financial disclosures.