Original
article
Child
health
and
access
to
health
care
in
France:
Evidence
on
the
role
of
family
income
Sante´ et
recours
aux
soins
des
enfants
franc
¸
ais
:
le
roˆle
du
rev
enu
familial
B.H.
Apouey
*
,
P.-Y.
Geoffard
ParisSchoolofEconomics–CNRS,baˆtimentA,48,boulevardJourdan,75014Paris,France
Received24May2013;accepted18December2013 Availableonline2June2014
Abstract
Background.– OurpaperinvestigatestherelationshipbetweenfamilyincomeandchildhealthinFrance.Wefirstexaminewhetherthereisa significantcorrelationbetweenfamilyincomeandchildgeneralhealth,andtheevolutionofthisrelationshipacrosschildhoodyears.Wethenstudy theroleofspecifichealthproblems,accesstohealthcare,andsupplementalhealthinsurancecoverage,intheincomegradientingeneralhealth.We alsoquantifytheroleofincomeinchildanthropometricmeasurements.Wheneverpossible,wecompareourresultsforFrancewiththoseobtained forotherdevelopedcountries.
Methods.– Using dataon up toapproximately24,000 French childrenfrom theHealth, HealthCare and Insurance Surveys, weapply econometrictechniquestoquantifythecorrelationbetweenhouseholdincome,childgeneralhealth,specifichealthproblems,anthropometric characteristics,accesstohealthcare,andsupplementalinsurancecoverage.
Results.– ThereisapositiveandsignificantcorrelationbetweenfamilyincomeandchildgeneralhealthinFrance.Theincomegradientin childgeneralhealthispossiblysmallerinFrancethaninotherdevelopedcountries.Thegradientingeneralhealthisexplainedbythegreater prevalenceofspecifichealthproblemsforlow-incomechildren.Inaddition,incomeisstronglycorrelatedwithanthropometriccharacteristics. Accesstohealthcare,andsupplementalhealthinsurancecoverageareprobablynotmajordeterminantsofthegradientingeneralhealth.
Conclusion.– Therelationshipbetweenincomeandhealthinadulthoodhasantecedentsinchildhood.Improvingaccesstohealthcareservices forchildrenfromlow-incomefamiliesmaynotbeenoughtodecreasesocialhealthinequalitiesinchildhood.
#2014ElsevierMassonSAS.
Keywords:Socioeconomicfactors;Child;Anthropometry;Healthcaredisparities
Re´sume´
Positionduproble`me.– Cettee´tudeportesurlarelationentrelerevenudume´nageetlasante´ desenfantsenFrance.Nousnousinte´ressons d’aborda` l’existenced’ungradientrevenu/sante´ ge´ne´raleeta` sone´volutionaucoursdel’enfance.Nousnousinterrogeonsensuitesurleroˆledes proble`mes spe´cifiques de sante´ dans le gradient de sante´ ge´ne´rale. Nous quantifions e´galement l’effet du revenu sur les caracte´ristiques anthropome´triques.Finalement,nousexaminonssil’acce`sauxsoinsetlacouverturesante´ comple´mentairesontdesme´canismessusceptibles d’expliquerlegradientdesante´ ge´ne´rale.Lorsquecelaestpossible,nouscomparonsnosre´sultatsavecceuxobtenuspourd’autrespaysde´veloppe´s. Me´thodes.– Nousexploitonslesdonne´esdel’EnqueˆtesurlaSante´ etlaProtectionSociale,entre1996et2010.Ellescontiennentaumaximum 24000observationsenviron.A` l’aided’outilse´conome´triques,nousquantifionslacorre´lationentrelerevenudume´nage,lasante´ ge´ne´ralede l’enfant, ses proble`mes spe´cifiques de sante´, ses caracte´ristiques anthropome´triques, son acce`s aux services de soins, et sa couverture comple´mentaire.
Re´sultats.– Lerevenudume´nageestsignificativementcorre´le´ a` lasante´ ge´ne´raledesenfantsenFrance.Ceteffetsembleplusfaibleen Francequedanslesautrespaysde´veloppe´s.Cegradientrevenu/sante´ ge´ne´rales’expliqueparlaplusfortepre´valencedeproble`messpe´cifiquesde sante´ chezlesenfantsdefamillesde´munies.Nousmontronsaussiquelerevenuauneffetsurlescaracte´ristiquesanthropome´triques.L’acce`saux soinsetlacouverturecomple´mentairenesemblentpaseˆtredesme´canismesimportantsquiexpliqueraientlacorre´lationentrelerevenuetlasante´ ge´ne´rale.
ScienceDirect
www.sciencedirect.com
Revued’E´ pide´miologieetdeSante´ Publique62(2014)179–190
*Correspondingauthor.
E-mailaddresses:benedicte.apouey@parisschoolofeconomics.eu,benedicte.apouey@gmail.com(B.H.Apouey).
http://dx.doi.org/10.1016/j.respe.2013.12.087
0398-7620/#2014ElsevierMassonSAS.
Open access under CC BY-NC-ND license.
Conclusion.– Legradientrevenu/sante´ observe´ a` l’aˆgeadulteposse`dedesracinesdansl’enfance,enFrance.Ame´liorerl’acce`sausyste`mede soinspourlesenfantsdemilieuxde´favorise´snesemblepassuffisantpourre´duirelesine´galite´ssocialesdesante´ entreenfants.
#2014ElsevierMassonSAS.Tousdroitsre´serve´s.
Motscle´s: Facteurssocioe´conomiques;Enfant;Anthropome´trie;Disparite´sd’acce`sauxsoins
1. Introduction
The relationshipbetween income andhealth inadulthood hasgenerated a verysubstantial literature in socialsciences, withthebroadfindingthatwealthieradultsareinbetterhealth
[1,2]. However, disentangling the causes of the relationship betweenincomeandhealthforadultsischallenging,sincethe correlationmaybeduetothreedifferent mechanisms:
incomecouldhave animpactonhealth;
healthmayhave aneffectonincome;
common hidden factors may create a spurious correlation betweenincomeandhealth.
A recent literature focuses on children and explores the relationship between household income and child health in somedeveloped countries.Byconcentratingonchildren,this literature reduces the channel that runs from health to householdincome,becausechildrendonotworkindeveloped countriesandsotheirhealthdoesnothaveagreatinfluenceon household income, on average [3]. In addition, looking at children provides some clues regarding the origins of social inequalitiesobservedinadulthood.
In an influential contribution, Case etal. (2002) establish thatfamily income is strongly associated with child general healthintheUnitedStatesandthatthisrelationshipstrengthens with child age, which means that health disadvantages accumulateover timefor children from low-income families
[3].Thereisalsoapositiveassociationbetweenfamilyincome andchildgeneralhealthinAustralia,Germany,andCanada[4– 6].Resultsforthe UKare somewhatcontradictory[7–9].
Theaimofourpaperistoaddtothisemergingliteratureon theincome/healthgradientinchildhood,byprovidingevidence fromFrance.LookingatthegradientinchildhoodforFranceis all the more relevant as health inequalities in adulthood are average or largeinFrance,but notsmall, compared toother developed countries. Indeed, using data on 22 European countries in the 1990s and early 2000s, Mackenbach et al. (2008) demonstrate that education-related inequalities in the rateofdeathareaverageinFrancecomparedtootherEuropean countries[10].Moreover,usingthe1996waveoftheEuropean Community Household Panel, Van Doorslaer and Koolman (2004)showthatFranceranks8outof13intermsof income-relatedhealthinequalities[11].Inaddition,Hernandez-Quevedo et al. (2008) use the European Community Household Panel Users’Databasefrom1994to2001tohighlightthatFranceand Portugalperformworstintheranking ofsocialinequalities in healthlimitations,among14Europeancountries[12].Usingdata onadultsover50from12developedcountries,Ju¨rges(2009) showsthatFranceranks11outof12forincome-relatedhealth
inequalities[5].1Finally,usingthe2005to2007wavesoftheEU StatisticsonIncomeandLivingConditionsdata,arecentstudy showsthatsocialinequalitiesinFranceareaverage,comparedto 19otherEuropeancountries[13].Asaconsequence,itseems relevant to investigate whether social health inequalities in adulthood have antecedents in childhood in France andhow social inequalities in childhood in France compare to other developedcountries.
However, the literature on the gradient in childhood for Franceisscarce.In2000,AnneTurszlamentedthatknowledge ontherelationshipbetweensocialenvironmentandchildhealth inFrancewaslimitedandweareundertheimpressionthatonly littleprogresshasbeenmadesincethen[14].Someinteresting resultsareworthnoticingthough:infantmortality,prematurity, and hypotrophy at birth are inversely related to the family socioeconomicstatus[15];childrenages5–6livinginpoorer areas2weremorelikelytohaveweight,dental,andspeechand languageproblems,in2000–2001[16];thefamilyincometax level and the mother’s educational level were negatively correlated withthe probabilityof overweightfor adolescents ages 12, in the Department of the Bas-Rhin in 2001 [17]; adolescents ages11 to 15living inless affluent families are more likely to be in poor general health, to have a health problem, to have been injured, and to be overweight [18]. Because the data used inthese studiesonlycontain children from specific age groups or specific regions, it is an open questionwhether theresults canbegeneralized toallFrench children.Inaddition,thesearticlesforFrancefocusonspecific health variables and it would be interesting to have a more generaldescriptionofhealthinequalitiesinchildhood,usinga largernumberofhealthvariables.Moreover,toourknowledge, theexistingliteratureforFrancedoesnotstudytheemergence andtheevolutionofthegradientoverchildhoodyears.Finally, theliteratureonFrancedoesnotlookattheroleofunmetneeds forcareintheincomegradientinhealthinchildhood,although some articles focus on this role to explain the gradient in adulthood[19].Inourpaper,wetrytoaddresstheselimitations. We provide the first econometric study on the income gradient in child health for France. We use a nationally representativesurveyforFrance,theHealth,HealthCareand Insurance Surveys.Thisdataset containschildren of all ages frombirthtoage17,fromallFrenchregions,whichenablesus togetrepresentativeresults.Inaddition,thedatacontainrich informationonseveraldimensionsofchildhealth,onaccessto healthcare,andonsupplementalinsurancecoverage.Webegin byinvestigatingwhetherthereisanassociationbetweenfamily
1
SeeTable2in[5].
2
incomeandchild generalhealth andwhether thiscorrelation increaseswithage.Wethenexaminetheroleofspecifichealth problems in the income gradient in general health. We also examinewhetherthereisanincomegradientinanthropometric measurements. Finally, we investigate the role of access to healthcare andof the typeof supplementalhealth insurance coverageintheincomegradientingeneralhealth.Theintuition isthatthecorrelationbetweenincomeandgeneralhealthcould beduetothefactthatchildrenfromlowsocioeconomicgroups are disproportionately affectedby financialand geographical barriers to access to health care [20]. Specifically, we test whether unmet needs for care and the type of supplemental health insurance coverage are mechanisms through which incomehasanimpactongeneralhealth.Asfarasweareaware, we are the first to explore these mechanisms for French children.Wheneverpossible,wecompareourresultsforFrance withthoseobtainedforotherdevelopedcountries.
Our results indicate that there is a significant association betweenfamilyincomeandchildgeneralhealthinFranceand thatthisassociationincreaseswithage.Turningtospecifichealth problems,wefindthatsomespecifichealthproblemsaremore prevalentamongchildrenfromlow-incomefamilies.Wealso showthatchildrenfromlow-incomefamiliesaremorelikelyto be shorter (conditional on their age) and to be overweight. Finally,we find that differencesin unmet needsfor care and supplementalhealthinsurancecoveragebetweenchildrenfrom low-andhigh-income familiesmay notbe important mecha-nismsunderlyingthegradientingeneralhealthinFrance.
The paper isorganized as follows. Section 2 contains the descriptionofthedataandthemethods.Section3presentsour results.Section4discussesourfindings.Section5offerssome concludingremarks.
2. Materialandmethods
2.1. Data
DatacomefromtheFrenchHealth,HealthCareandInsurance Survey(ESPS).Theexactsurveyyearsweuseare1996,1997, 1998,2000,2002, 2004,2006,2008,and2010.Thesurveyis carried out by the Institute for Research and Information in Health Economics (IRDES) and the Caisse nationale de l’assurance maladie des travailleurs salarie´s. It is a general populationsurveyofFrenchhouseholds,exceptthoselivingin overseasterritoriesorincollective housingsuchas long-term care hospitals, religious communities, and elderly people’s homes. The data are collected by a combination of phone interviews, face-to-faceinterviews, andself-completion ques-tionnaires.Thedatacontainveryrichinformationonindividuals’ backgroundand health,andthey havebeenused tostudythe determinantsofhealthinadulthood,butnotinchildhood[21,22]. Ourdefinitionofachildreferstoanindividualaged0–17, whoiseitheratschoolorwhoistooyoungtobeatschool.Note thatthisdefinitionimpliesthatminorswhoareinthelaborforce areexcludedfromoursample.Thisrestrictivedefinitionisto avoid thatminor individuals inour sample contributeto the
householdincomeandthusthattheirhealthhasanimpacton householdincome(reversecausation).
Weareable tomergechildrenwiththeirhouseholds’and parents’characteristics.Asmallshareofchildren/households is re-interviewedinsubsequent years,mostoften four years after the first interview. The data would thus enable us to estimate longitudinal models that wouldinclude child fixed effects. However, these longitudinal models imply an important decrease in the sample size, and they increase measurementerror,asdiscussedinthepreviousliterature[8]. Forthesereasons,weusepooled(i.e.repeatedcross-sectional) data.
2.1.1. Child health
We use information on the child general health, specific healthproblems,andanthropometriccharacteristics.
2.1.1.1. Child general health. We first use a child general
healthmeasurethatcomesfromthesubjectivehealthquestion: ‘‘Howis the child/yourhealth ingeneral? Very good,Good, Fair, Bad,Very bad.’’
This subjective measure offers two advantages. First, it provides a summary of the child’s general state of health. Second,thisvariablehasbeenusedinthepreviousliteratureon the gradient in childhood,in Canada,Germany, andthe US, whichenablesustodrawinternationalcomparisons[3–5].Less than4%ofchildrenareinbadorverybadhealth,whichleads ustocollapsethe‘‘fair,’’‘‘bad,’’and‘‘verybad’’categoriesinto onecategory.Consequently,ourchildgeneralhealthmeasure hasthreecategories:1=fair/bad/verybad;2=good;3=very good.Thisvariableisonlypresentinthe2004to2010wavesof the data.
2.1.1.2. Child specific health problems. To complement
general health measures, we use information on 12 specific health problems. The questions on health problems vary slightly between survey years. For example, in the 2010 survey,thequestionis:‘‘Whichdiseaseorhealthproblemdo you/doesthechildhave?’’Thefollowingbroadcategoriesof diseasesandhealthproblemsarelistedinthequestionnaire: heart, bloodcirculation problems;cancer;leukaemia; chest diseases, bronchitis; problems with nose, throat, ears; problemswitheyes;problemswithmouthandteeth;digestive problems; liver problems; problems with bones and joints; genitourinary problems; endocrine diseases; psychic pro-blems; neurological problems; skin problems; learning difficulties; andother diseases.’’In the2010questionnaire, some ofthesebroadhealthcategoriesaredividedintoeven more precisediseases.
ThechildhealthproblemswererecodedbyIRDEStomatch theInternationalClassificationofDiseases9thor10threvisions (ICD-9or10)dependingonsurveyyears.Werecodethedataso that all health problems are coded according to ICD-10. Specifically, we create a series of 12 dummy variables, that indicateswhetherthechildsuffersfromeachofthefollowing specifichealthproblems(i.e.chapters)fromthe ICD-10list:
(1)certaininfectious andparasiticdiseases; (2)endocrine,nutritionalandmetabolicdiseases; (3)mentalandbehavioraldisorders;
(4)diseasesof thenervoussystem; (5)diseasesof theeyeandadnexa;
(6)diseasesof theear andmastoidprocess; (7)diseasesof therespiratorysystem; (8)diseasesof thedigestivesystem;
(9)diseasesof theskinandsubcutaneoustissue;
(10)diseases of the musculoskeletal system and connective tissue;
(11)diseasesof thegenitourinarysystem;
(12)injury, poisoning and certain other consequences of external causes.
Notethatweonlyuse12specifichealthproblems,althoughthe ICD-10classificationcontainsmorethan12chapters,because weleaveasidehealthproblemswhicharetoorareinoursample ofchildren(andrepresentlessthan1%observations).Thestudy ofrarespecificproblemswouldrequirealargersamplesize.We alsoleaveasideICD-10chapterswhichdonotcaptureprecise health problems, as well as congenital malformations, deformations and chromosomal abnormalities, since there is noreasontobelievethatcurrenthouseholdincomecouldhave anyimpactonthesehealthproblems.
2.1.1.3. Child anthropometric measurements. We also use
children’s anthropometric data. Using the ‘‘zanthro’’ Stata function, we derive the gender- and age-adjusted weight-for-age,height-for-age,and BMI-for-age z-scores.The func-tion uses the reference data available from the 1990 British GrowthReference.Inaddition,usingthe‘‘zbmicat’’function, we create a dummy for whether the child is overweight or obese.Notethatthez-scoresarequantifiedforchildrenofall ages, but the overweight/obesity status is only defined and quantifiedforchildrenabove2.
The questions on child general health, specific health problems, and height and weight are part of a ‘‘health questionnaire’’ that is handed out to household members. Instructionsonwho shouldfillinthehealthquestionnairesfor children are notprecise. Data analysis shows that these child healthquestionnairesareeitherfilledinbythechildparents,by thechildhimself,orbyanunknownhouseholdmember(missing values).Intheincludedsamplesweuse,childhealthquestionsare morefrequentlyreportedbythechild’sparentsthanbythechild himself.Forinstance,inthe(included)sampleweusetoanalyze general health, child self-reporting of health is very low and representslessthan6%ofobservationsforchildrenlessthan10 yearsofage.Weareundertheimpressionthatthesecasescould beduetomiscodingofthedata.Forchildrenbetween10and16, althoughchildgeneralhealthisstillmorefrequentlyreportedby theparentsthanbythechildhimself,anon-negligibleshareof childrenreporttheirhealthstatusthemselves.Thisshareincreases withage:6.56%ofchildrenreporttheirownhealthstatusatage 10,versus17.37%atage12,25.76%atage14,and40.76%atage 16.Atage17,self-reportingreaches56.22%andismorefrequent than parents’ reporting. We observe the same pattern of an
increaseinchildself-reportingforthesamplesweusetostudy specifichealthproblemsandanthropometricmeasures.
2.1.2. Child unmetneedsforcare
Ourunmetneedsforcarevariablecomesfromthefollowing question:‘‘Overthelast12months,didyou/thechildnotvisita doctorornotreceivehealthcare,althoughyou/thechildneeded care(dentist, glasses...)?3’’Wecreateadummyfor whether thequestionisansweredinthepositive.Thisquestionisinthe healthquestionnairesinthe2006,2008,and2010surveysonly. ThisvariablehasalreadybeenusedinstudiesonFrenchadults, butnotonFrenchchildren[19,23].
2.1.3. Child supplementalhealthinsurancecoverage
Thedatacontainsinformationonthechildsupplementalhealth insurancecoverage.First,weuseadummyforwhetherthechildis coveredbyanysupplementalhealthinsurance.Inaddition,for childrenwhoarecoveredbyasupplementalhealthinsurance,we use information on the type of supplemental coverage. Specifically,wecreateadummyforwhetherthechildiscovered bythesupplementaluniversalhealthinsurance(‘‘CMU-C’’)orby asupplementalprivatehealthinsurance(‘‘Private’’).
2.1.4. Income
The income measure is current annual pre-tax family income.In1998,2004,2006,2008,and2010,thedatacontain eitherthe exactamountofhouseholdincome,forhouseholds whoagreetopreciselyindicatetheirincomelevel,orincomein brackets,forhouseholdswhodonotwanttoreporttheirexact income level. We first convert the exact amounts into 2011 Euros,using the FrenchNationalConsumerPrice Index.We thenusetheexactincomeamountwheneverpossibleandthe empiricalwithin-intervalaveragesotherwise.
In 1996, 1997, 2000, and 2002, the data only contains income inbrackets. After converting the brackets into 2011 Euros, we use the distribution of the exact income levels in 1998(respectively2004)tofindthewithin-intervalaveragein 1996,1997,and2000(respectively2002).
Followingthe previous literature,we use thelogarithm of income to account for the non-linearity in the relationship betweenincomeandchildhealth.
Notethatwedonotuseequivalentincomebutincomeasour main explanatory variable to match the models used in the previousliteratureonchildhealth(Caseetal.,2002).However, bothpreviousresearchandourpaperdocontrolforthefamily structure, by including the logarithm of the family size, a dummyforthepresenceofthemotherinthehousehold,anda dummy for the presence of the father in the household, as explanatoryvariables(seethelist ofcontrols below).
2.1.5. Controlvariables
The econometric models we estimate include two sets of controls(‘‘controls1’’and‘‘2’’)whichareverysimilartothe
3
InFrench,thequestionisthefollowing:‘‘Aucoursdes12derniersmois, avez-vousrenonce´ [pourcetenfant]a` voirunme´decinoua` dessoinsme´dicaux dontvousaviez[ilavait]besoin(dentiste,lunettes...)?’’
onesusedinthepreviousliterature,toenableustocomparethe gradientbetweencountries(Caseetal.,2002,for theUS[3]; CurrieandStabile,2003,forCanada[4];Khanametal.,2009, for Australia [6]; Reinhold and Ju¨rges, 2012, for Germany
[24]). The controls used in these published articles are not exactlysimilar,butthedifferencesbetweenthemareminimal. Thefirstsetofcontrols(‘‘controls1’’)generallycontainschild agedummies, childgender, the logarithm of householdsize, dummies for the presence of the mother and father in the household,theageofthemotherandthefatherinteractedwith theirpresence,andtimedummies,whereasthe secondsetof controls(‘‘controls2’’)includesthefirstsetplusthemotherand thefathereducationallevelandemploymentstatus,interacted withtheirpresenceinthe household.
Wealsousethesetwosetsofcontrols,butwealsoincludea control for the identity of the respondent tothe child health questionnaire,toaccountforpotentialdifferencesinreporting styles between parents and children. Specifically, the child healthquestionnairecanbefilledinbytheparents,thechild,or by an unknown household member. In our econometrics models, we thus include a dummy for whether the child answeredthechildhealthquestionnairehimselfandadummy forwhether the identityof therespondent tothe child health questionnaireisunknown/missing.Thereferenceisthedummy indicating that the parents answered the child health questionnaire.
The definitions andsummary statisticsof the variables of interestaregiveninTable1.
2.1.6. Missingvalues
Observations with missing values on explained health variablesandonincomearedroppedfromoursample,because wecannot/donotwanttomakeanyimputationonthesevariables of interest. In addition, observations with missing values on controlvariablesaregenerallydroppedfromoursample,since they represent very few observations. However, the control variablethatcontainstheidentityofthehouseholdmemberwho answeredthechildhealthquestionnairehasalargenumberof missingvalues.Wedonotwanttodroptheseobservationswith missingvalues,sincethiswouldgreatlyreduceoursamplesize. We thus create a dummy indicating that the identity of the respondenttothechildhealthquestionnaireismissing/unknown. Weare left witha sample of 12,732 observations for the analysisofgeneralhealth,23,862forspecifichealthproblems, 21,425foranthropometricmeasures,9,098forunmetneedsfor care,and12,696for supplementalhealthinsurance.
2.2. Methods
Weuse econometric techniquesto explorethe gradient in childhood. First, we examine the relationship between the logarithmoffamilyincomeandchildgeneralhealth.Wefollow theeconometricstrategyusedintheearlierliterature,tobeable to compare our results with those for other countries. Specifically,weregresschildgeneral healthonthe logarithm ofincome,controllingeitherfor‘‘controls1’’or‘‘controls2,’’ using orderedprobitmodels.Weestimate the modelsfor the
Table1
Descriptionofthesample.
Variablesofinterest Percent/Mean
Childgeneralhealth
Generalhealth
1=verybad/bad/fair 4.31%
2=good 35.83%
3=verygood 59.87%
Childspecifichealthproblems
(1)Infectious
Dummyforcertaininfectiousandparasiticdiseases 1.82% (2)Endocrine
Dummyforendocrine,nutritionalandmetabolic diseases
5.27%
(3)Mental
Dummyformentalandbehavioraldisorders 2.45% (4)Nervous
Dummyfordiseasesofthenervoussystem 2.17% (5)Eye
Dummyfordiseasesoftheeyeandadnexa 21.32% (6)Ear
Dummyfordiseasesoftheearandmastoidprocess 5.14% (7)Respiratory
Dummyfordiseasesoftherespiratorysystem 20.37% (8)Digestive
Dummyfordiseasesofthedigestivesystem 17.73% (9)Skin
Dummyfordiseasesoftheskinandsubcutaneous tissue
10.13%
(10)Musculoskeletal
Dummyfordiseasesofthemusculoskeletalsystem andconnectivetissue
2.71%
(11)Genitourinary
Dummyfordiseasesofthegenitourinarysystem 1.23% (12)Injury
Dummyforinjury,poisoningandcertainother consequencesofexternalcauses
1.91% Anthropometricmeasurements Weight-for-age Weight-for-agez-score 0.099 Height-for-age Height-for-agez-score 0.203 BMI-for-age BMI-for-agez-score 0.032 Overweightorobese
Dummyforwhetherthechildisoverweightorobese (forchildrenabove2only)
15.0%
Accesstohealthcare
Unmetneedsforcare
Dummyforwhetherthechilddidnotvisitadoctor althoughheneededcare
3.93%
Supplementalhealthcarecoverage
Anysupplementalcoverage
Dummyforwhetherthechildhasanysupplemental healthinsurancecoverage
95.64%
CMU-C
Dummyforwhetherthechildiscoveredbythe universalsupplementalhealthinsurancecoverage
12.83%
Private
Dummyforwhetherthechildiscoveredbya supplementalprivatehealthinsurance
82.82%
Familyincome
Ln(income)
wholesample of children ages 0–17, but also separately for children of different age groups (0–3, 4–8, 9–12,13–17), to assesstheevolution ofthegradient withage.
Second,wefocusontheroleofspecifichealthproblemsin thegradientingeneralhealth.AccordingtoCaseetal.(2002), theincome gradientin generalhealthmay reflectthegreater prevalence of specifichealth problems among children from low-income families.We examinewhether the prevalence of specifichealthproblemsisgreateramonglow-incomechildren, byregressingthedummiesforspecifichealthproblemsonthe logarithmofincomeandcontrols.Thesemodelsareestimated usingordinaryleastsquares(OLS,linear probabilitymodels) andincluding‘‘controls2’’.
Third, toestimate the correlation between family income andanthropometricmeasures,weregressthechild weight-for-age,height-for-age,andBMI-for-agez-scores,andoverweight statusonthelogarithmofincomeandcontrols.Thesemodels areestimatedusingOLSandincluding‘‘controls2’’.
Finally,weinvestigatetherolesofunmetneedsforcareandof supplementalhealthinsurancecoverageintheincomegradient in general health. We proceed in two steps. First, we check whetherincome is correlated with unmet needs for care and supplementalcoverage,usingOLS.Second,wetestwhetherthe useof unmetneeds(respectively supplemental coverage)isa mechanismunderlyingtheincomegradientingeneralhealth,by comparingthecorrelationbetweenincomeandgeneralhealth,in the absence of any control for unmet needs (respectively supplementalcoverage), with thecorrelation betweenincome and general health, when the control for unmet needs (respectivelysupplementalcoverage)isincluded.4Thesemodels areestimatedusingorderedprobitandincluding‘‘controls2.’’
3. Results
3.1. Firstdescriptionofthe incomegradientingeneral health
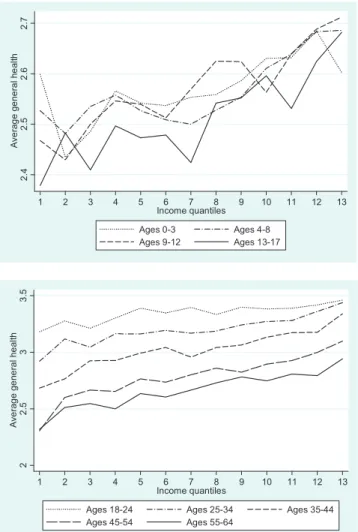
We first present descriptive evidence on the relationship betweenfamilyincomeandchildgeneralhealth,intheabsence ofanycontrol.Weusefourchildagegroups,liketheprevious literature(childrenages0–3,4–8,9–12,and13–17)toexamine theevolutionoftheincomegradientbetweenagegroups.The topsubfigureinFig.1showsthechildaveragegeneralhealthas afunctionofincomequantiles,foreachagegroup.Weuse13 income quantilesbecause there are 13income brackets. The subfigurehighlightsthatthehealthofolderchildrenispoorer thanthatof youngerchildren.Statistical tests(whichare not reported)showthatthegeneralhealthofchildrenages13–17is
significantlyworsethanthatofchildrenages0–3,4–8,and9– 12.Thesubfigurealsoshowsthatasincomeincreases,general healthimproves.Finally,thesubfigureprovidessomeevidence that the curves become steeper with child age. This strengthening of the income gradient between age groups is supportedbystatisticaltests(notreported),whichhighlightthat thecorrelationbetweenincomequantilesandgeneralhealthfor children ages9–12and13–17 is significantlylarger thanfor childrenages0–3,when nocontrolisincluded.
Toexplorewhetherthiswidening ofthe gradient between age groupscontinues inadulthood, we graph the correlation betweenhouseholdincomeandgeneralhealthforadults,inthe bottom subfigure of Fig. 1. The subjectivehealth variable is nowcodedfrom1forverybad/badhealthto4forvery good health.Ourgraphsuggeststhatthehealthofolderindividualsis poorer thanthatof youngerones.5 The subfigurealso shows largesocialinequalities, sinceyoung adultsages25–34from
2. 4 2. 5 2. 6 2. 7 A v e rag e ge ne ra l he al th 1 2 3 4 5 6 7 8 9 10 11 12 13 Income quantiles Ages 0-3 Ages 4-8 Ages 9-12 Ages 13-17 2 2. 5 3 3. 5 Av e rag e ge n e ra l he al th 1 2 3 4 5 6 7 8 9 10 11 12 13 Income quantiles
Ages 18-24 Ages 25-34 Ages 35-44 Ages 45-54 Ages 55-64
Fig.1. Relationshipbetweenhouseholdincomequantilesandgeneralhealth, byagegroup.Thefiguresshowaveragesubjectivehealthbywithin-bracket householdincomequantiles.
4
Weestimateastaticmodelinwhichgeneralhealthatdatetisregressedon incomeattandunmetneedsforcareatt.Adynamicmodelthatwouldregress generalhealthatdatetonincomeattandunmetneedsforcareatt-4wouldbe better,butourdatadoesnotallowtogetreliableestimatesforthisdynamic model.Indeed,thenumberofchildrenwithunmetneedsforcareissmallin cross-sections,anditwouldbeevensmallerinthelongitudinalsampleusedfor thedynamicmodels(sampleofchildrenwhoarefollowedovertime).This wouldleadtounreliableestimatesinthedynamicmodel.
5
ThisfindingsupportspreviousresultsbyVanKippersluisetal.(2009)for Frenchmalesandfemalesages20to70yearsold[25].Findingsforadultsfrom othercountriesalsoshowthesamepattern[25,26].
thelowestincomecategory(firstquantile)reportthesamelevel ofsubjectivehealthas oldadultsages55–64 fromthehigher incomecategory(13thquantile).Statisticaltests(notreported) showthatthe slopesofthe curvesforindividualsages18–24 and 25–34 are significantly smaller than thatfor individuals ages 35–44. Afterwards, the slopes of the gradients remain constant,forindividualsages35–44,45–49,50–54,and55–65.
3.2. Theincomegradientinchildgeneralhealth
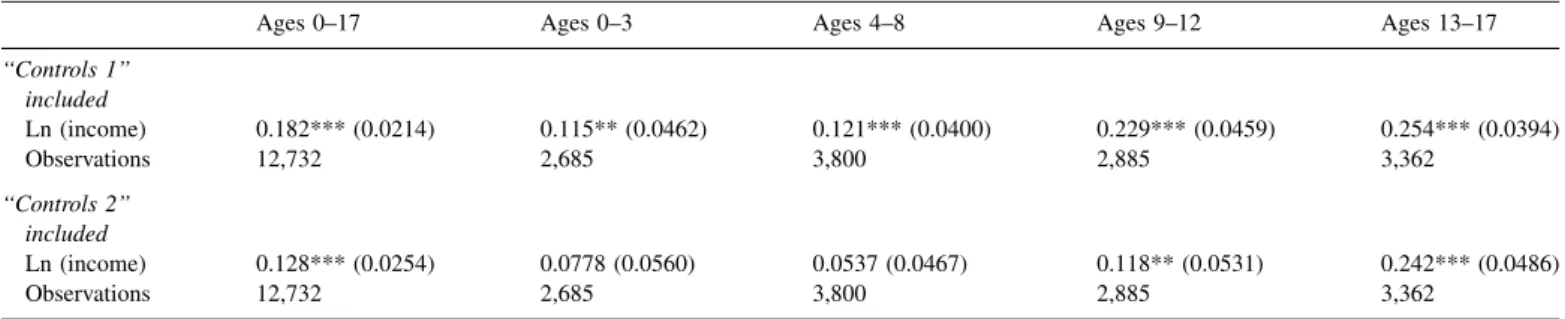
Theestimatesoftheorderedprobitmodelsforchildgeneral healthare presented inTable 2. Wefirst focus on the whole sampleofchildrenages0–17.When‘‘controls1’’areincluded, wefindapositiveandsignificantassociationbetweenincome and child general health. The 0.182 coefficient on income impliesthatanincreaseinincomefromthe25thpercentileto the 75thpercentile isassociated witha 4.1percentage point increaseintheprobabilitythatthechildisinverygoodgeneral health, fromaprobability of 0.580toaprobabilityof 0.621. When ‘‘controls 2’’ are included, the coefficient on income decreases to 0.123 but remains significant. This coefficient impliesthatanincreaseinincomefromthe25thpercentileto the 75thpercentile isassociated witha 2.9percentage point increaseintheprobabilitythatthechildisinverygoodgeneral health,fromaprobabilityof 0.586toaprobabilityof0.615.
Wenowturn totheevolution ofthe gradientbetweenage groups.Table2providesevidencethatthegradientforchildren ages0–3issimilartothegradientforchildrenages4–8,butthat thegradientislargerforchildrenages9–12and13–17thanfor childrenages0–8,forbothsetsof controls.
Wecanidentifytheagegroupforwhichthegradientstarts strengthening, using more precise age groups [9]. We first createanumberofchild agegroups:childrenages0–3,1–4, 2–5... and 14–17. These age groups overlap to smooth our estimates.Wethenestimateaseriesoforderedprobitmodels for child health as a function of the logarithm of income, including‘‘controls2,’’foreachoftheseagegroupsseparately.
Fig.2graphsthecoefficientsonthelogarithmofincomeasa function of age groups. The figure suggests that the income gradientingeneralhealthmaybelargerforchildrenabove12 yearsof age.
TheestimatespresentedinTable2andFig.2usethesample of individuals for whichgeneral health, income, and all the
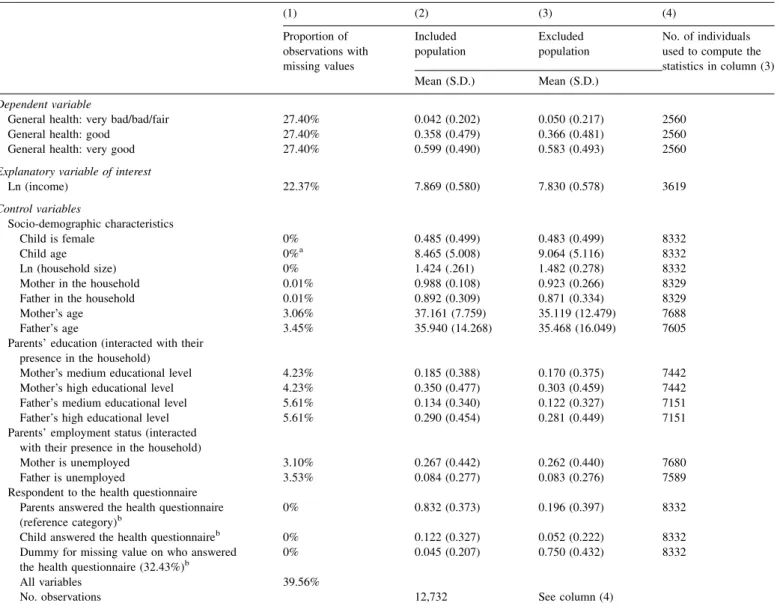
controls are non-missing. This sample is the included population. In contrast, 39.56% of children in our sample havemissinginformationfor atleastoneof thevariableswe use,andare droppedfromthe analysis.Theseindividualsare the excluded population. Table 3, column (1), reports the percentage of missing data for each variable. This column highlights that the percentage of individuals with missing valuesongeneral healthandincome islarge.In contrast,the shareofindividualswithmissingvaluesonthecontrolvariables issmall.Theoneexceptionistheidentityoftherespondentto the childhealthquestionnaire,whichisunknown/missingfor 32.43% of observations, and for which we use a dummy capturingthemissingvalues.
To examine whether the results presentedin Table 2 and
Fig.2(usingtheincludedpopulation)canbegeneralizedtothe whole French population, Table 3 also reports the mean characteristics of the included and excluded populations in columns(2)and(3).Notethatthemeancharacteristicsforthe excluded population in column (3) are obviously computed usingtheobservationsfromtheexcludedpopulationforwhich the characteristics are non-missing.The number of observa-tionsthatweuseisgivenincolumn(4).Columns(2)and(3) suggest that the mean characteristics of the included and excluded population are rather similar, so that the results
Table2
Familyincomeandchildgeneralhealth(orderedprobitmodels).
Ages0–17 Ages0–3 Ages4–8 Ages9–12 Ages13–17
‘‘Controls1’’ included Ln(income) 0.182***(0.0214) 0.115**(0.0462) 0.121***(0.0400) 0.229***(0.0459) 0.254***(0.0394) Observations 12,732 2,685 3,800 2,885 3,362 ‘‘Controls2’’ included Ln(income) 0.128***(0.0254) 0.0778(0.0560) 0.0537(0.0467) 0.118**(0.0531) 0.242***(0.0486) Observations 12,732 2,685 3,800 2,885 3,362
Thedependentvariableischildgeneralhealth,codedfrom‘‘1=fair/bad/verybad’’to‘‘3=verygood’’. Robuststandarderrorsinparentheses.***P<0.01,**P<0.05,*P<0.1.
-. 1 0 .1 .2 .3 .4 C o e ff ic ien t on l n (i n c om e ) 0-3 1-4 2-5 3-6 4-7 5-8 6-9 7-1 0 8-1 1 9-1 2 10 -13 11 -14 12 -15 13 -16 14 -17 Child age Coefficient 90% CI
Fig.2. Coefficientonthelogarithmofincome,withchildage.Inthe regres-sions,thedependentvariableischildgeneral health.Errorbarsshow90% confidenceintervals.‘‘Controls2’’areincluded.
presentedonthegradientingeneralhealthinTable2andFig.2
may be true for the whole French population. Note that as expectedthepercentageofmissingvaluesontheidentityofthe respondenttothehealthquestionnaireislargerintheexcluded populationthaninthe includedpopulation.
3.3. Prevalenceofspecifichealth problems
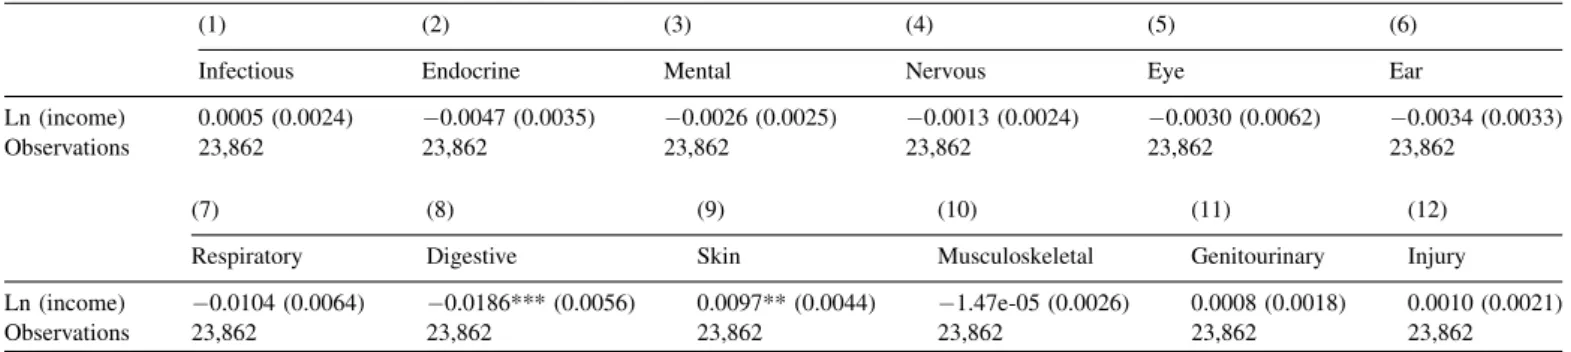
Table 4 reports the results for the prevalence of specific healthproblems.Inthefirstcolumn,weregressthepresenceof aninfectiousproblemonthelogarithmofincomeand‘‘controls 2’’. The following columns report the results for the other specifichealthproblems.Wefindthatthecorrelationbetween
incomeandspecifichealthproblemsisgenerallyinsignificant. However,childrenfromlow-incomefamiliesaresignificantly morelikelytohavedigestiveproblemsthanchildrenfrom high-incomefamilies.Thegreaterprevalenceofdigestiveproblems forchildrenfromlow-incomefamiliesmayberelatedtotheir greaterBMI-for-age(Section3.4).Thetablealsosuggeststhat children from high-income families are significantly more likelytohaveskinproblems.
3.4. Thegradientinanthropometricmeasures
To complement our analysis on child general health, we examine the income gradient in anthropometric measures.
Table3
Proportionofmissingdataandcharacteristicsoftheincludedandexcludedpopulations.
(1) (2) (3) (4) Proportionof observationswith missingvalues Included population Excluded population No.ofindividuals usedtocomputethe statisticsincolumn(3)
Mean(S.D.) Mean(S.D.)
Dependentvariable
Generalhealth:verybad/bad/fair 27.40% 0.042(0.202) 0.050(0.217) 2560
Generalhealth:good 27.40% 0.358(0.479) 0.366(0.481) 2560
Generalhealth:verygood 27.40% 0.599(0.490) 0.583(0.493) 2560
Explanatoryvariableofinterest
Ln(income) 22.37% 7.869(0.580) 7.830(0.578) 3619 Controlvariables Socio-demographiccharacteristics Childisfemale 0% 0.485(0.499) 0.483(0.499) 8332 Childage 0%a 8.465(5.008) 9.064(5.116) 8332 Ln(householdsize) 0% 1.424(.261) 1.482(0.278) 8332
Motherinthehousehold 0.01% 0.988(0.108) 0.923(0.266) 8329
Fatherinthehousehold 0.01% 0.892(0.309) 0.871(0.334) 8329
Mother’sage 3.06% 37.161(7.759) 35.119(12.479) 7688
Father’sage 3.45% 35.940(14.268) 35.468(16.049) 7605
Parents’education(interactedwiththeir presenceinthehousehold)
Mother’smediumeducationallevel 4.23% 0.185(0.388) 0.170(0.375) 7442
Mother’shigheducationallevel 4.23% 0.350(0.477) 0.303(0.459) 7442
Father’smediumeducationallevel 5.61% 0.134(0.340) 0.122(0.327) 7151
Father’shigheducationallevel 5.61% 0.290(0.454) 0.281(0.449) 7151
Parents’employmentstatus(interacted withtheirpresenceinthehousehold)
Motherisunemployed 3.10% 0.267(0.442) 0.262(0.440) 7680
Fatherisunemployed 3.53% 0.084(0.277) 0.083(0.276) 7589
Respondenttothehealthquestionnaire Parentsansweredthehealthquestionnaire (referencecategory)b
0% 0.832(0.373) 0.196(0.397) 8332
Childansweredthehealthquestionnaireb 0% 0.122(0.327) 0.052(0.222) 8332
Dummyformissingvalueonwhoanswered thehealthquestionnaire(32.43%)b
0% 0.045(0.207) 0.750(0.432) 8332
Allvariables 39.56%
No.observations 12,732 Seecolumn(4)
Column(2)containsthemeancharacteristicsoftheincludedpopulation.Theincludedpopulationisthepopulationthatisusedintheeconometricmodelsusedin
Table2andFig.2,i.e.individualsbetween0and17yearsofage,whogotoschooloraretooyoungtogotoschool,between2004and2010.
Column(3)givesthecharacteristicsoftheexcludedpopulation,thatistosaythepopulationforwhichthereisatleastonevariablewithamissingvalue.Column(3) reportsthecharacteristicsofthisexcludedpopulation,thatarecomputedusingthenon-missingobservations.Column(4)containsthenumberofobservationsthat wereusedtocalculatethemeansincolumn(3).
aChildageisnevermissing,sincebeingbetween0and17isaconditionforbeingintheoriginalsample.
b Informationonwhoansweredthehealthquestionnaireofthechildismissingfor32.43%ofobservations.Wecreateadummyindicatingthatthispieceof
Table 5 reports the results. We find that income is not significantly correlated with weight-for-age but that it is positively and significantly correlated with height-for-age. Becausechildrenfromlow-incomefamiliesare(significantly) shorterthan children from high-incomefamilies, but are not (significantly)thinner,BMI-for-ageis(significantly)greaterfor childrenfromlow-incomefamiliesthanforchildrenfrom high-incomefamilies.Similarly,theprobabilityofbeingoverweight/ obese is significantly higher among low-income children. Incomeinequalitiesinoverweight/obesityarelikelytoplaya roleintheincomegradientingeneralhealththatishighlighted above.
3.5. Therolesofunmetneedsforcareand supplemental
healthinsurancecoverage
Wefinally examine the role of unmet needs for care and supplemental health insurance coverage in the gradient in generalhealth.
We first explore the impact of income on having unmet needs for care and having supplemental health insurance coverage.Resultsofregressionsofunmetneedsandinsurance coverageon income (andcontrols) are presented inTable 6, columns(1)and(2).Wefindthatthereisalargeandsignificant correlation between income and unmet needs for care, and betweenincomeandanysupplementalhealthinsurance.
We then explore whether unmet needs for care and supplementalcoveragearemechanismsthroughwhichincome hasanimpactongeneralhealth.Were-estimatethebasicmodel for childgeneral health,controllingfor unmet needsfor care (respectivelysupplementalinsurance).Ifunmetneedsforcare (respectivelysupplementalinsurancecoverage)isanimportant mechanism throughwhichincome has an impact on general health, then the coefficient on income will dramatically decreasewhentheunmetneedsforcarevariable(respectively thesupplementalcoveragevariable)isincludedinthe model. The results are presented in Table 6, columns (3)-(6). In column(3),weestimatethegradient,notcontrollingforunmet needsfor care,forthe sampleof childrenfor whomwe have informationonunmetneedsforcare.Asexpected,thesizeof thegradientisverysimilartothatinTable2,when‘‘controls2’’ areincluded.Incolumn(4),weincludethecontrolforunmet needs. We observe that the coefficient on income is almost unaffected by this inclusion, which may imply that having unmet needsfor careisnotanimportant mechanismthrough whichincomehasanimpactonchildgeneralhealth.However, unmet needs for care do have a large and significant independent effectonchildgeneralhealth.
Similarly,columns(5)and(6)revealthatcontrollingforthe typeofhealthinsurancecoverageonlyslightlyaffectsthesize of the coefficientonincome. Thisresultcould meanthatthe type of insurance coverage is not an important mechanism underlyingthe incomegradientingeneralhealth.
Table5
Correlationbetweenparentalincomeandchildanthropometricmeasures(OLS).
(1) (2) (3) (4)
Weight-for-age Height-for-age BMI-for-age Overweightorobese
Ln(income) 0.0172(0.0197) 0.0832***(0.0231) 0.0444**(0.0214) 0.0152**(0.0060)
Observations 21,425 21,425 21,425 19,925
Incolumn(4),thesamplecontainschildrenabove2only. ‘‘Controls2’’areincluded.
Robuststandarderrorsinparentheses.***P<0.01,**P<0.05,*P<0.1. OLS:ordinaryleastsquares.
Table4
Prevalenceofspecifichealthproblems(OLS).
(1) (2) (3) (4) (5) (6)
Infectious Endocrine Mental Nervous Eye Ear
Ln(income) 0.0005(0.0024) 0.0047(0.0035) 0.0026(0.0025) 0.0013(0.0024) 0.0030(0.0062) 0.0034(0.0033)
Observations 23,862 23,862 23,862 23,862 23,862 23,862
(7) (8) (9) (10) (11) (12)
Respiratory Digestive Skin Musculoskeletal Genitourinary Injury
Ln(income) 0.0104(0.0064) 0.0186***(0.0056) 0.0097**(0.0044) 1.47e-05(0.0026) 0.0008(0.0018) 0.0010(0.0021)
Observations 23,862 23,862 23,862 23,862 23,862 23,862
Column(1)reportstheresultsofthemodelinwhichadummyforinfectiousproblemsisregressedonthelogarithmofincomeand‘‘controls2’’.Thefollowing columnscontaintheresultsfortheotherspecifichealthproblems.
‘‘Controls2’’areincluded.
Robuststandarderrorsinparentheses.***P<0.01,**P<0.05,*P<0.1. OLS:ordinaryleastsquares;CMU-C:supplementaluniversalhealthinsurance.
Note that the coefficient on CMU-C in column (6) is negativeandsignificant,whichdoesnotmeanthatCMU-Chas anegative impact onhealth, but thatamong peoplewho are eligibletoCMU-C,onlythosewhoareinpoorhealthactually getsCMU-C.Thisindicates thatour lastmodelsuffers from reverse causation. Additional research that addresses this reversecausationissueisthusneeded.
4. Discussion
This paper investigates the relationship between family incomeandchildhealthinFrance.Weusealargesample of children ages 0 to 17 to examine the correlation between income, child general health, specific health problems, anthropometric measurements, unmet needs for care, and supplementalinsurancecoverage.
Our article finds a positive and significant association betweenfamilyincomeandchildgeneralhealthinFrance. In addition, there is some evidence that the gradient increases betweenchildagegroups, although largerdatasetsofFrench childrenarerequiredtogetdefiniteconclusionsonthismatter. As a consequence, universal health insurance coverage and high levels of use of health care services in France do not eliminatethegradientinchildhood.
Ourfindingonthepositiveassociationbetweenincomeand child general health in France is consistent with previous findingsfor Canada,Germany,and the UK,whichalso have significant income gradients in spite of universal or near universalaccesstohealthcaresystems[5,24,25].
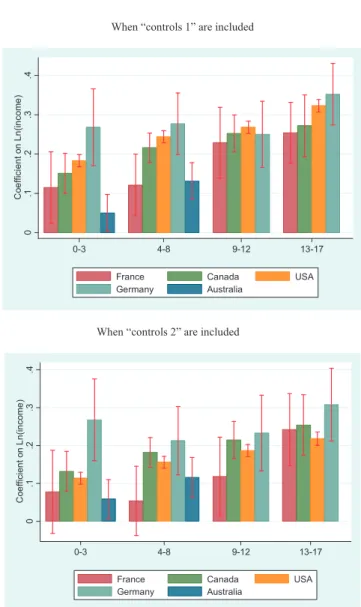
To comparethe slope of the gradient ingeneral healthin France with other developed countries, Fig. 3 reports the coefficientsonthelogarithmofincomefromthechildgeneral health models, for France (from our estimates presented in
Table2),Australia[6],Canada[4],Germany[24],andtheUS
[3].The econometric modelsand thelist of controls thatare usedinourpaperandinthesearticlesaresimilar,whichmakes internationalcomparisonspossible.Overall,wefindthatforall age groups the gradient is smaller in France than in other countries,butpointestimatesarenotsignificantlydifferentin
Table6
Parentalincome,childunmetneedsforcare,andsupplementalhealthinsurancecoverage.
(1) (2) (3) (4) (5) (6)
Dependentvariable Unmetneeds
forcare
Anysupplemental coverage
Generalhealth Generalhealth Generalhealth Generalhealth
Model OLS OLS OrderedProbit Orderedprobit Orderedprobit Orderedprobit
Ln(income) 0.0205***(0.0056) 0.0219***(0.0050) 0.144***(0.0335) 0.137***(0.0335) 0.130***(0.0254) 0.113***(0.0259)
Unmetneedsforcare 0.340***(0.0672)
Supplementalhealthcoverage
Private 0.0109(0.0552)
CMU-C 0.124*(0.0642)
Observations 9,098 12,696 9,098 9,098 12,696 12,696
‘‘Controls2’’areincluded.
Robuststandarderrorsinparentheses.***P<0.01,**P<0.05,*P<0.1. OLS:ordinaryleastsquares.
When “controls 1” are included
d e d u l c n i e r a ” 2 s l o r t n o c “ n e h W 0 .1 .2 .3 .4 C oe ff ic ien t on L n (i n c om e ) 0-3 4-8 9-12 13-17
France Canada USA Germany Australia
0 .1 .2 .3 .4 C oe ff ic ie n t on L n (i n c om e ) 0-3 4-8 9-12 13-17 France Canada USA Germany Australia
Fig.3. EvolutionofthegradientwithageinFranceandinotherdeveloped countries.EstimatesforAustraliaareonlyavailableforchildrenlessthan8 yearsofage.Errorbarsshow95%confidenceintervals.
FrancethaninAustralia,Canada,Germany,andtheUS.Note thattheconfidenceintervalsforFranceandGermanyarelarge, duetorelativelysmallsample sizes.
In further analyses, our article turns to specific health problems,andexplorewhethertheyaremoreprevalentamong childrenfromlow-incomefamilies.Wefindthatchildrenfrom low-income families are significantly more likely to get digestiveproblems.However,the correlationbetweenincome andmostspecifichealthproblemsisinsignificant.Apotential explanationforthisresult,thatfutureresearchcouldfocuson, isthattheincomegradientinthesespecifichealthproblemsis underestimateddue todifferences in doctor consultation and screening between children from low- and high-income families. These differences may in particular explain the absence of income gradient in (1) certain infectious and parasitic diseases, (2) endocrine, nutritional and metabolic diseases, and (12) injury, poisoning and certain other consequences of external causes. Similarly, our findings indicate thatchildren from high-income families are signifi-cantly more likely to have skin problems. Again, these differencesmaysimplybeduetothegreaterprobabilitytovisit a doctor and to be diagnosed with skin conditions in high-incomefamilies.
The last set of results suggests a significant correlation betweenincomeontheonehand,andunmetneedsforcareand anysupplementalhealthinsuranceontheotherhand.Sounmet needs for care and supplemental insurance do have an independenteffectonchildhealth.Theseresultsareconsistent withfindingsforadults[19].Butourresultsalsoindicatethat unmet needsfor care andsupplemental healthcoveragemay notbeimportantmechanismsexplainingtheincomegradientin generalhealthinchildhood.However,ourvariablesonthetype ofinsurance (whichare dummiesforCMU-Candforprivate supplementalinsurance)maynotbepreciseenoughtocapture theroleofsupplementalinsurance.Thekindofsupplemental insurancemayalsomatter,sinceitcouldhaveanimpactonthe quality of care. More precise information on the kind of supplementalcoveragewouldthusbenecessarytoinvestigate this point further. Note that in spite of this limitation, our findings for France are consistent withprevious findings for othercountries,thatalsohighlightthataccesstohealthcareis probablynotamajormechanismunderlyinghealthinequalities
[9,20].Thisfindingimpliesthatimprovingaccesstohealthcare andinsurancecoveragemaynotbeenoughtodecrease income-relatedinequalitiesinhealthbetweenchildren.
Ourresultsontheincomegradientinchildgeneralhealthare subject to some data limitations. Indeed, the child general healthissubjectiverather thanobjective.Respondentstothe child health questions may use response scales in different manners, depending on their expectations regarding child health and on the household socio-economic characteristics. Consequently,thechildsubjectivehealthmaynotcorrespondto his objective/clinical health in the same way for different socioeconomicgroups.Ifthereportingbiasinthechildhealth variablesdependson householdincome, ourestimatesof the incomegradientwillbebiased.Biasesinself-reportedhealth havealreadybeenhighlightedforadults[27–29],andtheuseof
self-ratedhealthcanleadtoanunderestimationofsocialhealth inequalities for them [27,30]. As such, the literature recommends to be cautious when using self-rated health to quantifyinequalitiesforadults.Somepreviousstudiessupport the use of anchoring vignettes to account for differences in reporting styles [31]. Similarly, the use of subjective health could also create a bias in the measurement of the income/ healthgradientforchildren,andsocautionisalsoneeded.Note howeverthatthepreviousliteratureonthegradientinchildhood alsousessubjectivechildhealthvariables,likewedo,duetothe lackofdataonobjectivehealthforasufficientlylargenumber of children.
The representativeness of our results may also be questioned: indeed, a largenumber of children are excluded fromoursample,becausethesechildren(ortheirparents)did notcompletethesurveyquestionsthatweuseinthisarticle,and becausewechosetomakenoimputationformissingvalues(for incomeinparticular).However,descriptivestatisticsprovided inTable3showthattheincludedandexcludedpopulations(for the sample we use to examine general health) have rather similarcharacteristics.Asaconsequence,weareconfidentthat theresultsonthegradientingeneralhealthdonotonlyholdfor averyspecificgroupofchildren,but couldbegeneralized.
Finally, our study on the gradient in childhood is not prospective and does not establish causality running from parentalincometochildhealth,butonlycorrelationsbetween thevariablesofinterest.Futureresearchmightbeinterestedin testing whether this correlation represents causality running fromhouseholdincometochildhealth,asopposedtoreverse causationortheomissionofthirdfactors.Notethatthesepoints havebeeninvestigatedfor theUKandtheUS,forwhichrich data on the impact of child health on parental income are available,withthebroadfindingthatthe correlationprobably representscausality fromincometochildhealth[3,9]. 5. Conclusion
Additional research is needed to better understand the correlation between household income and child health. It would seem important to explore several mechanisms that couldexplainthecorrelation(orthecausalimpact)ofparental incomeonchildhealth.Previousresearchhasalreadyexplored whether nutrition and housing conditions are mechanisms through which income has an impact on child health [7,9]. However, these mechanisms need re-assessing with more detaileddataon dietandlivingconditions. Knowledgeabout the roles of nutrition and housing conditions will certainly improvetheimplementationofpoliciespromotingchildhealth. This objective is all the more important as poor health in childhoodisnotonlyrelatedtolowerchild well-beinginthe short run, but also to future educational and labor market outcomesinthe longrun[32].
Disclosure ofinterest
The authors declare thattheyhaveno conflictsof interest concerningthisarticle.
Acknowledgements
Data from the ESPS were supplied by the Institut de rechercheetdocumentationene´conomiedelasante´ (IRDES). Theauthorstake responsibilityforthe integrityof thiswork. The authors would liketo thank an anonymous referee, the editor, Emmanuelle Cambois, Kwabena Gyimah-Brempong, Stacey Gelsheimer, Natallia Gray, Florence Jusot, Robyn Kibler, Michelle Lieven, Andreas Mu¨ller, Serge Paugam, GabrielPicone,PhillipPorter,SandyTubeuf,andparticipants totheWorkshoponSocialHealthInequalitiesatParisSchoolof EconomicsinJune2013,fortheirconstructivecomments. References
[1]MarmotM,BobakM.Internationalcomparatorsandpovertyandhealthin Europe.BrMedJ2000;321:1124–8.
[2]WinklebyMA,JatulisDE,FrankE,FortmannSP.Socioeconomicstatusand health:howeducation,income,andoccupationcontributetoriskfactorsfor cardiovasculardisease.AmJPublicHealth1992;82(6):816–20.
[3]CaseA,LubotskyD,PaxsonC.Economicstatusandhealthinchildhood: theoriginsofthegradient.AmEconRev2002;92(5):1308–34.
[4]CurrieJ,StabileM.Socioeconomicstatusandchildhealth:whyisthe relationshipstrongerforolderchildren?AmEconRev2003;93(5):1813–23.
[5]Ju¨rgesH.Healthinequalitiesbyeducation,incomeandwealth:a compari-sonof11EuropeancountriesandtheUS.ApplEconLett2009;17(1):87–91.
[6]Khanam R,Nghiem HS,Connelly LB. Childhealth and the income gradient:evidencefromAustralia.JHealthEcon2009;28(4):805–17.
[7]CurrieA,ShieldsMA,PriceSW.Thechildhealth/familyincomegradient: evidencefromEngland.JHealthEcon2007;26(2):213–32.
[8]PropperC,RiggJ,BurgessS.Childhealth:evidenceontherolesoffamily incomeandmaternalmentalhealthfromaUKbirthcohort.HealthEcon 2007;16(11):1245–69.
[9]ApoueyB,GeoffardP-Y.FamilyincomeandchildhealthintheUK.J HealthEcon2013;22(4):715–27.
[10]Mackenbach JP, Stirbu I, Roskam A-JR, Schaap MM, Menvielle G, LeinsaluM,etal.Socioeconomicinequalitiesinhealthin22European countries.NEnglJMed2008;358(23):2468–81.
[11]Van DoorslaerE, Koolman X.Explainingthedifferences in income-related health inequalities across European countries. Health Econ 2004;13(7):609–28.
[12]Hernandez-QuevedoC,JonesAM,Lopez-NicolasA,RiceN. Socioeco-nomic inequalities in health:a longitudinalanalysisof theEuropean CommunityHouseholdPanel.SocSciMed2008;27(6):1246–61.
[13]Herna´ndez-QuevedoC,MasseriaC,MossialosE.Analysingthe socio-economicdeterminantsofhealthinEurope:newevidencefromEU-SILC. Luxembourg: Eurostat methodologies and working papers, European Union;2010:1–38.
[14]TurszA.Lasante´ del’enfant. In:FassinD,GrandjeanH,KaminskiduM, editors.Lesine´galite´ssocialesdesante´.Paris:LaDe´couverte,Recherches; 2000.p.193–206.
[15] KaminskiM,Saurel-CubizollesM-J.Lasante´ pe´rinatale. In:FassinD, GrandjeanH,KaminskiM,editors.Lesine´galite´ssocialesdesante´.Paris: LaDe´couverte,Recherches;2000.p.173–92.
[16] GuignonN,Bade´yanG.Lasante´ desenfantsde6ansa` traverslesbilans desante´ scolaire.DREESE´ tudesetRe´sultats2002;155:1–8.
[17] Klein-PlatatC,WagnerA,HaanMC,ArveilerD,SchliengerJL,SimonC, etal.Prevalenceandsociodemographicdeterminantsofoverweightin youngFrenchadolescents.DiabetesMetabResRev2003;19(2):153–8.
[18] CurrieC,ZanottiC,MorganA,CurrieD,deLoozeM,RobertsC,etal. Socialdeterminantsofhealthandwell-beingamongyoungpeople.Health BehaviourinSchool-agedChildren(HBSC)study:internationalreportfrom the2009/2010 survey. Copenhagen:WHO Regional Officefor Europe (HealthPolicyforChildrenandAdolescents,No.6);2012. Availableat
http://www.hbsc.unito.it/it/images/pdf/hbsc/prelims-part1.pdf.
[19] DourgnonP,JusotF,FantinR.Payernuitgravementa` lasante´ :unee´tude de l’impact du renoncement financier aux soins sur l’e´tat de sante´. EconomiePublique2012;28–29:123–47.
[20] AllinS,StabileM.Socioeconomicstatusandchildhealth:whatistherole ofhealthcare,healthconditions,injuriesandmaternalhealth?Health EconPolicyLaw2012;7(2):227–42.
[21] CamboisE,JusotF.Contributionoflifelongadverseexperiencestosocial healthinequalities:findingsfromapopulationsurveyinFrance.EurJ PublicHealth2011;21(5):667–73.
[22] JusotF,TubeufS,TrannoyA.Effortorcircumstances:doesthecorrelation matterforinequalityofopportunityinhealth?IRDES;2010.
[23] Despre`sC,DourgnonP,FantinR,JusotF.Lerenoncementauxsoinspour raisonsfinancie`res: une approchee´conome´trique. IRDES;2011: 1–6 [Questionsd’e´conomielasante´].
[24] ReinholdS,Ju¨rges H.Parental incomeand childhealth in Germany. HealthEcon2012;21(5):562–79.
[25] VanKippersluisH,VanOurtiT,O’DonnellO,VanDoorslaerE.Health andincomeacrossthelifecycleandgenerationsinEurope.JHealthEcon 2009;28(4):818–30.
[26] DeatonA, Case A.Broken down by workand sex: how ourhealth declines. In: DavidWise A,editor.Anal EconAging.University of ChicagoPress;2005.
[27] DelpierreC,Lauwers-CancesV,DattaGD,BerkmanL,LangT.Impactof socialpositionontheeffectofcardiovascularriskfactorsonself-rated health.AmJPublicHealth2009;99(7):1278–84.
[28] DowdJB,ZajacovaA.Doesself-ratedhealthmeanthesamethingacross socioeconomicgroups?Evidencefrombiomarkerdata. AnnEpidemiol 2010;20(10):743–9.
[29] Etile´ F,MilcentC.Income-relatedreportingheterogeneityinself-assessed health:evidencefromFrance.HealthEcon2006;15(9):965–81.
[30] Delpierre C,Kelly-Irving M,Munch-Petersen M,Lauwers-Cances V, DattaGD,LepageB,etal.SRHandHrQOL:doessocialpositionimpact differently on their link with health status? BMC Public Health 2012;12:19.
[31] DowdJB,ToddM.Doesself-reportedhealthbiasthemeasurementof healthinequalitiesinusadults?Evidenceusinganchoringvignettesfrom thehealth and retirement study. JGerontol B PsycholSci SocSci 2011;66(4):478–89.
[32] CurrieJ.Healthy,wealthy,andwise:socioeconomicstatus,poorhealthin childhood,andhumancapitaldevelopment.JEconLit2009;47(1):87–122.