C-Reactive Protein
Possible Hepatic Contribution to Systemic Inflammation in the
Metabolic Syndrome
Arthur Kerner, Ophir Avizohar, Ron Sella, Peter Bartha, Oren Zinder, Walter Markiewicz,
Yishai Levy, Gerald J. Brook, Doron Aronson
Objective—The objective of this study was to test whether the frequent association between liver enzyme elevations and various components of the metabolic syndrome is associated with higher C-reactive protein (CRP) levels.
Methods and Results—Alanine aminotransferase (ALT), alkaline phosphatase (Alk-P), and high-sensitivity CRP were measured in 1740 subjects. Adjusted geometric mean CRP was calculated for subjects with normal and elevated ALT and for subjects with normal and elevated Alk-P, adjusting for age, sex, smoking, physical activity, body mass index, fasting glucose, triglycerides, the presence of hypertension and low HDL cholesterol, and use of aspirin or hormone replacement therapy. Adjusted CRP levels were higher in subjects with elevated ALT (2.21 versus 1.94 mg/L,P⫽0.028) or elevated Alk-P (2.58 versus 1.66 mg/L,P⬍0.0001). Logistic regression showed that compared with subjects with normal liver function tests, the adjusted odds for high-risk CRP (⬎3 mg/L) were significantly higher in subjects with elevated ALT (OR, 1.5; 95% CI, 1.2 to 1.9,P⫽0.002) or elevated Alk-P (OR, 2.1; 95% CI, 1.7 to 2.6,P⬍0.0001).
Conclusions—Elevations of liver enzymes are associated with higher CRP concentrations. Hepatic inflammation secondary to liver steatosis is a potential contributor to the low-grade inflammation associated with the metabolic syndrome.(Arterioscler Thromb Vasc Biol. 2005;25:193-197.)
Key Words: C-reactive protein 䡲 inflammation 䡲 liver steatosis 䡲 metabolic syndrome 䡲 nonalcoholic fatty liver 䡲 obesity
A
rterial inflammation has emerged as central to the initiation and progression of atherosclerosis. Of the markers of inflammation, C-reactive protein (CRP) has been shown in multiple prospective studies to predict incident myocardial infarction, stroke, peripheral vascular disease, and sudden cardiac death.1,2Obesity and the metabolic syndrome are associated with chronic inflammatory response, characterized by abnormal cytokine production, increased acute phase reactants, and activation of inflammatory signaling pathways.3Recent stud-ies have shown that elevated CRP is strongly associated with various characteristics of the metabolic syndrome.4 – 6 A growing body of evidence implicates adipose tissue as a major regulator of chronic low-grade inflammation in pa-tients with the metabolic syndrome. Adipose tissue produces proinflammatory cytokines, such as tumor necrosis factor-␣ and interleukin-6,3,5,7,8and is considered an important source of basal production of interleukin-6, the chief stimulator of the production of CRP in the liver.9
Nonalcoholic fatty liver disease (NAFLD) and nonalco-holic steatohepatitis (NASH) are highly prevalent diseases
that accompany the epidemic of obesity and the metabolic syndrome.10 –13It is estimated that 25% of the American adult population has NAFLD.14Many studies have shown a strong association between components of the metabolic syndrome and both NAFLD and NASH.10,12,13,15,16
Current understanding of the progression of NAFLD and NASH involves a “2-hit” hypothesis in which the initial metabolic disturbance causes steatosis and a second patho-genic stimulus causes oxidative stress, reactive oxygen spe-cies formation, and cytokine production.10,11,17,18Thus it has been suggested that inflammatory processes that occur in the liver contribute to the systemic inflammation that character-izes the metabolic syndrome.19
Elevated serum alanine aminotransferase (ALT) levels is the most common liver abnormality in NAFLD and NASH, whereas alkaline phosphatase (Alk-P) and ␥ -glutamyl-transferase are less frequently elevated.20NAFLD is a com-mon explanation for abnormal liver tests results and accounts for asymptomatic elevation of aminotransferase levels in up to 90% of cases.21
Original received July 17, 2004; final version accepted October 11, 2004.
From the Departments of Cardiology (A.K., R.S., W.M., D.A.), the Center for Preventive Medicine (O.A., G.J.B.), Internal Medicine D (P.B., Y.L.), and Laboratory Medicine (O.Z.), Rambam Medical Center and Rappaport Faculty of Medicine, Haifa, Israel.
Correspondence to Doron Aronson, MD, Department of Cardiology, Rambam Medical Center, POB 9602, Haifa 31096, Israel. E-mail daronson@netvision.net.il
© 2005 American Heart Association, Inc.
Arterioscler Thromb Vasc Biol.is available at http://www.atvbaha.org DOI: 10.1161/01.ATV.0000148324.63685.6a
Although subjects with characteristics of the metabolic syndrome frequently have abnormal liver function tests,10,12,13,15,16there are no data on the association between elevated liver function tests (a crude marker of NAFLD) and metabolic abnormalities in relation to markers of inflamma-tion. The aim of this study was to examine the relationship between abnormal liver function tests and CRP levels in middle-aged subjects with characteristics of the metabolic syndrome.
Methods
SubjectsWe studied middle-aged subjects who reported to the Rambam Center for Preventive Medicine for investigation of cardiovascular risk factors. A complete medical history was taken by a physician. Subjects with known inflammatory disease and coronary disease and subjects using stains or with alcohol consumptionⱖ40 g per week were excluded. The investigational review committee on human research approved the study. All subjects enrolled in the study signed a statement agreeing to the use of their medical information for research purposes.
Definitions
Diagnosis of the metabolic syndrome was based on the recent Third Report of the National Cholesterol Education Program Expert Panel on Detection, Evaluation, and Treatment of High Blood Cholesterol in Adults (Adult Treatment Panel III) Criteria.22 The following cutoff limits were used: (1) systolic blood pressureⱖ130 mm Hg, diastolic blood pressureⱖ85 mm Hg , or on antihypertensive medi-cation; (2) triglycerideⱖ1.7 mmol/L (150 mg/dL); (3) low HDL cholesterolⱕ1.0 mmol/L (40 mg/dL) for men andⱕ1.3 mmol/L (50 mg/dL) for women; and (4) fasting glucoseⱖ6.1 mmol/L (110 mg/dL). Because waist circumference was not measured in all subjects, we used a body mass index (BMI) cut pointⱖ30 kg/m2
for obesity, as suggested by the recent World Health Organization criteria for diagnosis of the metabolic syndrome.23Subjects withⱖ3 of the above criteria were diagnosed as having the metabolic syndrome.
Cigarette smoking was trichotomized into “never,” “past,” or “current” by use of standard questionnaire. For leisure time physical activity, we considered 3 categories (never or rarely, mild, and intensive or competitive).
Elevated ALT values were defined as⬎500 nkat/L (30 U/L) for men and⬎317 nkat/L (19 U/L) in women, based on the cutoff values provided by Prati et al.24These cutoff values increase the sensitivity for detection of patients with liver injury (primarily patients with hepatic steatosis).24Using these cutoff values corresponded approx-imately to the upper quartile in the study population (22% of men and 28% of women were classified as having elevated ALT values). Because cutoffs for elevated Alk-P have not been clearly defined, elevated Alk-P levels were defined as the upper quartile of Alk-P in the study population.
Laboratory Measurements
Venous blood samples were collected from each subject after a 12-hour fast and used for assay of glucose, total and HDL choles-terol, triglycerides, ALT, and Alk-P using Hitachi 911 automate and Boehringer Mannheim reagents. The intra-assay coefficients of variation for ALT and Alk-P were 4.4% and 5.0%, respectively.
CRP was measured with latex-enhanced immunonephelometry on a Behring BN II Nephelometer (Dade Behring). In this assay, polystyrene beads coated with mouse monoclonal antibodies bind CRP present in the serum sample and form aggregates. The intensity of the scattered light is proportional to the size of the aggregates and thus reflects concentration of CRP present in the sample. The intra-assay and interassay coefficients of variation for CRP were 3.3% and 3.2%, respectively. The lower detection limit of the assay was 0.15 mg/L.
Statistical Methods
The distribution of CRP levels was highly skewed. Therefore, logarithmically transformed values of CRP (ln CRP) were used in all analyses, with results expressed as geometric means.
Geometric means of CRP were adjusted for age, sex, level of physical activity, smoking status, components of the metabolic syndrome (presence of obesity, glucose intolerance, hypertension, low HDL-cholesterol, and elevated triglycerides), and use of hor-mone replacement therapy (HRT) and aspirin, using ANCOVA, under a general linear model. In additional models, geometric means of CRP were calculated using metabolic risk factors as continuous variables (BMI, fasting glucose, systolic blood pressure, HDL-cho-lesterol, and triglycerides).
In addition, geometric means of CRP were calculated using 2-way ANCOVA under a general linear model with ln CRP as the dependent variable, liver function tests (normal or elevated) as 1 factor, and the severity of metabolic abnormalities as the other (0 characteristics of the metabolic syndrome, 1 or 2 characteristics, and ⱖ3 characteristics). Similar models were fitted with liver function tests as 1 factor and levels of adiposity as the other (normal weight, overweight, and obese). TheP-value for the main effect in these models is reported.
Multivariate logistic regression models were used to examine the association between the metabolic syndrome and high-risk CRP, defined as CRP ⬎3.0 mg/L based on the recent American Heart Association/Centers for Disease Control and Prevention consensus recommendations,25in relation to liver function test status. These logistic regression models were used to calculate the probability of a high-risk CRP for each patient, and receiver operating characteristic (ROC) curves were constructed for each of these models. The discriminant accuracy of each logistic model was quantified in terms of the area under these curves.26,27 Differences were considered significant at the 2-sidedP⬍0.05 level. All statistical analyses were performed using the SPSS statistical software (Version 11.5).
Results
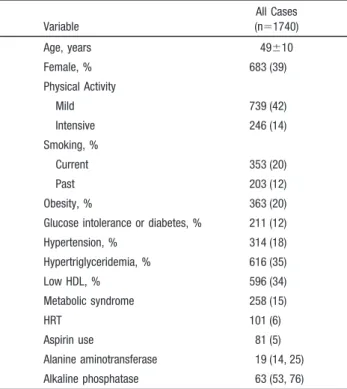
The study population included 1740 subjects (mean age 49⫾10 years, 61% males). The majority of subjects (65.5%) were overweight or obese (BMIⱖ25 kg/m2), and 258 (14.8%) had the metabolic syndrome. The clinical characteristics of the study participants, according to the number of elevated liver function tests, are presented in Table 1. The prevalence of positive criteria for all components of the metabolic syndrome was higher in subjects with elevated ALT and in subjects with elevated Alk-P (Table 2).
Adjusted geometric mean CRP levels were significantly higher in subjects with elevated ALT or elevated Alk-P (Figure 1). The analyses were repeated using continuous rather than dichotomous variables for all components of the metabolic syndrome (BMI, systolic blood pressure, triglycer-ides, HDL cholesterol, and fasting glucose). In the continuous variable models, the adjusted geometric mean CRP was also higher in patients with elevated ALT (2.21 versus 1.94 mg/L, P⫽0.028) or elevated Alk-P (2.58 versus 1.66 mg/L, P⬍0.0001).
Using the same models, we tested the significance of trends for increasing CRP levels across increasing quartiles of liver function tests. CRP levels increased with increasing quartiles of both ALT (P for trend⫽0.005) and Alk-P (P for trend
⬍0.0001).
There was a significant increase in CRP levels with increasing number of abnormal liver function tests. The adjusted geometric mean CRP was 1.78 mg/L (95% CI, 1.68 to 1.89) in subjects with normal ALT and Alk-P; 2.29 mg/L (95% CI, 2.12 to 2.48) in subjects with elevated ALT or
Alk-P; and 2.75 mg/L (95% CI, 2.29 to 3.25) in subjects with both elevated ALT and Alk-P (Pfor trend⬍0.0001).
Adjusted geometric mean CRP levels were also computed in analyses in which study participants were stratified into 6 groups according to liver function tests status (normal or elevated) and 3 categories of adiposity. Two-way ANCOVA main effects indicated that elevated ALT (P⫽0.01) and the level of adiposity (P⬍0.0001) were significantly associated with increased CRP levels. There were no significant inter-actions (P⫽0.80), indicating that the effects were additive. Figure 2A shows adjusted geometric mean CRP levels obtained from the 2-way ANCOVA model using the main effects of Alk-P status (P⬍0.0001) and the level of adiposity (P⬍0.0001). For each level of adiposity, the adjusted
geo-metric mean CRP level was lowest among subjects with normal alkaline phosphates and highest among subjects with elevated Alk-P.
Similar results were obtained when subjects were classified according to ALT status and the severity of metabolic abnormalities (elevated ALT main effect P⬍0.0001; meta-bolic abnormalities main effectP⬍0.0001). Figure 2B shows adjusted geometric mean CRP levels obtained from the 2-way ANCOVA model using the main effects of Alk-P status (P⬍0.0001) and the number of metabolic abnormalities (P⬍0.0001).
Multivariate logistic regression models were developed to determine the ability of elevated liver function tests to predict high-risk CRP (⬎3 mg/L). Compared with subjects with normal liver function tests, the adjusted odds for high-risk CRP level were significantly higher in subjects with either elevated ALT (OR, 1.5; 95% CI, 1.2 to 1.9, P⫽0.002) or elevated Alk-P (OR, 2.1; 95% CI, 1.7 to 2.6,P⬍0.0001). The area under the ROC curve of the logistic model for high-risk CRP using the presence of the metabolic syndrome data alone was 0.57⫾0.07. The area under the ROC curve increased with the addition of ALT data (0.61⫾0.07) and with the addition of Alk-P data (0.69⫾0.06).
TABLE 1. Clinical and Biochemical Characteristics of the Study Participants Variable All Cases (n⫽1740) Age, years 49⫾10 Female, % 683 (39) Physical Activity Mild 739 (42) Intensive 246 (14) Smoking, % Current 353 (20) Past 203 (12) Obesity, % 363 (20) Glucose intolerance or diabetes, % 211 (12) Hypertension, % 314 (18) Hypertriglyceridemia, % 616 (35) Low HDL, % 596 (34) Metabolic syndrome 258 (15) HRT 101 (6) Aspirin use 81 (5) Alanine aminotransferase 19 (14, 25) Alkaline phosphatase 63 (53, 76) Data are mean⫾SD, percentages, or median (interquartile range) for variables with skewed distribution. HRT indicates hormone replacement therapy.
TABLE 2. Positive Criteria for Components of the Metabolic Syndrome According to Liver Function Tests Category
Variable Normal ALT (n⫽1347) Elevated ALT (n⫽393) Normal AlkP (n⫽1298) Elevated AlkP (n⫽435) Obesity (BMI⬎30 Kg/m2) 221 (16) 142 (36)* 248 (19) 114 (26)† Fasting glucoseⱖ110 mg/dL 133 (10) 78 (20)* 145 (11) 65 (15)§ Arterial pressureⱖ130/85 mm Hg or pharmacologically treated 219 (16) 95 (24)* 220 (17) 94 (22)§ Triglyceridesⱖ150 mg/dL 428 (32) 188 (48)* 407 (31) 208 (22)* HDL⬍40 mg/dL for men or ⬍50 mg/dL for women 421 (31) 175 (45)* 423 (32) 172 (40)§ Metabolic syndrome 150 (11) 108 (28)* 175 (13) 83 (19)‡
Data are the No. of positive cases and prevalence. *P⬍0.0001; †P⬍0.005; ‡P⬍0.01; §P⬍0.05.
Figure 1.Adjusted geometric mean CRP levels and 95% CIs according to liver function tests status. CRP levels were adjusted for age, sex, smoking status, physical activity, compo-nents of the metabolic syndrome (obesity, glucose intolerance, hypertension, low HDL-cholesterol, and high triglycerides), and use of HRT and aspirin using ANCOVA under a general linear model. Alk-P indicates alkaline phosphatase.
Discussion
The results of this study show a direct association between elevated liver function tests (defined as liver enzyme levels in the upper quartile of the study population) and serum CRP concentrations. Elevation of liver function tests was associ-ated with increasing number of all components of the meta-bolic syndrome, indicating that they mainly represent NAFLD. However, the association between elevated liver function tests and CRP was independent of the presence of metabolic abnormalities and other factors known to influence CRP levels, such as smoking, level of physical activity, and HRT. The association between liver enzyme abnormalities and increased CRP concentrations raises the possibility that inflammatory processes that accompany NAFLD contribute to the systemic inflammation observed in subjects with obesity and other characteristics of the metabolic syndrome. Our study has several important limitations. We assume that most cases of elevated liver enzymes are secondary to NAFLD. There are several reasons for this hypothesis. First, biopsy and ultasonographic studies of patients referred for
unexplained aminotransferase elevations indicate that these cases are caused by fatty infiltration of the liver in 90% of cases.24,28,29 Second, in our study population, there was a strong relationship between elevated liver enzymes and all components of the metabolic syndrome (Table 2). Notwith-standing, tissue samples for histology were not collected and, therefore, the true cause of liver enzyme elevations in the study participants cannot be determined with certainty. In addition, the Adult Treatment Panel III definition of the metabolic syndrome used in our study is weakly correlated with direct measurements of insulin resistance.30
The association between NAFLD and obesity, diabetes mellitus, hypertriglyceridemia, and hypertension is well es-tablished,10,12,13,15,16and the simultaneous presence of several metabolic abnormalities increases the risk of more advanced stages of liver disease.13CRP levels are elevated in metabolic disorders such as obesity, glucose intolerance, and hypertri-glyceridemia.4,31,32 There is no consensus regarding the mechanism for the association between metabolic disorders and chronic subclinical inflammation,19and several possible explanations have been suggested. These include release of proinflammatory cytokines from adipose tissue5,8,33; metabol-ic abnormalities associated with insulin resistance, including hyperglycemia,34 elevated free fatty acids, and endothelial dysfunction; and primary insulin resistance independent of its associated metabolic abnormalities.35
Although the liver is recognized as a major source of inflammatory mediators, it is generally assumed that hepatic production of CRP in subjects exhibiting metabolic abnormali-ties that characterize insulin resistance occurs under the influ-ence of cytokines produced in other tissues.33,36 However, inflammatory processes occur in the liver in response to fatty infiltration independent of extra hepatic stimulation.18,37,38
The liver has one of the largest resident population of macrophages (Kupffer cells), which are key components of the innate immune systems. Hepatic macrophages generate various inflammatory mediators and cytokines that modulate the pheno-type of neighboring hepatocytes and other immune cells that travel through the liver.38Similar to infiltration of lipoprotein particles into the arterial wall, fat accumulation in the liver stimulates hepatic cytokine production, which could further contribute to the increased CRP levels. For example, the pro-duction of tumor necrosis factor-␣is one of the earliest events in NAFLD, triggering the production of other cytokines that together recruit inflammatory cells, promote hepatocyte injury, and initiate a healing response.18 Histological evidence of mononuclear or polymorphonuclear cell infiltration (or both) is characteristic of the progression of simple steatosis to NASH,11 and the presence of greater number of characteristics of the metabolic syndrome is associated with more severe necroinflam-matory activity in liver biopsies.13Animal studies suggest that hepatic macrophages might be responsible in part for the obesity-associated cytokine production in peripheral tissues.37
The results of this study suggest that liver inflammation secondary to NAFLD contributes to the subclinical systemic inflammation in individuals with features of the metabolic syndrome. Previous studies indicate that mild increases in liver enzyme levels should not be interpreted as nonspecific biochem-ical interference, especially in the presence of features of the Figure 2.Adjusted geometric mean CRP levels according to
Alk-P levels and categories of adiposity (normal weight, over-weight, and obese; A) or number of components of the meta-bolic syndrome (0 components, 1 or 2 components, andⱖ3 components; B). Alk-P indicates alkaline phosphatase.
metabolic syndrome,24because they correspond to typical his-topathologic lesions.28,39,40Given that CRP levels provide addi-tional prognostic information regarding subsequent cardiovascu-lar events in people with the metabolic syndrome,6,32,41 the results of this study suggest that these minor liver abnormalities are also relevant in the context of cardiovascular risk.
Conclusion
Mild elevations in liver enzymes are associated with higher plasma CRP concentrations. Hepatic inflammation secondary to NAFLD is a potential contributor to the chronic low-grade inflammation associated with metabolic risk factors and the metabolic syndrome.
References
1. Ridker PM. High-sensitivity C-reactive protein: potential adjunct for global risk assessment in the primary prevention of cardiovascular disease.Circulation. 2001;103:1813–1818.
2. Ridker PM. Clinical application of C-reactive protein for cardiovascular disease detection and prevention.Circulation. 2003;107:363–369. 3. Wellen KE, Hotamisligil GS. Obesity-induced inflammatory changes in
adipose tissue.J Clin Invest. 2003;112:1785–1788.
4. Festa A, D’Agostino R Jr, Howard G, Mykkanen L, Tracy RP, Haffner SM. Chronic subclinical inflammation as part of the insulin resistance syndrome: the Insulin Resistance Atherosclerosis Study (IRAS). Circu-lation. 2000;102:42– 47.
5. Yudkin JS, Stehouwer CD, Emeis JJ, Coppack SW. C-reactive protein in healthy subjects: associations with obesity, insulin resistance, and endo-thelial dysfunction: a potential role for cytokines originating from adipose tissue?Arterioscler Thromb Vasc Biol. 1999;19:972–978.
6. Ridker PM, Buring JE, Cook NR, Rifai N. C-reactive protein, the meta-bolic syndrome, and risk of incident cardiovascular events: an 8-year follow-up of 14 719 initially healthy American women. Circulation. 2003;107:391–397.
7. Weisberg SP, McCann D, Desai M, Rosenbaum M, Leibel RL, Ferrante AW Jr. Obesity is associated with macrophage accumulation in adipose tissue.J Clin Invest. 2003;112:1796 –1808.
8. Hotamisligil GS, Arner P, Caro JF, Atkinson RL, Spiegelman BM. Increased adipose tissue expression of tumor necrosis factor-␣in human obesity and insulin resistance.J Clin Invest. 1995;95:2409 –2415. 9. Heinrich PC, Castell JV, Andus T. Interleukin-6 and the acute phase
response.Biochem J. 1990;265:621– 636.
10. James O, Day C. Non-alcoholic steatohepatitis: another disease of affluence.Lancet. 1999;353:1634 –1636.
11. Angulo P. Nonalcoholic fatty liver disease.N Engl J Med. 2002;346: 1221–1231.
12. Sanyal AJ, Campbell-Sargent C, Mirshahi F, Rizzo WB, Contos MJ, Sterling RK, Luketic VA, Shiffman ML, Clore JN. Nonalcoholic steato-hepatitis: association of insulin resistance and mitochondrial abnor-malities.Gastroenterology. 2001;120:1183–1192.
13. Marchesini G, Bugianesi E, Forlani G, Cerrelli F, Lenzi M, Manini R, Natale S, Vanni E, Villanova N, Melchionda N, Rizzetto M. Nonalcoholic fatty liver, steatohepatitis, and the metabolic syndrome. Hepatology. 2003;37:917–923.
14. Green RM. NASH: hepatic metabolism and not simply the metabolic syndrome.Hepatology. 2003;38:14 –17.
15. Donati G, Stagni B, Piscaglia F, Venturoli N, Morselli-Labate AM, Rasciti L, Bolondi L. Increased prevalence of fatty liver in arterial hypertensive patients with normal liver enzymes: role of insulin resistance.Gut. 2004;53:1020 –1023.
16. Chitturi S, Abeygunasekera S, Farrell GC, Holmes-Walker J, Hui JM, Fung C, Karim R, Lin R, Samarasinghe D, Liddle C, Weltman M, George J. NASH and insulin resistance: insulin hypersecretion and specific association with the insulin resistance syndrome.Hepatology. 2002;35:373–379. 17. Day CP, James OF. Hepatic steatosis: innocent bystander or guilty party?
Hepatology. 1998;27:1463–1466.
18. Tilg H, Diehl AM. Cytokines in alcoholic and nonalcoholic steato-hepatitis.N Engl J Med. 2000;343:1467–1476.
19. Grundy SM. Inflammation, hypertension, and the metabolic syndrome.
JAMA. 2003;290:3000 –3002.
20. Falck-Ytter Y, Younossi ZM, Marchesini G, McCullough AJ. Clinical features and natural history of nonalcoholic steatosis syndromes.Semin Liver Dis. 2001;21:17–26.
21. Clark JM, Brancati FL, Diehl AM. The prevalence and etiology of elevated aminotransferase levels in the United States. Am J Gastro-enterol. 2003;98:960 –967.
22. Executive Summary of The Third Report of The National Cholesterol Education Program (NCEP) Expert Panel on Detection, Evaluation, and Treatment of High Blood Cholesterol in Adults (Adult Treatment Panel III).JAMA. 2001;285:2486 –2497.
23. Alberti KG, Zimmet PZ. Definition, diagnosis and classification of diabetes mellitus and its complications. Part 1: diagnosis and classifi-cation of diabetes mellitus provisional report of a WHO consultation.
Diabet Med. 1998;15:539 –553.
24. Prati D, Taioli E, Zanella A, Della Torre E, Butelli S, Del Vecchio E, Vianello L, Zanuso F, Mozzi F, Milani S, Conte D, Colombo M, Sirchia G. Updated definitions of healthy ranges for serum alanine aminotrans-ferase levels.Ann Intern Med. 2002;137:1–10.
25. Pearson TA, Mensah GA, Alexander RW, Anderson JL, Cannon RO, 3rd, Criqui M, Fadl YY, Fortmann SP, Hong Y, Myers GL, Rifai N, Smith SC Jr, Taubert K, Tracy RP, Vinicor F. Markers of inflammation and car-diovascular disease: application to clinical and public health practice: a statement for healthcare professionals from the Centers for Disease Control and Prevention and the Am Heart Association. Circulation. 2003;107:499 –511.
26. Zweig MH, Campbell G. Receiver-operating characteristic (ROC) plots: a fundamental evaluation tool in clinical medicine.Clin Chem. 1993;39: 561–577.
27. Hanley JA, McNeil BJ. The meaning and use of the area under a receiver operating characteristic (ROC) curve.Radiology. 1982;143:29 –36. 28. Sheth SG, Gordon FD, Chopra S. Nonalcoholic steatohepatitis. Ann
Intern Med. 1997;126:137–145.
29. Pratt DS, Kaplan MM. Evaluation of abnormal liver-enzyme results in asymptomatic patients.N Engl J Med. 2000;342:1266 –1271.
30. Cheal KL, Abbasi F, Lamendola C, McLaughlin T, Reaven GM, Ford ES. Relationship to insulin resistance of the adult treatment panel III diag-nostic criteria for identification of the metabolic syndrome. Diabetes. 2004;53:1195–1200.
31. Aronson D, Bartha P, Zinder O, Kerner A, Markiewicz W, Avizohar O, Brook GJ, Levy Y. Obesity is the major determinant of elevated C-reactive protein in subjects with the metabolic syndrome.Int J Obes Relat Metab Disord. 2004;28:674 – 679.
32. Ridker PM, Wilson PW, Grundy SM. Should C-reactive protein be added to metabolic syndrome and to assessment of global cardiovascular risk?
Circulation. 2004;109:2818 –2825.
33. Mohamed-Ali V, Goodrick S, Rawesh A, Katz DR, Miles JM, Yudkin JS, Klein S, Coppack SW. Subcutaneous adipose tissue releases interleukin-6, but not tumor necrosis factor-␣, in vivo.J Clin Endocrinol Metab. 1997;82:4196 – 4200.
34. Guha M, Bai W, Nadler JL, Natarajan R. Molecular mechanisms of tumor necrosis factor␣gene expression in monocytic cells via hyperglycemia-induced oxidant stress-dependent and -independent pathways. J Biol Chem. 2000;275:17728 –17739.
35. McLaughlin T, Abbasi F, Lamendola C, Liang L, Reaven G, Schaaf P, Reaven P. Differentiation between obesity and insulin resistance in the association with C-reactive protein.Circulation. 2002;106:2908 –2912. 36. Rader DJ. Inflammatory markers of coronary risk.N Engl J Med. 2000;
343:1179 –1182.
37. Yang SQ, Lin HZ, Lane MD, Clemens M, Diehl AM. Obesity increases sensitivity to endotoxin liver injury: implications for the pathogenesis of steatohepatitis.Proc Natl Acad Sci U S A. 1997;94:2557–2562. 38. Diehl AM. Nonalcoholic steatosis and steatohepatitis IV. Nonalcoholic
fatty liver disease abnormalities in macrophage function and cytokines.
Am J Physiol Gastrointest Liver Physiol. 2002;282:G1–G5.
39. Matteoni CA, Younossi ZM, Gramlich T, Boparai N, Liu YC, McCullough AJ. Nonalcoholic fatty liver disease: a spectrum of clinical and pathological severity.Gastroenterology. 1999;116:1413–1419. 40. Ratziu V, Giral P, Charlotte F, Bruckert E, Thibault V, Theodorou I,
Khalil L, Turpin G, Opolon P, Poynard T. Liver fibrosis in overweight patients.Gastroenterology. 2000;118:1117–1123.
41. Sattar N, Gaw A, Scherbakova O, Ford I, O’Reilly DS, Haffner SM, Isles C, Macfarlane PW, Packard CJ, Cobbe SM, Shepherd J. Metabolic syndrome with and without C-reactive protein as a predictor of coronary heart disease and diabetes in the West of Scotland Coronary Prevention Study.Circulation. 2003;108:414 – 419.