Endorsed by the Association for Hospital Medical Education
Statement of editorial PurPoSe
The Hospital Physician Endocrinology Board
Review Manual is a study guide for fel
lows and practicing physicians preparing for board examinations in endocrinology. Each manual reviews a topic essential to the cur rent practice of endocrinology.
PuBliSHinG Staff
PRESIDENT, GRouP PuBLISHER
Bruce M. White EDIToRIAL DIREcToR Debra Dreger ASSocIATE EDIToR Tricia Faggioli EDIToRIAL ASSISTANT Farrawh Charles
ExEcuTIvE vIcE PRESIDENT
Barbara T. White ExEcuTIvE DIREcToR of oPERATIoNS Jean M. Gaul PRoDucTIoN DIREcToR Suzanne S. Banish PRoDucTIoN ASSocIATE Kathryn K. Johnson ADvERTISING/PRoJEcT DIREcToR
Patricia Payne Castle
SALES & MARkETING MANAGER
Deborah D. Chavis
Copyright 2007, Turner White Communications, Inc., Strafford Avenue, Suite 220, Wayne, PA 19087-3391, www.turner-white.com. All rights reserved. No part of this publication may be reproduced, stored in a retrieval system, or transmitted in any form or by any means, mechanical, electronic, photocopying, recording, or otherwise, without the prior written permission of Turner White Communications. The preparation and distribution of this publication are supported by sponsor-ship subject to written agreements that stipulate and ensure the editorial independence of Turner White Communications. Turner White Communications retains full control over the design and production of all published materials, including selection of appropriate topics and preparation of editorial content. The authors are solely responsible for substantive content. Statements expressed reflect the views of the authors and not necessarily the opinions or policies of Turner White Communications. Turner White Communications accepts no responsibility for statements made by authors and will not be liable for any errors of omission or inac-curacies. Information contained within this publication should not be used as a substitute for clinical judgment.
NoTE fRoM THE PuBLISHER: This publication has been developed with out involvement of or review by the Amer ican Board of Internal Medicine.
Introduction . . . 2
Normal Glucose Homeostasis . . . 2
Beta Cell Dysfunction in Type 2 Diabetes . . . 5
Insulin Resistance in Type 2 Diabetes . . . 8
Recognizing Insulin Defects in the Clinic . . . 9
Conclusion . . . 11
References . . . 11
Table of Contents
Cover Illustration by Christine Armstrong
ENDoCRINoloGy BoARD REvIEw MANuAl
Insulin Secretory and Insulin
Resistance Defects in Type 2
Diabetes Mellitus
Editor:
Stephen A. Brietzke, MD, FACP, FACE
Associate Professor of Clinical Medicine, Division of Endocrinology, Department of Medicine, University of Missouri–Columbia, Columbia, MO
Contributors:
Ashwini Reddy, MD
Fellow, Division of Endocrinology, Department of Medicine, University of Missouri–Columbia, Columbia, MO
Sonia Gajula, MD
Fellow, Division of Endocrinology, Department of Medicine, University of Missouri–Columbia, Columbia, MO
introduCtion
Type 2 diabetes mellitus (DM) accounts for at least 85% to 90% of all cases of diabetes in the United States.1
In recent decades, the number of people in the United States and throughout the developed world affected by type 2 DM has steadily climbed to the point of an epidemic, placing a staggering clinical and economic burden on modern society. The estimated worldwide prevalence of type 2 DM in 2001 was 150 million, and it has been estimated that this number may double by 2025.2 Fueling the diabetes epidemic is the rising
inci-dence of obesity, food intake hypercaloric with regard to metabolic need, and sedentary lifestyle. These environ-mental factors play a contributory role in the develop-ment of type 2 DM, influencing expression of disease in genetically predisposed individuals.
Type 2 DM is a disease of complex pathogenesis, with a typically subtle onset and an inexorably slow progression. The study of the natural history of type 2 DM is complicated by the disease’s insidious, often asymptomatic onset and the fact that the most com-mon inheritance pattern is polygenic. Nevertheless, the natural history has been mapped on a population basis and in susceptible families to the extent that we can define both subtle early defects and phenotypes at risk for type 2 DM. This allows identification of high-risk in-dividuals who should be targeted for therapy early after the onset of disease—or even prior to disease onset, so as to delay or prevent the emergence of type 2 DM. Fortunately, an increasing array of pharmacotherapy options targeting specific pathophysiologic defects are available to help combat type 2 DM.
Despite the typically multifactorial inheritance, all forms of type 2 DM are defined by fasting and/or post-prandial hyperglycemia caused by 2 definable defects: subnormal responsiveness to insulin (insulin resistance) in key sites of glucose homeostasis (including skeletal muscle, adipose tissue, and the liver) and an insulin secretory defect preventing otherwise compensatory in-sulin hypersecretion. Which of these defects comes first
has been a topic of debate for several decades. Most of the available evidence favors the view that the ultimate triggering event is impaired insulin secretion, which, when superimposed on a background of impaired insulin action (insulin resistance), leads to overt type 2 DM. Nesher et al3 demonstrated that insulin resistance
is neither necessary nor sufficient for the development of type 2 DM but, rather, that defective insulin secre-tion is the primary defect responsible for unmasking overt diabetes. Specifically, the study showed that while most patients with type 2 DM had some degree of in-sulin resistance, there were patients with a confirmed diagnosis of diabetes who had no evidence of insulin resistance. These individuals remained normoglycemic by compensating for the reduction in insulin sensitiv-ity with increased insulin secretion.3 Therefore, insulin
resistance alone is insufficient to cause type 2 DM. The development of overt type 2 DM must involve a defect in insulin secretion at the level of the beta cell that pre-vents compensatory insulin hypersecretion.
This manual is the first of a 2-part review of well- defined as well as newly identified pathogenetic mecha-nisms in type 2 DM. This half of the review examines in further depth the roles played by the dual defects of im-paired insulin secretion (beta cell dysfunction) and sub-normal insulin action (insulin resistance) and highlights the clinical implications of these defects. The discussion continues in the next manual with a review of the evolv-ing knowledge of how gut-derived peptides (incretins) and adipocyte-derived cytokines (adipokines) influence insulin secretion and action in type 2 DM.
normal GluCoSe HomeoStaSiS
GluCoSe SourCeS and ProduCtion
The serum glucose concentration represents the net sum of glucose entering the circulation from endog-enous or exogendog-enous sources minus glucose removed from the circulation for storage or utilization (Figure 1). Exogenous glucose is derived solely from dietary food
Insulin Secretory and Insulin Resistance
Defects in Type 2 Diabetes Mellitus
Ashwini Reddy, MD, Sonia Gajula, MD, and Stephen A. Brietzke, MD, FACP, FACE
sources and absorbed from the gut. Gut-derived glucose results in an above-fasting glucose concentration for no longer than approximately 4 hours following a meal. Endogenous glucose sources include stored glucose released from liver glycogen (glycogenolysis). The liver stores approximately 80 g of glucose as glycogen, and once mobilized, the glycogen storage pool is virtually 100% depleted within 24 hours. The other important source of endogenous glucose is gluconeogenesis, which effectively recycles 3-carbon fragments of fat (glycerol), protein (alanine and glutamine), and carbohydrate (pyruvate and lactate) via the Cori cycle in the liver, where they are reassembled as glucose. Although gluco-neogenesis usually is regarded as a hepatic process, with prolonged fasting, the kidney contributes as much as 20% to 25% toward gluconeogenesis.
GluCoSe utiliZation
Glucose utilization is either insulin-dependent or insulindependent. Insuldependent influences in-clude uptake of glucose by muscle tissue, either for glycogen storage or for glycolysis, and glucose-to- glycerol conversion by adipose tissue and incorporation of glycerol and free fatty acid (FFA) as stored triglycer-ide. In the liver, insulin promotes action of glycogen synthase, thereby promoting hepatic glucose storage of glycogen. Equally important, insulin restrains hepatic gluconeogenesis. Non–insulin-dependent glucose uti-lization takes place in most other tissues—notably the formed elements of the blood, the kidneys, and brain tissue (neurons of the central nervous system [CNS]). Most glucose presented to the kidney as glomerular filtrate is reabsorbed in the proximal renal tubule, but at high concentrations (> 180–200 mg/dL), filtered glucose may exceed the renal Tmax(maximum transport
rate), with resultant spillage of glucose into the urine as glycosuria.
Hormonal influenCeS
The most potent hormonal influence on glucose ho- meostasis is exerted by insulin, via its ability to pro-mote glucose uptake and to restrain glycogenolysis and gluconeogenesis. Glucose counter-regulatory hormones oppose the effects of insulin, and in contrast to insulin (a largely stand-alone influence) have fourfold redundancy with regard to the number of hormones. The immedi-ate defense against hypoglycemia is glucagon, which is released from pancreatic islet alpha cells in response to the decreasing blood glucose concentration; one of the immediate effects of glucagon is stimulation of hepatic gluconeogenesis. Epinephrine promotes lipolysis and gluconeogenesis, whereas cortisol and growth hormone
antagonize cellular actions of insulin and promote mus-cle proteolysis so as to provide substrate for gluconeo-genesis.
During fasting, low insulin levels result in increased glucagon secretion and permit endogenous glucose production by disinhibiting the processes of hepatic gluconeogenesis and glycogenolysis. Simultaneously, glycogen synthesis and glucose uptake by insulin- sensitive tissues are reduced. In the postprandial state, there is a simultaneous increase in serum insulin and reciprocal reduction in serum glucagon concentra-tions, leading to a reversal of these net processes.
The competing processes of glucose production and glucose utilization are rarely “all or none” but rather si-multaneous, with one simply predominating at a given moment in time, based on physiologic conditions. As a partial reflection of the normal tight control of blood glucose, glucagon, the dominant gluconeogenesis- promoting hormone, stimulates insulin release, where-as insulin simultaneously inhibits glucagon relewhere-ase.
normal inSulin SeCretion and aCtion insulin Secretion
Insulin is secreted as a larger precursor molecule,
Dietary carbohydrate Glycogen sto rage Blood glucose Triglyceride storage Glycogen storage CNS glucose utilization Gluconeogenesi s Glycosuria
figure 1. Serum glucose concentration represents the net sum of glucose production by the liver (gluconeogenesis and glycoge nolysis) AND glucose absorption by the gut from meals MINUS glucose removal from the circulation by insulindependent glucose uptake in muscle and liver (fate of glucose is either glycolysis or storage as glycogen) and to a lesser extent adipose tissue (as glycerol) AND insulinindependent glucose uptake in the central nervous system (CNS) AND glucose loss in the urine (normally absent or trivial, unless serum glucose exceeds 180 mg/dL).
proinsulin, by the beta cells of the pancreatic islets. Postsecretory cleavage of proinsulin produces bioactive insulin and a 31-residue fragment known as C-peptide, which is essentially biologically inert but is a useful marker of endogenous insulin production.
Insulin secretion is regulated primarily by blood glucose concentration, although other nutrients and peptides, particularly alanine and glutamine, are also influential. After a meal, high blood glucose levels from intestinally digested and absorbed carbohydrate direct-ly stimulate insulin secretion. Evidence of postprandial insulin action includes increased glucose uptake by myocytes, FFA uptake and storage as triglyceride by adi-pose tissue, and storage of glucose as glycogen by the liver. Of equal importance, the insulin-rich postpran-dial state is also characterized by inhibition of stored fuel mobilization (ie, lipolysis, gluconeogenesis, and glycogenolysis) from peripheral sources.
Normally, insulin secretion in response to glucose is biphasic, with an early first phase followed by a second sustained phase (Figure 2). The first phase peaks 2 to 5 minutes following a glucose load and lasts approxi-mately 10 minutes. This response is due primarily to the release of preformed secretory granules from the beta cell. The second, more prolonged phase involves release of newly synthesized insulin in response to glucose.4
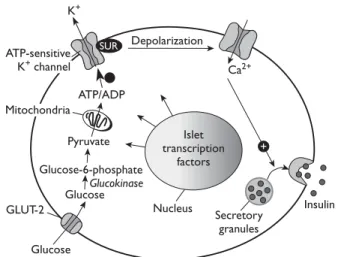
Glucose-stimulated secretion of insulin begins with glucose transport into the beta cell by the GLUT-2 transporter (Figure 3). Glucose uptake by the beta cell is substrate-driven, at a rate determined by serum glu-cose concentration in the extracellular compartment
and the amount of unmetabolized intracellular glucose within the beta cell. Thus, in the aggregate, glucose up-take by the beta cell is dependent on the extracellular/ intracellular concentration gradient of glucose and on the integrity of the GLUT-2 transporter. Once glucose enters the beta cell, it is metabolized via glycolysis. The resulting generation of adenosine triphosphate (ATP) causes cell membrane depolarization through the phos-phorylation of an ATP-sensitive potassium channel, allow-ing entry of calcium ions into the intracellular compart-ment. Calcium influx signals release of preformed insulin stored within intracellular vesicles into the portal circula-tion, where it exerts effects first on the liver and then on muscle and adipose tissues. The rate-limiting step in glucose-stimulated insulin secretion is phosphorylation of glucose by glucokinase, following GLUT-2–mediated transport into the beta cell (Figure 3).
insulin action
After being secreted from beta cells, 50% of insulin is degraded by the liver. Insulin, after binding to its receptor, causes autophosphorylation and activation of signaling molecules. This causes translocation of
10 20 30 40 50 600 150 300 0 20 40 60 80 0 Minutes Glucose (mg/dL) Insulin (ng/mL)
Period of glucose infusion Insulin
Glucose
figure 2. Multiphasic insulin release in response to glucose. A glu cose stimulus (in this case, to the isolated perfused pancreas) trig gers an initial burst of insulin, followed by a second, prolonged late phase increase. (Adapted from Grodsky GM, Curry D, Landahl H, Bennett L. Further studies on the dynamic aspects of insulin re lease in vitro with evidence for a twocompartmental storage system. Acta Diabetol Lat 1969;6 Suppl 1:554–78.)
Mitochondria ATP/ADP Pyruvate Glucose-6-phosphate Glucose Glucose K+ Depolarization Ca2+ Insulin Islet transcription factors Nucleus Secretory granules GLUT-2 ATP-sensitive K+ channel + Glucokinase SUR
figure 3. Linkage of glucose transport to insulin secretion by the beta cell. Glucose enters the beta cell via the GLUT2 glucose transporter and is subsequently phosphorylated by glucokinase; then, it can undergo glycolysis or oxidation. Adenosine triphos phate (ATP) generated by glucose oxidation results in depolariza tion of the cell membrane and opening of calcium channels, allowing entry of calcium ions into the cell. The rise in intracellular calcium signals release of insulin from secretory granules into the extra cellular space, and from thence to the portal circulation. ADP = adenosine diphosphate; SUR = sulfonylurea receptor. (Adapted with permission from Powers AC. Diabetes mellitus. In: Jameson JL, editor. Harrison’s endocrinology. New York: McGrawHill Publish ing Division; 2006:287. © 2006 The McGrawHill Companies, Inc.)
GLUT-4 to the cell’s surface, which is required for glucose uptake by skeletal muscle (Figure 4). In the setting of insulin resistance, reduced insulin-stimulated glucose uptake in adipocytes may occur due to down-regulation of GLUT-4 expression.
There are 2 families of cellular transporters of glucose: (1) sodium-linked transporters that actively transport glu-cose and (2) transporters that implement facilitated diffu-sion to move glucose. The diffudiffu-sion group of transporters consists of 5 transmembrane proteins: GLUT-1, GLUT-2, GLUT-3, GLUT-4, and GLUT-5. Each GLUT protein has a distinct property and tissue distribution (Table 1).5 For
practical purposes, the physiologically important GLUT transporters are GLUT-2 (the transporter used by the beta cell to sense and respond to the ambient glucose concentration), GLUT-4 (the major insulin-responsive glucose transporter in skeletal muscle), and GLUT-3 (the major non–insulin-requiring, substrate-driven glucose transporter abundant in neuronal tissue).
Beta Cell dYSfunCtion in tYPe diaBeteS
tHe PrediaBetiC State
Compensatory Beta Cell Hyperfunction
Evidence from studies in both animal models and human subjects indicates that, prior to the onset of diabetes, there is a phase of beta cell hyperfunction characterized by expansion of the mass of beta cells (hyperplasia) and an increase in insulin secretion. These changes are thought to occur as a compensatory re-sponse to insulin resistance in skeletal muscle and the liver. Increased delivery of nutrients, including glucose and FFA, is thought to be partially responsible for stimu-lating the expansion of the beta cell mass and increased insulin secretion. Additionally, insulin itself, insulin-like growth factor 1 (IGF-1), and the gut-derived incretin glucagon-like peptide 1 (GLP-1) have been shown to
figure 4. Insulin–insulin receptor binding stimulates glucose transport in muscle cells. Binding of insulin to the insulin receptor activates a tyrosine kinase intrinsic to the internal domain of the insulin receptor; tyrosine phosphorylation of insulin receptor substrates activates phosphoinositide3 kinase (PI3K), with downstream effects to promote glycolysis, glycogen storage, protein synthesis, and inhibition of proteolysis. Importantly, PI3K activation probably signals translocation of GLUT4 glucose transporters from an inactive intracellular stor age pool to active expression at the cell membrane. GLUT4 binds to glucose in the extracellular environment and facilitates its entry into the cell. AMP = adenosine monophosphate; ATP = adenosine triphosphate; IRS = insulinreceptor substrate; p110, p85 = subunits of phosphoinositide3 kinase; SH2 = Scr homology region 2. (Adapted with permission from Shepherd PR, Kahn BB. Glucose transporters and insulin action: implications for insulin resistance and diabetes mellitus. N Engl J Med 1999;341:250. Copyright © 1999 Massachusetts Medical Society. All rights reserved.)
Cytoplasm Phosphoinositide-3 kinase SH2 domains ATP Tyrosine phosphorylation p110 p85 IRS Cell membrane GLUT-4 Stimulation of glucose transport Exercise Insulin receptor Insulin 5′-AMP-activated kinase ? ? ? Protein kinase B (Akt) Phosphoinositide-dependent kinases Atypical protein kinase C Exercise-responsive GLUT-4– containing vesicle Insulin-responsive GLUT-4– containing vesicle
enhance the expression of the PDX1 (pancreatic and duodenal homeobox 1) gene, which is known to in-crease beta cell survival and stimulate beta cell prolif-eration. PDX1 gene expression also amplifies insulin secretion in at least 3 important ways: (1) it up-regulates beta cell glucokinase activity, which results in a higher rate of glycolysis within the beta cell; (2) it up-regulates the expression of GLUT-2 glucose transporters; and (3) it up-regulates insulin gene transcription.
A variety of defects contribute to the deterioration of compensatory beta cell hyperfunction and the eventual loss of compensation, heralding the onset of clinically evident diabetes. A by-product of robust oxidation of glu-cose and FFA is the increased intracellular generation of reactive oxygen species as mitochondrial membrane po-tential increases. The cellular response to oxidative stress is to increase expression of the UCP2 (uncoupling pro-tein 2) gene, which reduces mitochondrial membrane potential at the expense of reduced ATP generation. Ultimately, this may interfere with the normal coupling of beta cell glycolysis with cell membrane depolarization and, thus, reduce insulin secretion. Adenosine mono-phosphate kinase (AMPK) enhances FFA and glucose oxidation and lowers malonyl-CoA activity, normally pre-venting excessive accumulation of lipid within the beta cell. Increasing intracellular ATP generation by glycolysis and FFA oxidation reduces AMPK activity and allows enhanced malonyl-CoA expression, which in turn allows intracellular lipid accumulation. The further generation of complex lipids can ultimately become cytotoxic and contribute to beta cell apoptosis—a phenomenon that has become known as glucolipotoxicity. Finally, constant demand for high insulin production, borne by the en-doplasmic reticulum (ER), results in enhanced folding and unfolding of the ER. In animal models, this phe-nomenon has been associated with accelerated beta cell apoptosis.6
tHe tranSition to diaBeteS impaired insulin Secretion
In prediabetes or in obesity not complicated by DM, impaired insulin action in muscle, adipose tissue, and the liver is offset by compensatory insulin hypersecre-tion. Over time, insulin hypersecretion, oxidative stress to the beta cell, and/or glucolipotoxicity may lead to beta cell exhaustion and, ultimately, beta cell failure, as illustrated in Figure 5. As beta cell function declines, glucose tolerance declines as well, resulting in impaired glucose tolerance (IGT) and eventually DM.
Studies of the insulin response to hyperglycemia in patients with type 2 DM and in those with IGT (pre-diabetes) have shown reduced response to both enteral administration of glucose during the oral glucose toler-ance test and to intravenous administration of glucose (first-phase insulin response). Recent evidence confirms that both the first and second phases of insulin secretion are reduced and that secretory defects in both phases (19% reduction in the first phase, 12% in the second phase) are evident before the onset of DM in individu-als with a genetic predisposition for type 2 DM.7 Further
evidence of the decline in insulin secretion in response to glucose loading comes from a study of Pima Indians (a population with extremely high prevalence of type 2 DM) by Weyer et al.8 These investigators found that
the first-phase insulin response was decreased by 27% during the transition from normal glucose tolerance (defined as fasting plasma glucose [FPG] < 100 mg/dL or 2-hr postprandial glucose < 140 mg/dL) to IGT (de-fined as FPG of 110–126 mg/dL or 2-hr postprandial glucose of 140–199 mg/dL) and was further reduced by 51% during progression from IGT to type 2 DM (defined as FPG > 126 mg/dL or 2-hr postprandial glucose > 200 mg/dL). Nesher et al3 reported that the
degree of peripheral insulin resistance was similar in obese patients with type 2 DM and in lean individuals Table 1. Characteristics of the 5 FacilitatedDiffusion Glucose Transporters
Transporter
Approximate km for
Glucose, mmol/L Tissue Distribution characteristics
GLUT1 20 Widely expressed; high concentrations in brain, erythrocytes, and endothelial cells
Constitutive glucose transporter GLUT2 42 Kidney, small intestine epithelia, liver, pancreatic
beta cells
Lowaffinity glucose transporter; has a role in sensing glucose concentrations in islets
GLUT3 10 Neurons, placenta Highaffinity glucose transporter
GLUT4 2–10 Skeletal muscle, cardiac muscle, adipose cells Insulinresponsive glucose transporter GLUT5 NA Small intestine, sperm, kidney, brain, adipose cells,
muscle
Fructose transporter; very low affinity for glucose
Km = MichaelisMenten constant; NA = not applicable. (Adapted with permission from Shepherd PR, Kahn BB. Glucose transporters and insulin
action: implications for insulin resistance and diabetes mellitus. N Engl J Med 1999;341:249. Copyright © 1999 Massachusetts Medical Society. All rights reserved.)
with normal glucose tolerance; however, insulin secre-tion, as estimated by pancreatic responsiveness scores, was reduced by more than 80% in both lean and obese patients with type 2 DM. Thus, it appears clear that there is a predictable decline in insulin secretion in response to glucose challenge, which parallels the clinical deterioration of glucose homeostasis from normal glucose tolerance to IGT and from IGT to type 2 DM.
impaired Proinsulin Cleavage
As previously noted, insulin is derived from cleavage of the larger proinsulin molecule (synthesized in the ER of the beta cell) into bioactive insulin and physi-ologically inert C-peptide. In individuals with normal glucose tolerance, the cleavage process is incomplete to the extent that 10% to 15% of secreted insulin is measurable as proinsulin. In contrast, proinsulin con-stitutes more than 40% of circulating insulin in individ-uals with type 2 DM.9 The proinsulin cleavage defect does not appear to be specific for glucose-stimulated insulin secretion, because studies comparing serum insulin and proinsulin concentrations show the same trends in normal subjects as in patients with type 2 DM, even when the nonglucose insulin secretagogues argi-nine and glucagon are used experimentally.10 These findings in the aggregate suggest that the postsecretory activation of insulin in type 2 DM is deficient, or that there is insufficient time for the contents of insulin secretory granules to mature properly, in either case resulting in abnormal release of biologically immature proinsulin. The degree of hyperproinsulinemia cor-relates with the degree of hyperglycemia and beta cell dysfunction.11
Beta Cell Hypofunction and Pancreatic islet amyloid in overt diabetes
As previously discussed, increased beta cell mass and insulin hypersecretion gradually yield to receding beta cell mass and a decline in insulin secretion with the emergence of hyperglycemia. Oxidative stress, glucoli-potoxicity, unfavorable AMPK/malonyl-CoA signaling, and abnormal folding/unfolding of beta cell ER all may contribute to accelerated beta cell apoptosis and the loss of insulin secretory capacity.12
An anatomic finding correlating with type 2 DM in pancreatic islet biopsy specimens is accumulation of amyloid. Islet amyloid polypeptide (also known as amy-lin) is a 37-amino acid polypeptide originally isolated from amyloid deposits in the pancreatic islets of indi-viduals with type 2 DM.13 Amylin is stored along with
insulin in the secretory granules of beta cells and is co-secreted with insulin, accounting for about 10% of beta cell peptide secretion.14 Serum amylin concentrations are lower in individuals with IGT and type 2 DM than in those with normal glucose tolerance. Failed secretion of amylin may explain the observed phenomenon of high intracellular amylin concentrations in type 2 DM. There is some evidence that intracellular amylin accu-mulation impairs beta cell glucose transport, thereby inhibiting insulin secretion.15 It is therefore possible that amylin accumulation may directly contribute to the pathogenesis of type 2 DM.
Wilding et al16 identified no effects of amylin on either insulin secretion or insulin action in humans. In rats, the administration of an amylin antagonist in-duces increased insulin secretion and improved glucose tolerance, suggesting that amylin may tonically inhibit insulin secretion and thus have a physiologic role in attenuating insulin response to feeding.17 Amylin may have effects on glucose homeostasis independent of insulin as well. Pramlintide, a synthetic amylin analog, slows gastric emptying (thereby delaying glucose ab-sorption after meals) and induces satiety. It is unclear whether amylin itself plays a causative role in the patho-genesis of type 2 DM or is merely a marker of impaired insulin secretion, and it is not known to what extent the pharmacologic effects of pramlintide are shared in vivo by natural amylin.
CliniCal CorrelateS of defeCtive inSulin SeCretion
The anatomic and pathophysiologic changes in insulin secretory capacity are mirrored clinically by the observations of the U.K. Prospective Diabetes Study figure 5. Model for the relationship between progressive beta cell dysfunction and deterioration of glucose tolerance. IFG = impaired fasting glucose; IGT = impaired glucose tolerance. (Adapted with permission from Kahn SE. Clinical review 135: the importance of βcell failure in the development and progression of type 2 diabetes. J Clin Endocrinol Metab 2001;86:4052. Copyright © 2001, The Endocrine Society.)
Time IGTIFG
Diabetes Normal Beta cell function Low Glucose, mg/dL Fasting 2Hour 110 140 126 200
(UKPDS), in which beta cell function was estimated to be 50% of normal at the time of diagnosis of type 2 DM, with progressive decline of function over time.18
Worsening hyperglycemia in the UKPDS was evidenced by the finding that only 45% of patients who initially had hemoglobin A1c (HbA1c) levels less than 7%
main-tained that level of glycemic control after 6 years of intensive antihyperglycemic therapy. Insulin resistance did not decline over time, implying that deterioration of beta cell function was responsible for the worsening metabolic profile.18
Although obviously present in the late, overt stages of type 2 DM, insulin secretory defects predate onset of DM, probably by many years. Pimenta et al19 showed that
both first- and second-phase insulin responses were sig-nificantly reduced in Caucasian first-degree relatives of patients with type 2 DM.19 These individuals had no
de-monstrable insulin resistance when compared with age- and sex-matched controls with no family history of DM, which suggests that impaired insulin secretion is due to a genetically determined defect in beta cell function.
inSulin reSiStanCe in tYPe diaBeteS
By definition, insulin resistance is a state wherein the action of insulin on target tissue (skeletal muscle, liver, and adipose tissue) is subnormal, resulting in alteration of normal glucose transport and lipid utilization and stor-age.20 In the setting of tissue insulin resistance, elevated
fasting glucose levels are due to increased hepatic glu-coneogenesis and glycogenolysis as a result of resistance to the normal restraining influence of insulin on these processes. Postprandial hyperglycemia is primarily at-tributable to reduced glucose utilization by muscle tissue, related to ineffective insulin-mediated glucose transport.
Much has been published regarding the link be-tween documented insulin resistance and increased risk for developing type 2 DM. Lillioja et al21 studied
the relative contributions of obesity, beta cell hypo-function, and insulin resistance to the development of type 2 DM in 200 obese Pima Indians with either nor-mal or impaired glucose tolerance. At baseline, subjects were studied with oral glucose tolerance tests, plotting the glycemic and insulin response, and insulin sensitiv-ity was determined by hyperinsulinemic-euglycemic clamp. Insulin resistance was associated with a 27% incidence of DM after 6 years, whereas impaired insulin secretion and normal insulin sensitivity was associated with a 12% incidence of DM, leading the authors to conclude that insulin resistance was the strongest long-term predictor of DM.21
effeCtS of inSulin reSiStanCe on GluCoSe HomeoStaSiS
Hepatic effects
In the fasting state, hepatic glucose output (sum of glycogenolysis and gluconeogenesis) averages ap-proximately 2 mg/kg/min in nondiabetic humans; as FPG exceeds 140 mg/dL, this rate increases by about 0.5 mg/kg/min per 50 mg/dL increment in FPG.22
Studies in humans have demonstrated that 90% of total hepatic glucose production in type 2 DM is due to gluconeogenesis.23,24 A single precise underlying
biochemical explanation for accelerated hepatic gluco-neogenesis is unknown. Epiphenomena associated with the accelerated gluconeogenesis include hypergluca- gonemia, increased circulating precursor molecules (lactate, alanine, and glycerol), and increased circulat-ing FFA. High levels of circulatcirculat-ing FFA are also associ-ated with high levels of intrahepatocellular FFA, which may impede normal glucose phosphorylation and sec-ondary processing by the liver. In the postprandial state, impaired insulin action in the liver is evidenced by hypoactivity of glycogen synthase, resulting in reduced hepatic disposal of a glucose load as compared with the nondiabetic state.25 In summary, clinically relevant
hepatic correlates of insulin resistance include acceler-ated gluconeogenesis (the major contributor to fasting hyperglycemia in DM) and decreased postprandial storage of glucose as glycogen (contributing to post-prandial hyperglycemia).
effects in Skeletal muscle
Muscle tissue accounts for up to 85% of glucose uptake by peripheral (nonsplanchnic, non-CNS) tis-sues and is insulin-dependent. The most universal observation in peripheral insulin resistance is reduced GLUT-4–mediated glucose transport26,27 in the absence
of structural GLUT-4 abnormalities or subnormal total cellular GLUT-4 content.28 Rather, the predominant
defect appears to be subnormal translocation of intra-cellular GLUT-4 to the cytoplasmic membrane. Several additional observations may account for impaired in-sulin signaling in the inin-sulin-resistant state. Subnormal tyrosine kinase activity following insulin–insulin recep-tor binding has been observed in multiple studies in humans.29–31 An obvious effect is impaired activation of
phosphoinositide 3-kinase (PIK3), with reduced glyco-gen synthesis and reduced inhibition of proteolysis as metabolic consequences.
Once glucose is transported into the myocyte, its fate is dependent on its phosphorylation to glucose-6-phosphate, a conversion dependent on hexokinase-II (HK-II). The activity of HK-II is insulin-dependent, and
several investigators have documented that the activity of HK-II is subnormal in both type 2 DM32,33 and IGT.34
Impaired HK-II–mediated glucose phosphorylation may explain other observed deficiencies in glucose handling by myocytes, including impaired glycogen synthase activity (and resultant reduced glycogen stor-age) and impaired glucose oxidation. Contributing to impaired glucose oxidation may be a competing process of FFA oxidation attributable to the high levels of circulating FFA characteristic of type 2 DM as well as simple (nondiabetic) human obesity.35
effects in adipose tissue
The major repository of stored energy is FFA stored as triglyceride in adipose tissue, and the major effect of insulin on adipose tissue is to restrain release of FFA from triglyceride by inhibiting hormone-sensitive lipase.36 Resistance to this effect of insulin is evident by
the universal observation of elevated circulating FFA in type 2 DM,37 a finding correlated with high
intracel-lular FFA in myocytes and hepatocytes. High levels of intracellular FFA have been strongly associated with impaired insulin action in these target tissues,38–40 so
im-paired insulin action at the level of adipose tissue may represent a common pathway to the overall syndrome of insulin resistance.
GenetiC influenCeS on inSulin reSiStanCe
Insulin exerts its effect by binding to specific cell sur-face receptors. Insulin receptor mutations have been identified but in the aggregate are rare causes of dia-betes. Postreceptor defects presumably affecting one of the intracellular enzymes are thought to play predomi-nate roles in insulin resistance. Polymorphisms in the IRS-2 (insulin receptor substrate 2) gene,41,42 calpain-10
gene on chromosome 2A,43,44 β
3-adrenergic
recep-tor,45 and peroxisome proliferator-activated receptor
gamma-2 (PPARγ2) transcription factor46 have all been
implicated as proposed mechanisms in the pathogen-esis of insulin rpathogen-esistance. Recent studies also implicate genetic abnormalities involving myocyte mitochondrial function, which may contribute to insulin resistance and later to development of type 2 DM. Petersen et al47
identified reduced insulin-stimulated glucose uptake by muscle in children of type 2 DM patients as compared with a control group with negative family histories of DM; this finding was correlated with increased intra-myocellular lipid, a finding the authors attributed to reduced oxidative phosphorylation.
ContriBution of oBeSitY to inSulin reSiStanCe
Intra-abdominal (visceral) obesity is strongly
corre-lated with insulin resistance and is associated with high levels of circulating FFA, resistance to insulin-mediated glucose uptake, and reduced sensitivity of pancreatic beta cells to glucose. The proposed mechanisms link-ing obesity and insulin resistance are still incompletely understood but include both increased circulating FFA and derangements of circulating peptides re-leased by adipocytes, including tumor necrosis factor-a, interleukin-6, and the adipokines, adiponectin and resistin (Figure 6). Many studies have focused on the role of inflammation as a mediator linking obesity to pathogenesis of type 2 DM. This relationship—and the contribution of adipokines to insulin resistance and impaired insulin secretion—will be explored in part 2 of this review.
reCoGniZinG inSulin defeCtS in tHe CliniC
Considering the magnitude of the diabetes epidem-ic, all clinicians will have almost daily opportunities to either diagnose type 2 DM or to identify and counsel a patient at high risk for the disease. The following case illustrates an opportunity to recognize the physical, familial, and laboratory evidence of insulin resistance and insulin secretory defects and to intervene on behalf of the patient.
CaSe PreSentation
A 35-year-old woman with a history of polycystic ovary syndrome (PCOS) diagnosed at age 18 years is re-ferred to an endocrinology clinic for evaluation. Recent routine blood tests revealed a random serum glucose
figure 6. Adipokines released by adipocytes.11βHSD1 = 11β hydroxysteroid dehydrogenase1; IL6 = interleukin6; PAI1 = plas minogen activator inhibitor1; TNFa = tumor necrosis factora. (Adapted with permission from Flier JS, MaratosFlier E. Obesity. In: Jameson JL, editor. Harrison’s endocrinology. New York: Mc GrawHill Publishing Division; 2006:272. © 2006 The McGrawHill Companies, Inc.) Adipocyte Complement factors: Factor D Adipsin Others: PAI1 Angiotensinogen Enzymes: Aromatase 11βHSD1 Substrates: Free fatty acids
Glycerol Cytokines: TNFa IL6 Hormones: Leptin Adiponectin Resistin
level of 180 mg/dL. Aside from PCOS, the patient has no significant past medical history. She has never been pregnant, and her only current medication is a third-generation oral contraceptive pill. Her family history is remarkable for type 2 DM in her father.
Physical examination reveals blood pressure of 120/80 mm Hg, body mass index of 35 kg/m2, central
obesity, and acanthosis nigricans involving the dorsal neck and axillary skin folds. Other physical examina-tion findings and review of systems are normal.
• How do the historical and physical findings in this patient relate to her abnormal glucose tolerance?
Acanthosis nigricans is a skin lesion highly associated with insulin resistance. Significantly, the patient’s his-tory of PCOS is also associated with insulin resistance and places her at possibly as high as a 40% lifetime risk for developing type 2 DM.48 The fact that the patient
has a first-degree relative with type 2 DM also greatly increases her risk for developing the disease, as does her obesity. While her random blood glucose level (180 mg/dL) is not diagnostic of type 2 DM, it is likely to confer a diagnosis of IGT (prediabetes). Based on all considerations, including her age and multiple risk factors, this patient has a 50% or greater likelihood of developing type 2 DM within 5 years without inter-ventional therapeutic lifestyle changes (diet and regu-lar exercise)49 or pharmacotherapy (eg, metformin49).
Table 2 lists major recognized risk factors for type 2
DM. This patient clearly has several of these risks, as well as cutaneous evidence of impaired insulin action.
• what is the next step in the workup of this patient?
An appropriate next step would be an oral glucose tolerance test to clearly establish whether the patient has type 2 DM or IGT. Although the oral glucose tolerance test is not widely performed for the diagnosis of type 2 DM, the pretest probability of either IGT or type 2 DM in this case is very high, and precise classification may improve the ability to counsel, treat, and expec-tantly follow the patient over time. One could further consider obtaining a plasma lipid profile to look for dyslipidemia (ie, low level of high-density lipoprotein cholesterol combined with hypertriglyceridemia) and an HbA1c level, since increased cardiovascular disease
risk is conferred by an HbA1c level greater than 5%.50
CaSe Continued
The patient undergoes a 75-g oral glucose tolerance test, which reveals an FPG level of 110 mg/dL. Her glucose level 2 hours after the administration of 75-g oral glucose is 120 mg/dL. Based on these findings, the patient is diagnosed with IGT. She is advised that she is on her way to developing type 2 DM and would benefit from starting therapy with a drug that can help improve the action of insulin. Because she is obese, metformin therapy is recommended. However, the patient ulti-mately chooses not to start the medication.
One year later, the patient is referred back to the clin-ic with complaints of polyuria, polydipsia, and blurred vision. A random plasma glucose measurement is 250 mg/dL. A urine dipstick test is negative for ketones but positive for 3+ glucose. Additionally, the patient has gained 15 lb (6.82 kg) in the last year.
• what are the best management options for this pa-tient at this time?
Based on the presence of classic symptoms of hyper-glycemia (polyuria, polydipsia, blurred vision) and the confirmation of a random plasma glucose level greater than 200 mg/dL, the diagnosis of type 2 DM is now definite and unambiguous (Figure 7). In addition to renewed efforts to implement a healthy diet and exer-cise plan designed to foster weight reduction, one could consider various pharmacotherapy options, which could include insulin, metformin, a TZD, and/or an incretin. Of the available options, metformin is rational because its primary action is to impede gluconeogenesis, and it is frequently associated with a small but significant net weight loss after 12 months of treatment. Reduction
Table 2. Risk Factors for Type 2 Diabetes Mellitus
Family history of diabetes in firstdegree relative
Overweight/obesity (BMI ≥ 25 kg/m2)
Habitual physical inactivity
Race/ethnicity (eg, African American, Hispanic American, Native American, Asian American, Pacific Islander)
Previously identified IFG or IGT
History of GDM or delivery of baby weighing > 9 lb (4 kg) Hypertension (blood pressure ≥ 140/90 mm Hg)
HDL cholesterol level ≤ 35 mg/dL (0.09 mmol/L) and/or a triglyceride level ≥ 250 mg/dL (2.82 mmol/L)
Polycystic ovary syndrome or acanthosis nigricans History of vascular disease
BMI = body mass index; GDM = gestational diabetes mellitus; HDL = highdensity lipoprotein cholesterol; IFG = impaired fasting glucose; IGT = impaired glucose tolerance. (Adapted from American Diabetes Association. Standards of medical care in diabetes–2006. Diabetes Care 2006;29 Suppl 1:S6, with permission from the American Diabetes Association. Copyright © 2006 American Diabetes Association.)
Permission to electronically reproduce this table not granted by copyright holder.
in weight usually improves insulin resistance, which may in turn reduce glucolipotoxicity and improve in-sulin secretory function. TZDs improve inin-sulin action through their agonism of PPARγ, which is associated with improved GLUT-4 synthesis and activity. Incretins may promote satiety and are usually associated with durable weight loss, although the long-term effect on glucose homeostasis remains to be established.
ConCluSion
The pathogenesis of type 2 DM involves twin derange-ments of impaired insulin action (insulin resistance) and impaired (and progressive) insulin hyposecretion relative to the observed degree of hyperglycemia. In many cases of genetically susceptible prediabetic individ-uals, physical evidence of abnormal insulin action may predate overt DM by many years. Tell-tale evidence of insulin resistance includes increased FFA accumulation in myocytes and reduced GLUT-4 activity of myocytes in response to insulin receptor binding. As postprandial glycemia increases over time, defective insulin secretion from pancreatic beta cells becomes evident and culmi-nates in the most obvious expression of DM—the onset of fasting hyperglycemia. The implication of fasting hy-perglycemia is that the usual restraining effect of insulin on hepatic gluconeogenesis has been lost, perhaps on the basis of excessive FFA and/or non–insulin-mediated glucose accumulation in hepatocytes.
Historically, type 2 DM has displayed a natural his-tory of progressive failure of normal glucoregulahis-tory homeostatic mechanisms and resistance to increasingly complex pharmacotherapy targeting multiple defects. A modern and evolving strategy of care is aimed at delaying or even preventing the onset of DM in at-risk individuals by aggressively intervening with lifestyle changes known to improve insulin action and, possibly, through proven drug therapy. Preventing DM clearly offers the greatest promise for minimizing the devastat-ing complications of this ragdevastat-ing disease.
referenCeS
1. American Diabetes Association. Diabetes statistics. Available at www. diabetes.org/diabetes-statistics.jsp. Accessed 8 Feb 2007.
2. Zimmet P, Alberti KG, Shaw J. Global and societal implications of the diabetes epidemic. Nature 2001;414:782–7.
3. Nesher R, Della Casa L, Litvin Y, et al. Insulin deficiency and insulin re-sistance in type 2 (non-insulin-dependent) diabetes: quantitative contri-butions of pancreatic and peripheral responses to glucose homeostasis. Eur J Clin Invest 1987;17:266–74.
4. Grodsky GM. A new phase of insulin secretion. How will it contribute to our understanding of beta-cell function? Diabetes 1989;38:673–8. 5. Shepherd PR, Kahn BB. Glucose transporters and insulin action—
implications for insulin resistance and diabetes mellitus. N Engl J Med 1999;341:248–57.
6. Prentki M, Nolan CJ. Islet beta cell failure in type 2 diabetes. J Clin Invest 2006;116:1802–12.
7. Gerich JE. Is reduced first-phase insulin release the earliest detectable abnormality in individuals destined to develop type 2 diabetes? Diabetes 2002;51(Suppl 1):S117–21.
8. Weyer C, Bogardus C, Mott DM, Pratley RE. The natural history of insulin secretory dysfunction and insulin resistance in the pathogenesis of type 2 diabetes mellitus. J Clin Invest 1999;104:787–94.
9. Kahn SE, Halban PA. Release of incompletely processed proinsulin is the cause of the disproportionate proinsulinemia of NIDDM. Diabetes 1997;46:1725–32.
10. Roder ME, Dinesen B, Hartling SG, et al. Intact proinsulin and beta-cell function in lean and obese subjects with and without type 2 diabetes. Diabetes Care 1999;22:609–14.
11. Roder ME, Porte D Jr, Schwartz RS, Kahn SE. Disproportionately el-evated proinsulin levels reflect the degree of impaired B cell secretory capacity in patients with noninsulin-dependent diabetes mellitus. J Clin Endocrinol Metab 1998;83:604–8.
12. Kahn SE. Clinical review 135: The importance of beta-cell failure in the development and progression of type 2 diabetes. J Clin Endocrinol Metab 2001;86:4047–58.
13. Cooper GJ, Willis AC, Clark A, et al. Purification and characterization of a peptide from amyloid-rich pancreases of type 2 diabetic patients. Proc Natl Acad Sci USA 1987;84:8628–32.
14. Westermark P, Johnson KH, O’Brien TD, Betsholtz C. Islet amyloid polypeptide—a novel controversy in diabetes research. Diabetologia 1992;35:297–303.
15. Hull RL, Westermark GT, Westermark P, Kahn SE. Islet amyloid: a critical entity in the pathogenesis of type 2 diabetes. J Clin Endocrinol Metab 2004;89:3629–43.
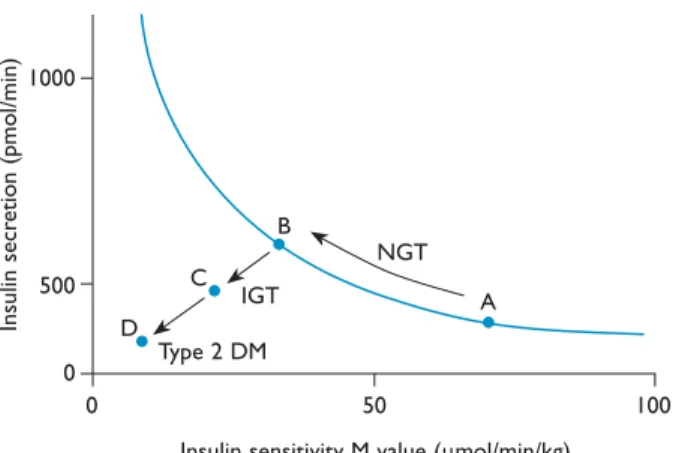
figure 7. Metabolic changes during the development of type 2 diabetes mellitus (DM). Increasing insulin resistance is illustrated by moving from point A to point B. Increased insulin resistance is associated with a corresponding increase in insulin secretion. It is once this compensatory mechanism fails that progression to impaired glucose tolerance (IGT) and ultimately type 2 DM occur. NGT = normal glucose tolerance. (Adapted with permission from Powers AC. Diabetes mellitus. In: Jameson JL, editor. Harrison’s en docrinology. New York: McGrawHill Publishing Division; 2006:291. © 2006 The McGrawHill Companies, Inc.)
NGT Type 2 DM IGT A B C D 100 50 0 0 1000 500
Insulin sensitivity M value (mmol/min/kg)
Insulin secr etion (p m ol/ m in)
16. Wilding JP, Khandan-Nia N, Bennet WM, et al. Lack of acute effect of amylin (islet associated polypeptide) on insulin sensitivity during hyperinsulinaemic euglycaemic clamp in humans. Diabetologia 1994; 37:166–9.
17. Bennet WM, Beis CS, Ghatei MA, et al. Amylin tonally regulates arginine-stimulated insulin secretion in rats. Diabetologia 1994;37:436– 8.
18. Matthews DR, Cull CA, Stratton IM, et al. UKPDS 26: Sulphonylurea failure in non-insulin-dependent diabetic patients over six years. UK Prospective Diabetes Study (UKPDS) Group. Diabet Med 1998;15: 297–303.
19. Pimenta W, Korytkowski M, Mitrakou A, et al. Pancreatic beta-cell dys-function as the primary genetic lesion in NIDDM. Evidence from stud-ies in normal glucose-tolerant individuals with a first-degree NIDDM relative. JAMA 1995;273:1855–61.
20. Gerich JE. Contributions of insulin-resistance and insulin-secretory defects to the pathogenesis of type 2 diabetes mellitus. Mayo Clin Proc 2003;78:447–56.
21. Lillioja S, Mott DM, Spraul M, et al. Insulin resistance and insulin secre-tory dysfunction as precursors of non-insulin-dependent diabetes mel-litus. Prospective studies of Pima Indians. N Engl J Med 1993;329:1988– 92.
22. DeFronzo RA. Pathogenesis of type 2 diabetes mellitus. Med Clin North Am 2004;88:787–835, ix.
23. Magnusson I, Rothman DL, Katz LD, et al. Increased rate of gluconeo-genesis in type II diabetes mellitus. A 13C nuclear magnetic resonance study. J Clin Invest 1992;90:1323–7.
24. Gastaldelli A, Baldi S, Pettiti M, et al. Influence of obesity and type 2 dia-betes on gluconeogenesis and glucose output in humans: a quantitative study. Diabetes 2000;49:1367–73.
25. Ludvik B, Nolan JJ, Roberts A, et al. Evidence for decreased splanch-nic glucose uptake after oral glucose administration in non-insulin- dependent diabetes mellitus. J Clin Invest 1997;100:2354–61. 26. Bonadonna RC, Del Prato S, Bonora E, et al. Roles of glucose transport
and glucose phosphorylation in muscle insulin resistance of NIDDM. Diabetes 1996;45:915–25.
27. Bonadonna RC, Del Prato S, Saccomani MP, et al. Transmembrane glu- cose transport in skeletal muscle of patients with non-insulin-dependent diabetes. J Clin Invest 1993;92:486–94.
28. Choi WH, O’Rahilly S, Buse JB, et al. Molecular scanning of insulin-responsive glucose transporter (GLUT4) gene in NIDDM subjects. Diabetes 1991;40:1712–8.
29. Caro JF, Sinha MK, Raju SM, et al. Insulin receptor kinase in human skeletal muscle from obese subjects with and without noninsulin depen-dent diabetes. J Clin Invest 1987;79:1330–7.
30. Nolan JJ, Freidenberg G, Henry R, et al. Role of human skeletal muscle insulin receptor kinase in the in vivo insulin resistance of noninsulin-dependent diabetes mellitus and obesity. J Clin Endocrinol Metab 1994;78:471–7.
31. Cusi K, Maezono K, Osman A, et al. Insulin resistance differentially affects the PI 3-kinase- and MAP kinase-mediated signaling in human muscle. J Clin Invest 2000;105:311–20.
32. Pendergrass M, Koval J, Vogt C, et al. Insulin-induced hexokinase II ex-pression is reduced in obesity and NIDDM. Diabetes 1998;47:387–94. 33. Ducluzeau PH, Perretti N, Laville M, et al. Regulation by insulin of gene
expression in human skeletal muscle and adipose tissue. Evidence for specific defects in type 2 diabetes. Diabetes 2001;50:1134–42. 34. Lehto M, Huang X, Davis EM, et al. Human hexokinase II gene:
exon-intron organization, mutation screening in NIDDM, and its relation-ship to muscle hexokinase activity. Diabetologia 1995;38:1466–74. 35. Groop LC, Bonadonna RC, Simonson DC, et al. Effect of insulin on
oxidative and nonoxidative pathways of free fatty acid metabolism in human obesity. Am J Physiol 1992;263(1 Pt 1):E79–84.
36. Groop LC, Bonadonna RC, Del Prato S, et al. Glucose and free fatty acid metabolism in non-insulin-dependent diabetes mellitus. Evidence for multiple sites of insulin resistance. J Clin Invest 1989;84:205–13. 37. Boden G. Role of fatty acids in the pathogenesis of insulin resistance
and NIDDM [published erratum appears in Diabetes 1997;46:536]. Diabetes 1997;46:3–10.
38. Itani SI, Ruderman NB, Schmieder F, Boden G, et al. Lipid-induced insulin resistance in human muscle is associated with changes in diacylglycerol, protein kinase C, and IkappaB-alpha. Diabetes 2002;51: 2005–11.
39. Ellis BA, Poynten A, Lowy AJ, et al. Long-chain acyl-CoA esters as indicators of lipid metabolism and insulin sensitivity in rat and human muscle. Am J Physiol Endocrinol Metab 2000;279:E554–60.
40. Schmitz-Peiffer C, Craig DL, Biden TJ. Ceramide generation is suf-ficient to account for the inhibition of the insulin-stimulated PKB pathway in C2C12 skeletal muscle cells pretreated with palmitate. J Biol Chem 1999;274:24202–10.
41. Withers DJ, Gutierrez JS, Towery H, et al. Disruption of IRS-2 causes type 2 diabetes in mice. Nature 1998;391:900–4.
42. Lin X, Taguchi A, Park S, et al. Dysregulation of insulin receptor sub-strate 2 in beta cells and brain causes obesity and diabetes. J Clin Invest 2004;114:908–16.
43. Horikawa Y, Oda N, Cox NJ, et al. Genetic variation in the gene encod-ing calpain-10 is associated with type 2 diabetes mellitus [published er-ratum appears in Nat Genet 2000;26:502]. Nat Genet 2000;26:163–75. 44. Baier LJ, Permana PA, Yang X, et al. A calpain-10 gene polymorphism
is associated with reduced muscle mRNA levels and insulin resistance. J Clin Invest 2000;106:R69–73.
45. Walston J, Silver K, Bogardus C, et al. Time of onset of non-insulin- dependent diabetes mellitus and genetic variation in the beta 3- adrenergic-receptor gene. N Engl J Med 1995;333:343–7.
46. Deeb SS, Fajas L, Nemoto M, et al. A Pro12Ala substitution in PPAR-gamma2 associated with decreased receptor activity, lower body mass index and improved insulin sensitivity. Nat Genet 1998;20:284–7. 47. Petersen KF, Dufour S, Befroy D, et al. Impaired mitochondrial activity
in the insulin-resistant offspring of patients with type 2 diabetes. N Engl J Med 2004;350:664–71.
48. Legro RS. Diabetes prevalence and risk factors in polycystic ovary syn-drome. Obstet Gynecol Clin North Am 2001;28:99–109.
49. Knowler WC, Barrett-Conner E, Fowler SE, et al; Diabetes Preven-tion Program Research Group. ReducPreven-tion in the incidence of type 2 diabetes with lifestyle intervention or metformin. N Engl J Med 2002; 346:393–403.
50. Khaw KT, Wareham N, Bingham S, et al. Association of hemoglobin A1c with cardiovascular disease and mortality in adults: The European prospective investigation into cancer in Norfolk. Ann Intern Med 2004; 141:413–20.