Data Integration for Spatio-Temporal Patterns of Gene Expression of
Zebrafish development: the GEMS database
Mounia Belmamoune1,2and Fons J. Verbeek1
1Section Imaging and Bioinformatics, Leiden Institute of Computer Science (LIACS), Leiden University, The Netherlands
Summary
The Gene Expression Management System (GEMS) is a database system for patterns of gene expression. These patterns result from systematic whole-mount fluorescent in situ hy-bridization studies on zebrafish embryos. GEMS is an integrative platform that addresses one of the important challenges of developmental biology: how to integrate genetic data that underpin morphological changes during embryogenesis. Our motivation to build this system was by the need to be able to organize and compare multiple patterns of gene ex-pression at tissue level. Integration with other developmental and biomolecular databases will further support our understanding of development. The GEMS operates in concert with a database containing a digital atlas of zebrafish embryo; this digital atlas of zebrafish development has been conceived prior to the expansion of the GEMS. The atlas contains 3D volume models of canonical stages of zebrafish development in which in each vol-ume model element is annotated with an anatomical term. These terms are extracted from a formal anatomical ontology, i.e. the Developmental Anatomy Ontology of Zebrafish (DAOZ). In the GEMS, anatomical terms from this ontology together with terms from the Gene Ontology (GO) are also used to annotate patterns of gene expression and in this manner providing mechanisms for integration and retrieval . The annotations are the glue for integration of patterns of gene expression in GEMS as well as in other biomolecular databases. At the one hand, zebrafish anatomy terminology allows gene expression data within GEMS to be integrated with phenotypical data in the 3D atlas of zebrafish develop-ment. At the other hand, GO terms extend GEMS expression patterns integration to a wide range of bioinformatics resources.
Keywords: Databases Integration, patterns of Gene Expression, Fluorescent in situ Hy-bridization, Ontology, Zebrafish, 3D models.
1
Introduction
Patterns of gene expression are studied in all major animal model systems in a systematic manner and the data resulting from gene expression studies are stored into a range of model or-ganism databases. The major databases are FlyBase [1] for Drosophila, MEPD [2] for medaka, GXD [3] and EMAGE [4] for mouse and ZFIN [5] for zebrafish. In our work we focus on patterns of gene expression resulting from developmental processes involving both molecular (transcription) and morphological (genotype) data. This data clearly have a spatio-temporal signature.
In this paper we present the design and implementation of a repository for patterns of gene expression in zebrafish derived from 3D images, i.e. the Gene Expression Management System
(GEMS) [6]. This system aims to be an integrative database for spatio-temporal patterns of gene expression with other bio-molecular databases, crucially important for an efficient use and exchange of gene expression resources. For zebrafish a central repository for true 3D patterns of gene expression is needed. We therefore investigated integration of 3D patterns of gene expression with bimolecular databases; first to link image information with genomic information and second to study interoperability between genomics model systems.
Zebrafish is an important model organism used in molecular genetics and developmental biol-ogy; it serves as a model for understanding normal vertebrate development as well as dissect-ing the mechanisms underlydissect-ing human diseases. As a vertebrate model, zebrafish has many advantages: small size, ease of culture and transparent embryos. Moreover, many aspects of vertebrate development can be compared with zebrafish.
In our work we focus on 3D spatio-temporal patterns of gene expression in zebrafish which are generated through Fluorescent in situ Hybridisation (FISH). We have specifically improved and adapted a FISH-protocol for the imaging of whole mount zebrafish embryos using the Confocal Laser Scanner Microscope (CLSM): i.e. ZebraFISH [7]. Each CLSM image is a 3D multi-channel image taken from a whole mount specimen containing the outline of the embryo and the pattern of gene expression in separate channels. However, the patterns of gene expression are not restricted to the zebraFISH protocol. It is the intention to accommodate different kinds of protocols so that patterns of gene expression can either be the result of FISH, or transgenic lines (GFP-like) or immunohistochemisty (product related). With respect to 3D CLSM images resulting from zebraFISH, the GEMS repository realizes storage, retrieval and mining of these patterns of gene expression, in coherence with their spatial and temporal characteristics. For this particular domain the GEMS aims complementing the comprehensive Zebrafish Informa-tion Network (ZFIN) [5] as a platform integrating zebrafish 3D spatio-temporal patterns of gene expression. Data annotation is a crucial aspect of the GEMS and this is accomplished through the integration of two domain ontologies: the Developmental Anatomy Ontology of Zebrafish (DAOZ) [8] and the Gene Ontology (GO) [9].
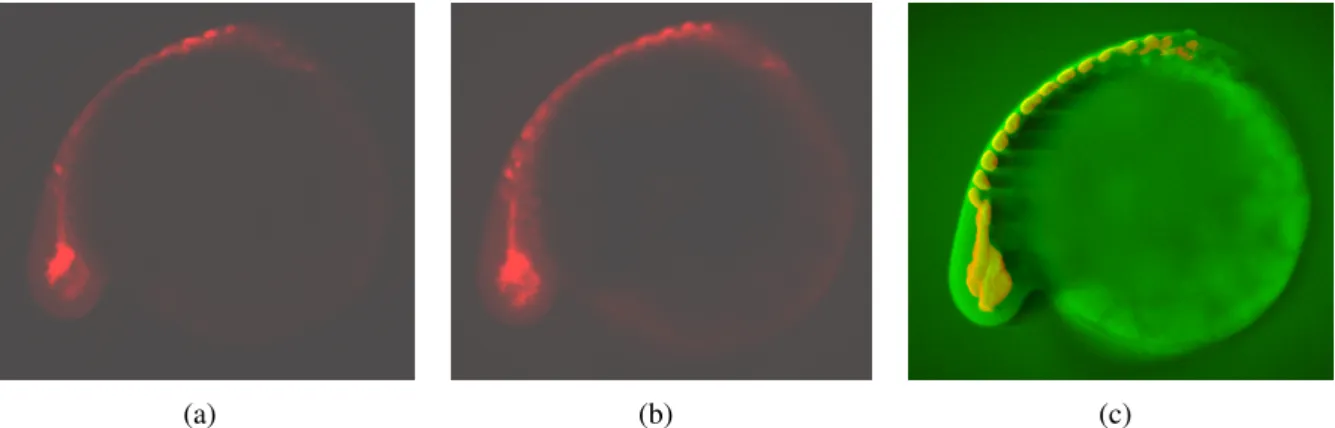
One of the important challenges in developmental and molecular genetics is to determine how genes interact to control biological processes. In developmental biology, this task is even more challenging since one attempts to understand the complex genetic process underlying develop-ment [10, 11]. Identifying both temporal and spatial aspects of gene expression in developdevelop-ment is a critical initial step to prepare the groundwork for additional functional analysis of genes. To this respect, the microarray technique is one of the major experimental breakthroughs enabling high throughput measurement and analysis of the expression patterns of (tens of) thousands of genes simultaneously [12]. In case of model organisms, the analysis of whole-specimen microarray gene expression data does not give a sufficiently specific spatial profile. In multi-cellular organisms such as the zebrafish, gene expression influences and/or directs the devel-opmental status of a cell or group of cells. Whole-specimen microarray analysis can therefore not fully document the spatio-temporal relations. Whole mount in situ hybridization can be used to obtain such information. 2D images are most commonly used and easier to acquire, using standard in situ hybridization. However, this may not be sufficient in describing complex phenomena as development. 3D images are used to obtain a comprehensive description of the spatio-temporal relations and have the additional advantage that internal anatomy can included in the visualization. For a range of marker genes zebraFISH in situ’s have been done and the resulting 3D images (cf. figure 1) are stored in the GEMS database. The 3D patterns of gene expression are available as “raw” image data and in some cases also 3D graphical models [13] are extracted from the 3D images and are made available.
(a) (b) (c)
Figure 1: The zebrafish gene expression pattern of the MyoD gene at 24 hours post fertilization (hfp). (a) shows one slice of a 3D image, (b) shows a projection of the 3D image onto one 2D image and (c) a 3D visualization of both channels of the 3D image, i.e. the pattern in the context of the whole zebrafish embryo. The expression gene, i.e. MyoD is involved in development of vertebra and musculature.
First of all, GEMS is a database that is set out to manage data in a broader context. The key to success of any database is the existence of an appropriate semantic framework for its data storage and retrieval. 3D patterns provide gene expression information within a spatio-temporal context therefore, this kind of data when stored in the database, require both gene and spatial information for its description. For gene information, i.e. the gene name and gene symbol, the GEMS uses concepts from the controlled vocabulary provided by GO. The consistency for anatomical and temporal terms underlying pattern description is provided by the DAOZ, describing the developmental anatomy of the zebrafish (cf. 2.1.3) [14].
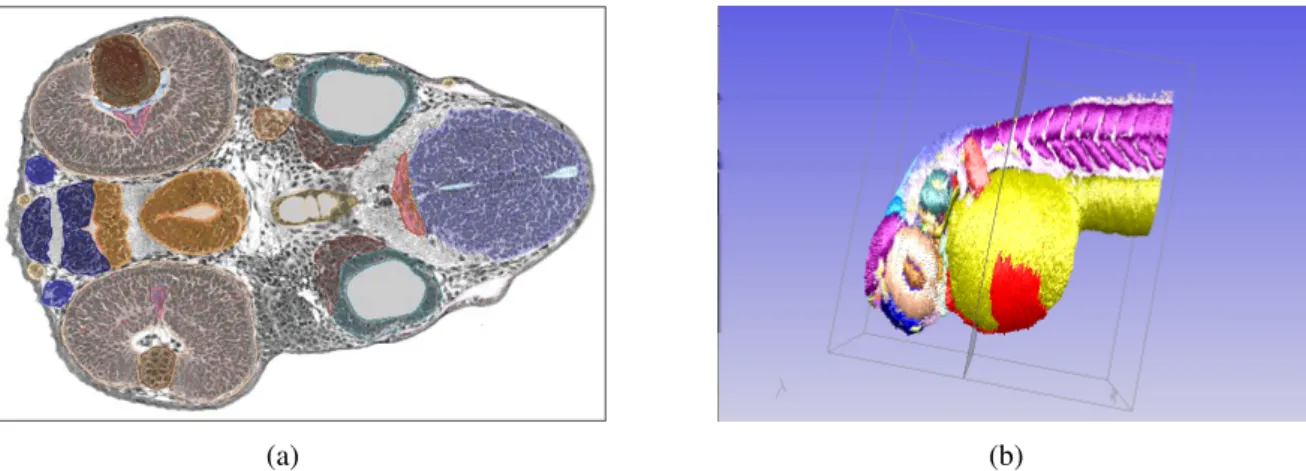
In order to understand development, pattern formation as well as the analysis of patterns of gene expression, we have developed a 3D digital atlas of zebrafish development (cf. figure 2) [15]. This atlas serves as a reference framework for researchers. Additionally, it is intended to serve as a model to map patterns of gene expression. In the 3D atlas, canonical developmental stages are completely described as a volumetric model in which every volume element is attributed to an anatomical structure. The atlas is built from serial sections processed to visualize standard histology. In the atlas, each 3D model is the result of 3D reconstruction of section images in which each anatomical structure is delineated by a contour; a.k.a. the graphical annotation and each anatomical domain is associated with an anatomical name representing the semantic annotation [16, 17, 18].
Underlying the 3D digital atlas and the GEMS is the DAOZ that provides consistency for the anatomical terms as well as the temporal “staging” information of the embryo. Consequently, the GEMS and the 3D atlas are addressed with the same unique terms. Importantly, for the un-derstanding of the pattern, specimen preparation, probe information and imaging conditions are also stored as separate annotations to the 3D image. We consider this information fundamental for comparison in the retrieval phase. Furthermore the system assigns several system metadata to further enhance organization and management of the data.
The microarray technology is based on the analysis of expression of thousands of genes simul-taneously but can not provide accurate spatial information on where a gene is expressed. Whole mount (fluorescent) in situ hybridisation experiments enable visualization and localization of a limited number of gene expression patterns at a time. This is due to, amongst other things, limitations on the number of CLSM channels that can be used simultaneously. Combinatorial
(a) (b)
Figure 2: A 48 hpf zebrafish embryo from the 3D atlas. (Left) 2D section where each anatomical structure is annotated semantically with an anatomical term from the DAOZ and graphically by a contour. (Right) The 3D model resulting from 3D reconstruction from serial sections.
relationships, as embedded in ontologies, support retrieval of information and allow interpreting several “in situ” experiments. The annotation of GEMS data on the basis of structured ontolo-gies is therefore quintessential for both retrieval and mining. So, providing access to collections of well annotated gene expression patterns is a very powerful feature of the GEMS and it con-tributes a solution to throughput issues that exist in (3D) whole mount in situ hybridization. Within GEMS we are able to cluster several co-expressed/localized patterns and, in this man-ner, it can be possible to reveal relations between genes. Moreover, the uniform annotation of the gene expression data with ontology terms allows cross-reference with other resources thus facilitating cross-model system comparative studies and analysis of patterns gene expression. The specific aim of a spatio-temporal information management system for gene expression is that it refers to all relevant information within a model system, i.e. zebrafish, and directly links to all relevant other information systems, i.e. biomolecular databases. In that manner, a semantic model is built while adding information to the system. We have taken this into account in our design and implementation of the GEMS; it establishes an integrative spatio-temporal information system by making expression patterns available to the scientific community as well as interoperable with other bioinformatics resources.
2
Material and Methods
In this section, we discuss the pattern annotation, the metadata and the system architecture in two separate subsections.
2.1 Pattern annotation
One of the important advantages of storing data in a database is the aptitude to query the data and compare results in an accurate manner. The accuracy can however, only be achieved if the stored data itself is accurately controlled. Comparison of biological data is often hampered by the lack of nomenclature standards. We used ontologies [19, 20] to provide a standardized set of in situ’s (zebraFISH) images prepared with the same experimental protocol and described with
common nomenclature. We used DAOZ to provide a common vocabulary of terms to describe the different anatomical features of the zebrafish embryo and the different stages of embryonic development. Furthermore, we used GO to describe the expressed genes in the images.
The standard workflow for annotation of a gene expression pattern is to establish the experi-mental conditions, then the official gene name and subsequently finding when and where the gene is expressed. In terms of workflow, this is in a way working backward; as we know the developmental stage, the material as well as the probe in the experiment. The experimental parameters are the noteworthy information to have available. The aforementioned workflow will be further elaborated in the next three sections.
2.1.1 Protocol and Imaging conditions
In the context of organizing data with controlled annotations, we adhere as much as possible to standardize FISH and imaging protocols as a basis for accurate and complete pattern annotation. 3D patterns of gene expression are generated through the zebraFISH. Specimen and image preparation as well as the imaging settings represent crucial information to understand and compare the images containing patterns of gene expression.
The “in situ” hybridization protocols as well as the imaging settings parameters are part of the submitted data. By including the experimental data as part of the submission, we are able to keep track of small adoptions to the protocol. The submission follows the standard protocol for which XML [21] templates were created.
2.1.2 Gene Ontology
Patterns of gene expression in the images are annotated with terms from one of the most com-prehensive ontologies within the bioinformatics community: the Gene Ontology (GO) [22]. The GO project is a collaborative effort to construct and use ontologies to facilitate the biolog-ically meaningful annotation of genes and their products in a wide range of organisms. The GO provides an organized vocabulary, or ontology, for the description of attributes of genes and gene products, in three key domains that are shared by all organisms, namely molecular function, biological process and cellular component.
Using the GO vocabulary contributes to data integration and in particular of the 3D patterns of gene expression with other repositories. It helps in the clarification of relationships among genes in zebrafish and between zebrafish and other model organisms. The GO is regularly updated which allows the 3D patterns annotation with up-to-date GO terminology. To extend our data integration we are investigating the possibility to use, as a supplement the species-specific annotation sets provided by GO annotation (GOA) maintained separately from the GO at EBI [23]. The GOA set will enable GO terms in GEMS to be related to other species-specific resources.
2.1.3 Developmental Anatomy Ontology of Zebrafish
The Zebrafish Information Network, i.e. ZFIN [7] provides an approved and standard anatom-ical vocabulary of zebrafish. The DAOZ restructured the ZFIN vocabulary by introducing new
concepts and relationships. The DAOZ is a task-oriented ontology for annotation [14]. Its concepts and relationships are organized in a database system, i.e. DAOZ database, used to de-scribe the spatial, temporal and functional characteristics of the 3D images of both the GEMS and the 3D atlas. DAOZ concepts and relationships are also used for retrieval. Therefore, images sharing similar pattern characteristics such as spatial, temporal and/or functional infor-mation could be grouped into large units which are very important for further comparison and analysis.
A substantial part of the anatomical terms are similar for each species; therefore using DAOZ terms annotation enables searching one database and also switching transparently from one species to another. In some cases, a mapping of anatomical concepts is necessary and tools to realize such mappings have been implemented [24]. A mapping can be necessary due to differences in developmental timing or the due to homologous relationships (e.g. gill vs. lung). Patterns from GEMS could, in principle be integrated with other developmental databases for comparison. In this manner the strength of the zebrafish as a model system could be better explored.
2.1.4 System administration
The GEMS manages images storage and retrieval based on administration metadata. These metadata include settings about who are allowed to submit, view and/or manipulate the data. To date, the system distinguishes three groups of users, i.e. guest users, group members and system administrators. The group members are organized per laboratory. Users having access right are allowed to submit data to the system. They are also allowed to view all data stored in the GEMS. Unregistered users are limited to view images based on permissions assigned to the images.
3
Implementation
In this paragraph we address the design and system architecture. The GEMS [25] is imple-mented using the Model –View-Controller (MVC) as a design model (cf. figure 3) and Java as programming language The MVC design model implies that the GEMS consists of three components: a central Model, Views that represent the model to the user and Controllers of the model.
The Model is where the logic of the application resides—including the data Model and any proprietary processing that must be applied to this data. The View is the application as the user observes it, i.e. the layout or Graphical User Interface (GUI) in which the user can en-ter data into the program, get feedback and view/explore results. The GUI of GEMS is an HTML/XML/XSL based visual display interacting with the server through servlets and java server pages [26]. The Controller is responsible for responding to user actions. In our case, a user action is a page request. The controller determines what request is being made and re-sponds appropriately by triggering the model to manipulate the data appropriately and passing the model into the view.
Through the application model, the databases are accessed. The GEMS uses three databases. The main application database contains information about users and system administrators.
This information is needed to manage access to the system. Additionally, this database includes tables with descriptive metadata of the images, image URL’s as well as experimental protocols. The other two databases contain the annotation resources of the GEMS, i.e. DAOZ and GO. We are using PostgreSQL [27] as the Relational DataBase Management System (RDBMS) for the GEMS while MySQL [28] servers are used as the RDBMS for the DAOZ and GO databases. We opted for PostgreSQL which offers a high transactional performance, to allow complex queries to be performed against the GEMS database. The GO database is straightforwardly built from MySQL dumps as downloaded from the GO website [9] . This was our main motivation to use MySQL as the RDBMS for both annotation databases. Both GO and DAOZ databases are periodically updated.
The experimental protocol is submitted as part of pattern annotation. Its submission follows the standard ‘in situ’ protocol. This protocol is always subject to change as improvements are applied. Therefore, a flexible storage format is needed. To this end, we used XML [21] format so that a markup document could be designed and altered according to our specific needs. XSL [21] is used so that a web-browser can be used to present the XML data. For the ZebraFISH protocol, XML templates were created. The XML data is presented as a fill-in form where the user only has to indicate if deviations were made from the standard. From these fill-in forms, the system generates XML files that represent the lab-notebook on the experimental protocol.
The 3D CLSM images are of high resolution (>=10242) and can be up to 300 MB. We there-fore have chosen the file system of the server above the database as a central repository for these 3D data. The image URL’s are subsequently saved in the database. Consequently, the GEMS database would not grow as dramatically as it would if we stored the images in a BLOB field. The experimental protocol,i.e. XML files are also stored in the file system. From the CLSM (e.g. Leica) the imaging conditions are obtained, i.e. acquisition properties in an XML format. Through the GEMS submission interface, these data are uploaded with the images and is also stored in the file system. The GEMS database is designed to contain storage tables for 3D images descriptive metadata. When a submission is accomplished, the system automati-cally notifies the system administrators by sending an email containing information about both the submitted data (e.g. the assigned IDs) and the submitter (e.g. Name and group). This notification enables data tracking and review which is essential for quality control.
The GEMS as a repository, is suitable for discovery of relations between genes. To that end, we implemented pattern recognition agents in java. These applications are connected to the database and after each submission the results are updated autonomously [29]. This shows that the GEMS is a true dynamic repository.
4
Results
DAOZ as well as GO are based on the biological vocabularies and establish precise defined relationships between concepts. 3D patterns of gene expression — annotated using ontology-based concepts — inherit all characteristics and relationships that these concepts possess. This situation is exploited to cluster several “in situ” experiments and obtain information on co-localization/expression of genes which is necessary for data interpretation. Patterns could be clustered using tissue information, i.e. spatial, functional information and/or stages of develop-ment.
Figure 3: The Model-View – Controller architecture of the GEMS.
We implemented methods to search the gene-expression data. These methods enable construc-tion of SQL queries by interactive selecconstruc-tion of concepts (cf. figure 4). The first method [30] can be utilized to search for the expression patterns of an individual gene of interest. (e.g. “Provide me with expression information of gene X (e.g. fgf8)?”) (cf. figure 4(a)). The second method [31] is used to cluster sets of patterns using information such as: functional system, spatial location and/or stage of development (e.g. “What patterns are co-expressed in head, belong to the central nervous system and present at prim 5)? (cf. figure 4(b)).
Sets of genes and their corresponding expression patterns can also be grouped on the basis of combinatorial search actions based on patterns spatial locations, functionality and stages of embryonic development. The system processes the constructed queries and returns image thumbnails. Each thumbnail image represents an active sub-query to generate an interactive
(a) (b)
Figure 4: Search results from: (a) Search option using gene symbol. (b) Search option using concepts from DAOZ.
page. This page will contain more details about the expression pattern as well as active links to related information in external databases (cf. figure 6). On the level of database administration there exist always the possibilities of free form SQL queries using the PostgreSQL transactional features.
(a) (b)
Figure 5: This figure shows the mapping between the 3D atlas and the GEMS. (a) A 2D section from a 3D model; it serves as a query interface. Users choose and click on an anatomical structure. This action is translated into a query (e.g. what patterns are expressed in spatial location X at time Y?). This query is executed against the GEMS database and a list of patterns of gene expression is listed. Each pattern is linked to GEMS database. (b) From the patterns list, a detailed view of a pattern could be displayed.
The 3D volume images of zebrafish embryos in both the GEMS and the 3D atlas are annotated with the same spatial and temporal information, i.e. DAOZ concepts which enable both systems integration. The integration of biological process data from GEMS and phenotypic data in the 3D atlas is usually employed to study and analyze development. To illustrate this situation we designed and implemented the 3D Visual Query system (3D-VisQus) (cf. figure 5) [32]. This system allows mapping patterns onto the atlas. It represents an advanced form of querying the GEMS through atlas 3D models.
The 3D Atlas Browser [15] with a number of visualization methods enables 2D/3D atlas data to be explored. The 3D-VisQus is an extension to that atlas browser. It allows query generation
(a) (b)
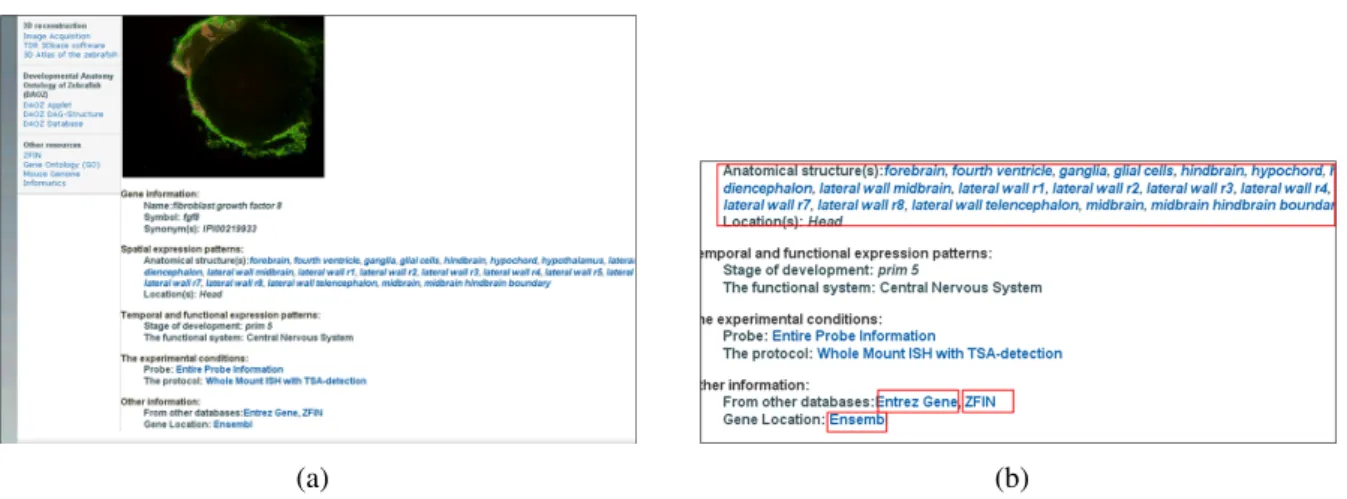
Figure 6: (a) The detailed view of a datasheet of a pattern of gene expression provides active links ((b) indicated with red boxes) for related information in ZFIN, Entrey Gene and Ensembl.
based on the visual understanding of the data. Queries can be composed based on semantic and graphical annotations of the visualized atlas images. This allows users to search the GEMS for appropriate 3D patterns of gene expression (cf. figure 5). A 2D view of one particular stage represents a user interface portal with two major features. On one hand, it is used as a browser for section images to get more insight in the 3D models anatomy. On the other hand, a selected anatomical domain in a section image is used to generate a query such as: “What patterns have gene expression in spatial location X at time Y?” which is then executed against the GEMS database. The 3D-VisQus acts therefore as an easy portal from the atlas to the GEMS.
On the basis of its annotation, the GEMS serves as a directory to gene and spatio-temporal specific information for other databases (cf. figure 6). The official gene symbol, as extracted from GO database during pattern annotation, facilitates direct links to several databases. In our case we provide a direct link to Entrez Gene database. Entrez Gene, developed by the National Center for Biotechnology Information (NCBI) [33], is a repository containing gene specific information. Each Entrez Gene record represents a single gene from a given organism, and provides a wide range of information such as nomenclature, chromosomal localization, gene products, markers, phenotypes, molecular interaction and many more. For the GEMS, each 3D image of an expression pattern is directly linked to a summary page within NCBI’s Entrez Gene. The summary page allows gene-specific links to many other resources within and outside the NCBI’s Entrez system. This integration can be exploited to process the information stored in these databases and retrieve relations in the data through machine learning mechanisms. DAOZ spatial and temporal concepts allow gene expression patterns in GEMS to be directly linked to gene expression data stored in ZFIN which maintains references of zebrafish research information and links to other model organism databases. The development of our system is complementary to ZFIN and fully interoperable with it. Finally, to map the expressed gene to a more detailed gene report and genomic location, a direct link is established to Ensembl database [34].
GEMS is a system in development. To date, it contains more than one hundred gene expression patterns and submission of data to the system will continue; GEMS is made available to several research groups for data submission. For information retrieval, unregistered users do not need access authentication or specific software to address the GEMS.
5
Conclusion and Discussion
Identifying the temporal, spatial and functional expression patterns of genes during develop-ment is a critical initial step to understand genetic networks that underpin embryogenesis pro-cesses. In this paper we presented our approach to organize 3D gene expression data within an integrative platform, i.e. the GEMS and showed examples on how it is made accessible for researchers.
The microarray technology based on simultaneous study of co-expression of (tens of) thou-sands of genes; however, this technique lacks sufficient and precise spatial information of the expression domain. FISH provides the spatial visualization and localization of gene expression at a given time point, its throughput, however with respect to the number of genes is low. With the GEMS we were able to bridge the gap of time and space issues of gene expression patterns. Patterns of gene expression are annotated with time and space binding concepts allowing more experiments to be clustered as co-localized/expressed microscope experiments.
The GEMS includes well-structured and approved domain ontologies, i.e. the DAOZ and GO. The DAOZ is used to annotate 3D spatio-temporal data in the GEMS and the 3D digital atlas of zebrafish. Data from GEMS and the 3D atlas can therefore be addressed with the same unique concepts. It becomes possible to move in a seamless way from one system to the other and this situation has been illustrated with the design and development of the 3D-VisQus. This system demonstrates clearly the interoperability between patterns of gene expression in GEMS and 3D models in the 3D atlas database.
GEMS interoperability is of course not limited to the atlas but it is easily extended to other resources. The DAOZ includes similar anatomical nomenclature as the Zebrafish Anatomy On-tology which facilitates the integration of GEMS and ZFIN data. The integration of the GEMS with other resources is extended with GO terminology. GO terms enable integration of GEMS objects with a range of bioinformatics resources such as NCBI and Ensembl. Cross-references with these resources imply integration with a wealth of bioinformatics databases leading to an increase of scientific benefit of our data. To enhance data exchange with a broad range of re-sources, research has been initiated to extend our patterns annotation with the species-specific annotation sets provided by GOA and to use a Distributed Annotation System (DAS) [35] server to enable a straightforward integration of GEMS gene expression information into Ensembl. Our study shows an example on how to design and implement an integrative information system for 3D spatio-temporal gene expression patterns and go beyond just storing and retrieving data, i.e. clustering and integrating information. Co-localized/expressed genes could be clustered given their spatial and temporal information. This approach will pave the way for finding new relations between genes. To that end, machine learning techniques can be applied to GEMS data. We have started experiments with existing algorithms to derive association rules between frequent item sets [29, 36]. Given that an association exists, one might easily infer that the genes involved participate in some type of network/pathway. Identification of such association rules is our initial step toward analysis of genetic networks. The experiments and evaluation of the algorithms in this context are part of our future work.
Several search query interfaces have been made available. The actual search results are dis-played as image generated from visualizations as projections. This operation is applied to show whole mount multi-channel content in one single color image. 3D images from the CLSM slices can be further processed with TDR-3Dbase software [17, 16]. This software produces
3D models and visualizes the spatial characters of gene expression pattern. These 3D mod-els can be viewed with our dedicated 3D browsers [15] that we will embed in the GEMS for additional 3D gene expression pattern visualization
The GEMS has been successfully applied for zebraFISH 3D data storage and retrieval. The GEMS has been designed to be flexible for extension. More protocol templates, such as GFP-like as well as additional annotation resources must be embedded in the system to allow its usage in a broader context
Acknowledgments
The authors would like to express gratitude to Dr. M.C. Welten, W. Spoor and A. Sels for their contributions by submitting experimental data to the system. This work is supported by Netherlands’ council for Scientific Research (NWO), grant #050.50.213 (Bio Molecular Informtics).
References
[1] G. Grumbling and V. Strelets. FlyBase: anatomical data, images and queries. Nucleic Acids Research, 34(Database Issue):D484–D488, 2006.
[2] T. Henrich, M. Ramialison, B. Wittbrodt, B. Assouline, F. Bourrat, A. Berger, H. Himmel-bauer, T. Sasaki, N. Shimizu, N. Shimizu, M. Westerfield, H. Kondoh, and J. Wittbrodt. MEPD: a resource for medaka gene expression patterns. Bioinformatics, 21(14):3195– 3197, 2005.
[3] C. M. Smith, J. H. Finger, T. F. Hayamizu, I. J. McCright, J. T. Eppig, J. A. Kadin, J. E. Richardson, and M. Ringwald. The mouse gene expression database (GXD): 2007 update.
Nucleic Acids Research, 35(Database issue):D618–D623, 2007.
[4] J. H. Christiansen, Y. Yang, S. Venkataraman, L. Richardson, P. Stevenson, N. Bur-ton, R. A. Baldock, and D.R. Davidson. EMAGE: a spatial database of gene expres-sion patterns during mouse embryo development. Nucleic Acids Research, 34(Database Issue):D637–D641, 2006.
[5] Zebrafish Information Network (ZFIN). http://zfin.org.
[6] The Gene Expression Management System (GEMS). http://bio-imaging.liacs. nl/gems/.
[7] M. C. M. Welten, S. De Haan, N. van den Boogert, J. N. Noordermeer, G. Lamers, H. P. Spaink, A. H. Meijer, and F. J. Verbeek. ZebraFISH: Fluorescent in situ hybridization protocol and 3D images of gene expression patterns. Zebrafish, 3(4):465–476, 2006. [8] The developmental anatomy ontology of zebrafish. http://bio-imaging.liacs.nl/
liacsontology.html.
[10] Scott F. Gilbert and Susan R. Singer. Developmental Biology. Palgrave Macmillan, 8 edition, 2006.
[11] Wouter Meuleman, C. M. Welten Monique, and Fons J. Verbeek. Computational Life Sciences II, volume 4216 of Lecture Notes in Computer Science, chapter Construction of Correlation Networks with Explicit Time-Slices Using Time-Lagged, Variable Interval Standard and Partial Correlation Coefficients, pages 236–246. Springer Berlin/ Heidel-berg, 2006.
[12] D. E. Basset, M. B. Eisen, and M.S. Boguski. Gene expression informatics – it’s all in your mine. Nature Genetics, 21:51–55, 1999.
[13] M. C. M. Welten, A. Sels, M. I. van den Berg-Braak, G. E. M. Lamers, H. P. Spaink, and F. J. Verbeek. Expression analysis of the genes encoding 14-3-3 gamma and tau proteins using the 3D digital atlas of zebrafish development. Submitted, 2008.
[14] M. Belmamoune and F.J. Verbeek. Developmental anatomy ontology of zebrafish: an integrative semantic framework. Journal of Integrative Bioinformatics, 4(3), 2007. [15] The 3D atlas of zebrafish. http://bio-imaging.liacs.nl/liacsatlas.html. [16] F. J. Verbeek and P. J. Boon. High resolution 3D reconstruction from serial sections.
mi-croscope instrumentation, software design and its implementations. InProceeding of The International Society for Optical Engineering: Three Dimensional and Multi Dimensional Microscopy IX, volume 4621, pages 65–76, 2002.
[17] F. J. Verbeek, M. J. den Broeder, P. J. Boon, B. Buitendijk, E. Doerry, E. J. van Raaij, and D. Zivkovic. A standard atlas of zebrafish embryonic development for projection of experimental data. In Proceeding of The International Society for Optical Engineering: Internet Imaging, volume 3964, pages 242–252, 2000.
[18] F. J. Verbeek, K. A. Lawson, and J. B. L. Bard. Developmental bioinformatics: linking genetic data to virtual embryos.International Journal of Developmental Biology, 43:761– 771, 1999.
[19] Y. Bei, M. Belmamoune, and F.J. Verbeek. Ontology and image semantics in multimodal imaging: submission and retrieval. InProceeding of The International Society for Optical Engineering: Internet Imaging VII, volume 6061, pages 60610C1–C12, 2006.
[20] G. V. Gkoutos, E. C. J. Green, A. Mallon, J. M. Hancock, and D. Davidson. Using ontologies to describe mouse phenotypes. Genome Biology, 6:R8, 2004.
[21] World Wide Web consortium. http://www.w3.org/.
[22] Gene Ontology Annotation (GOA). http://www.ebi.ac.uk/GOA/.
[23] Gene Ontology Consortium. The Gene Ontology (GO) project in 2006. Nucleic Acids Research, 34(Database issue):D322–D326, 2006.
[24] S. Luger, J. S. Aitken, and B. L. Webber. Cross-species mapping between anatomical ontologies based on lexico-syntactic properties, 2004. ISMB06: International Conference on Intelligent Systems for Molecular Biology, Poster C-40.
[25] M. Belmamoune and F. J. Verbeek. Heterogeneous information systems: bridging the gap of time and space. management and retrieval of spatio-temporal gene expression data. In Vicente P. Guerrero-Bote, editor,Current Research in Information Sciences and Tech-nologies. Multidisciplinary approaches to global information systems, volume 1 of In-SCit2006: International Conference on Multidisciplinary Information Sciences and Tech-nologies, pages 53–58, 2006.
[26] Java Server Pages (JSP). http://java.sun.com/products/jsp/. [27] PostgreSQL. http://www.postgresql.org/.
[28] MySQL. http://www.mysql.com/.
[29] M. Belmamoune and F. J. Verbeek. Mining zebrafish 3D patterns of gene expression. In preparation.
[30] Search with gene information. https://bio-imaging.liacs.nl/gems/jsp/ SearchImages.jsp.
[31] Search with anatomy concepts. https://bio-imaging.liacs.nl/gems/jsp/ CombinatorialSearch.jsp.
[32] M. Belmamoune, E. Lindoorn, and F. J. Verbeek. 3D-VisQuS: A 3D visual query system integrating semantic and geometric models. In Vicente P. Guerrero-Bote, editor, Cur-rent Research in Information Sciences and Technologies. Multidisciplinary approaches to global information systems, volume 2 ofInSCit2006: International Conference on Multi-disciplinary Information Sciences and Technologies, pages 401–405, 2006.
[33] NCBI. http://www.ncbi.nlm.nih.gov. [34] ENSEMBL. http://www.ensembl.org/.
[35] Distributed Annotation System (DAS). http://biodas.org/.
[36] C. Lee, M. Chen, and C. Lin. Progressive partition miner: An efficient algorithm for mining general temporal association rules. IEEE Transactions on Knowledge and Data Engineering, 15(4):1004–1017, 2003.