University of Vermont
ScholarWorks @ UVM
Graduate College Dissertations and Theses Dissertations and Theses
2018
Genetic And Demographic Consequences Of
Lake And River Habitat Fragmentation On Fishes
In Vermont
Peter T. Euclide
University of Vermont
Follow this and additional works at:https://scholarworks.uvm.edu/graddis
Part of theBiology Commons,Genetics and Genomics Commons, and theNatural Resources and Conservation Commons
This Dissertation is brought to you for free and open access by the Dissertations and Theses at ScholarWorks @ UVM. It has been accepted for inclusion in Graduate College Dissertations and Theses by an authorized administrator of ScholarWorks @ UVM. For more information, please contact Recommended Citation
Euclide, Peter T., "Genetic And Demographic Consequences Of Lake And River Habitat Fragmentation On Fishes In Vermont" (2018).Graduate College Dissertations and Theses. 887.
GENETIC AND DEMOGRAPHIC CONSEQUENCES OF LAKE AND RIVER HABITAT FRAGMENTATION ON FISHES IN VERMONT
A Dissertation Presented
by Peter T. Euclide
to
The Faculty of the Graduate College of
The University of Vermont
In Partial Fulfillment of the Requirements for the Degree of Doctor of Philosophy
Specializing in Biology May, 2018
Defense Date: March 21, 2018 Dissertation Examination Committee: J. Ellen Marsden, Ph.D., Advisor Matthew J. Wargo, Ph.D., Chairperson Jason D. Stockwell, Ph.D. C. William Kilpatrick, Ph.D. Cynthia J. Forehand, Ph.D., Dean of the Graduate College
ABSTRACT
Globally, habitat fragmentation has had a major impact on the conservation and management of many species and is one of the primary causes of species extinction. Habitat fragmentation is loosely defined as a process in which a continuous habitat is reduced to smaller, disconnected patches as the result of habitat loss, restriction of migration or the construction of barriers to movement. Aquatic systems are particularly vulnerable to habitat fragmentation, and today an estimated 48% of rivers are fragmented worldwide. My dissertation evaluates how habitat fragmentation has influenced the populations of four different species of fish in the Lake Champlain basin. In chapter 1 I summarize the current state of habitat fragmentation research, I broadly describe habitat fragmentation, review how habitat fragmentation pertains to population genetics, and describe the legacy of habitat fragmentation in the Lake Champlain basin. In chapters 2, 3 and 4 I evaluate and discuss the impact of nine lake causeways on the population
structure of slimy sculpin (Cottus cognatus), rainbow smelt (Osmerus mordax), and lake whitefish (Coregonus clupeaformis). The genetic effects of causeways are limited. However, causeways appear to have had a significant influence on rainbow smelt demographics, and the genetic structure observed in lake whitefish may be a product of reduced effective population size resulted from commercial harvest in the late 1800s. In chapter 5 I evaluate how the basin-wide population of tessellated darters (Etheostoma olmstedi) is naturally structured throughout Lake Champlain and three different major tributaries and evaluates the effect that different types of habitat fragmentation (dams, causeways, and natural fall lines) have on tessellated darter populations. Tessellated darters appear to be highly structured by river drainage but not by dams, causeways or fall lines. My dissertation highlights how comparative population genetic studies can be used to identify patterns of isolation within large populations. My results stress the value of reporting both the presence and absence of barrier induced population sub-structuring.
ii CITATIONS
Material from this thesis has been published in the following form:
Euclide P.T., Flores N.M., Wargo M.J., Kilpatrick C.W. & Marsden J.E.. (2017). Lack of genetic population structure of slimy sculpin in a large, fragmented lake. Ecology of Freshwater Fish. doi.wiley.com/10.1111/eff.12385
iii
ACKNOWLEDGEMENTS
I would like to thank my advisor Ellen Marsden for her hours of help, thoughtful ideas, patience and support of my research. I would also like to thank the
members of the Marsden, Stockwell, and Wargo labs for their help and support with field, lab work and thoughtful discussion, without which it would have been difficult to complete this dissertation. Thank you to the captain of the RV
Melosira, Steve Cluett, and mates Krista Hoffsis and Bradley Roy for help collecting the samples required for my research. Special thanks to the Vermont Department of Fish and Wildlife whose support, sampling, and long-term data collection set the groundwork for much of my research. Finally, I would like to thank my friends and family for their support throughout this process.
My dissertation work was funded by the Great Lakes Fishery Commission with funds secured through Senator Leahy. I thank Tom Berry and Marc Gaden for their work on acquiring these funds. Additional funding was received from the USGS Vermont Water Resources and Lakes Study Center, Champlain Research Experience for Secondary Teachers fellowship, and NSF Research Experience for Undergraduates.
iv TABLE OF CONTENTS CITATIONS ... ii ACKNOWLEDGEMENTS ... iii LIST OF FIGURES ... ix
CHAPTER 1: HABITAT FRAGMENTATION LITERATURE REVIEW ... 1
1.1. Habitat fragmentation as a global issue ... 1
1.2. Genetic consequences of habitat fragmentation ... 7
1.3. Habitat fragmentation in the Lake Champlain basin ... 11
CHAPTER 2: LACK OF POPULATION GENETIC STRUCTURE OF SLIMY SCULPIN IN A LARGE, FRAGMENTED LAKE ... 20
2.1. Abstract ... 20
2.2. Introduction ... 21
2.3. Methods ... 24
2.4. Results ... 29
2.5. Discussion ... 32
CHAPTER 3: GENETIC VERSUS DEMOGRAPHIC STOCK STRUCTURE OF RAINBOW SMELT IN A LARGE FRAGMENTED LAKE ... 45
3.1. Abstract ... 45
3.2. Introduction ... 46
3.3. Methods ... 49
3.4. Results ... 56
v
CHAPTER 4: GENETIC STRUCTURE OF LAKE WHITEFISH (COREGONUS CLUPEAFORMIS) IN LAKE CHAMPLAIN, VERMONT 100 YEARS
AFTER COMMERCIAL FISHERY CLOSURE ... 79
4.1. Abstract ... 79
4.2. Introduction ... 80
4.3. Methods ... 84
4.4. Results ... 90
4.5. Discussion ... 93
CHAPTER 5: ROLE OF DRAINAGE AND BARRIERS IN THE GENETIC STRUCTURING OF A TESSELLATED DARTER POPULATION ... 108
5.1. Abstract ... 108
5.2. Introduction ... 109
5.3. Methods ... 112
5.4. Results ... 120
5.5. Discussion ... 124
CHAPTER 6: SUMMARY AND CONCLUSIONS ... 143
vi
LIST OF TABLES
Table 1.1: Descriptions of all major causeways present in Lake Champlain.
Data from Marsden and Langdon 2012 and field measurements. ... 18 Table 1.2: Mean and standard deviation (SD) of temperature data (°C) collected
in nine of the 11 causeway openings in Lake Champlain. Names correspond to causeways shown in in Figure 1.1. ... 19 Table 2.1: Characteristics of 10 microsatellites amplified in slimy sculpin. Shown
are the GenBank marker name, repeat motif, forward and reverse primer sequence, fluorophore tail, amplified size range, annealing temperature (Ta) and citation for the source of the marker. ... 38 Table 2.2: Site-specific summary statistics of slimy sculpin genotypes taken
from nine microsatellite loci grouped by lake, basin, and site.
N = number of individuals genotyped, Na = mean number of alleles per locus, HO = observed heterozygosity, HE = expected heterozygosity, Ne = effective population size, nPA = number of private alleles and
AR = mean allelic richness across all loci. ... 39 Table 2.3: Pairwise FST (below the diagonal) and corresponding p-values ±
standard deviation (above the diagonal) calculated in ARLEQUIN for slimy sculpin sampled from two sites in Lake Ontario (Fairhaven and Hamilton) and three major basins in Lake Champlain isolated from one another by causeways. The three basins were the Main Lake (Grand Isle, Sunset Isle, Shelburne Bay, Barber Point), the Inland Sea (north and
south sites), and Malletts Bay. ... 40 Table 2.4: Diversity and basic environmental metrics from 12 microsatellite
studies of sculpin compared to the slimy sculpin in Lake Champlain and Lake Ontario. Distance estimates are based approximately from site maps or mantel plots when no exact numbers are reported as indicated by a ‘~’.
Data not reported in the cited study is indicated by ‘NR’. ... 41 Table 3.1: Characteristics of the 8 microsatellites amplified in rainbow smelt.
Shown are the marker name, forward and reverse primer sequence,
fluorophore tail, amplified size range, annealing temperature (Ta) and citation for the source of the marker. ... 69
vii
Table 3.2: Site-specific summary statistics of rainbow smelt genotypes taken from six microsatellite loci grouped by basin and site in Lake Champlain. N = number of individuals sampled for genotyping, efN = mean number individuals genotyped across loci, HO = observed heterozygosity,
HE = expected heterozygosity, FIS = inbreeding coefficient, Ne = effective population size (lowest allele frequency used = 0.2), and AR = mean allelic richness across all loci based on minimum sample size of 32 individuals. ... 70 Table 3.3: Pairwise G’ST (below diagonal) and FST (above diagonal) estimated
for rainbow smelt sampled from five sites in in Lake Champlain. ... 71 Table 3.4: ANOVA table for analysis comparing growth and CPUE among
basins. “-“ indicates that the effect was not calculated for the given response. ... 72 Table 3.5: Sample size of number of years compared (N), rho test statistic, and
significance for Spearman correlations testing the between-basin relationships of proportion of age-1 fish, length at age-1, and
catch-per-unit-effort (CPUE) across 26 years of trawling surveys. ... 73 Table 4.1: Characteristics of the 8 microsatellites amplified in lake whitefish.
Shown are the marker name, forward and reverse primer sequence, fluorophore tail, amplified size range, annealing temperature (Ta) and
citation for the source of the marker. ... 99 Table 4.2: Site-specific summary statistics of lake whitefish genotypes taken from
eight microsatellite loci in Lake Champlain. AR = mean allelic richness across all loci based on minimum sample size of 21 individuals,
efN = mean number individuals genotyped across loci, HO = observed heterozygosity, HE = expected heterozygosity, FIS = inbreeding coefficient, HWE = P-value for Hardy-Weinberg equilibrium test, HWEhom and HWEhet = P-values for heterozygosity deficit and excess,
Ne = effective population size (lowest allele frequency used = 0.2). ... 100 Table 4.3: All individual genotyped lake whitefish and site of origin with at
least one private allele present. ... 101 Table 4.4: FST (above diagonal) and G'ST (below diagonal) for all sites sampled
for lake whitefish in Lake Champlain. Comparisons significantly greater
viii
Table 4.5: Mean number of alleles (Na), observed heterozygosity (Ho), and expected heterozygosity (He) of loci BFW1, BFW2 and C23 reported in
Table 3 of Lu et al 2001 and the present study. ... 103 Table 5.1: Basic characteristics of the seven barriers in the Lake Champlain
basin evaluated in this study. FL – natural fall line, CW = causeway,
YBP – years before present. ... 131 Table 5.2: Characteristics of 12 microsatellites amplified in tessellated darters.
Shown are the marker name, forward and reverse primer sequence, fluorophore tail, amplified size range, annealing temperature (Ta) and
citation for the source of the marker. ... 132 Table 5.3: Power results (proportion of significant tests) for X2 - test and Fisher’s
exact tests run using POWSIM at various levels of expected FST. All simulations used effective population sizes of 2000 individuals and were
replicated 2000 times. ... 134 Table 5.4: Number of tessellated darters genotyped (N), mean effective sample
size (efN), observed heterozygosity (Ho), expected heterozygosity (He), inbreeding coefficient (FIS), allelic richness (AR), and estimated
effective population size (Ne). ... 135 Table 5.5: Estimates of pairwise G’ST calculated among all sites sampled in
the Lake Champlain basin. ... 136 Table 5.6: Models used to describe connectivity of tessellated darters across
the Lake Champlain basin and within individual drainages. Model selection metrics included: Akaike Information Criteria (AIC), residual degrees of freedom (RDF), residual deviance, null deviance, adjusted
ix LIST OF FIGURES
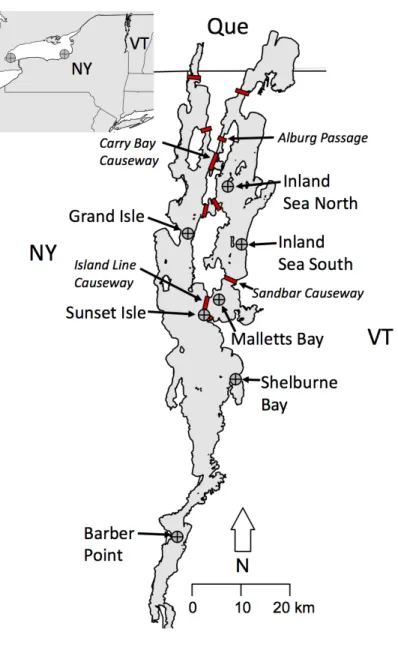
Figure 1.1: Location of Lake Champlain and major features discussed in text. Short dashed line indicates the approximate location of the natural fall line. Brackets indicate the approximate designation of the three primary basins of Lake Champlain isolated by causeways. Causeways are denoted as black lines and labeled in the map, exact locations of dams and fall lines in the three rivers sampled in Chapter 5 are denoted
by triangles, and stars respectively. ... 17 Figure 2.1: Sample sites indicated by open crossed dots for slimy sculpin in
Lake Champlain and Lake Ontario (inset map), and location of nine
causeways (red bars) hypothesized to pose barriers to fish movement. ... 42 Figure 2.2: Clustering of two Lake Ontario and seven Lake Champlain
slimy sculpin populations (left) based on DAPC (top) and STRUCTURE (bottom) and the same data for only Lake Champlain (right). In the scatterplot of DAPC results, individuals are represented by dots and sampled populations are coded by color and encircled with inertia ellipses. The STRUCTURE barplot is a graphical representation of individual membership coefficient to each cluster (vertical bars). Colors represent different estimated clusters of a single admixed individual. Based on results from ∆K analysis, only K = 2 are shown. ... 43 Figure 2.3: Correlations between waterway distance and all pairwise FST genetic
distance estimates for slimy sculpins from seven locations in Lake Champlain. . 44 Figure 3.1: Locations of genetic samples (gray dots) and forage fish survey trawling
paths (dotted lines) in Lake Champlain. Red lines indicate the location of a
causeway. ... 74 Figure 3.2: Clustering model outputs from DAPC (top) and STRUCTURE
(k =3; bottom). Numbers indicate the five sites where rainbow smelt were sampled (1) Barber Point, (2) Juniper Island, (3) Valcour, (4) Malletts Bay, and (5) Northeast Arm. Each individual dot in the DAPC bi-plot represents a single genotyped individual and the color of the dot indicates the site the where the individual was sampled. The STRUCTURE barplot is a graphical representation of individual membership coefficient to each cluster (vertical bars). Colors represent different estimated clusters
x
Figure 3.3: The proportion of rainbow smelt age 1 – 4 captured during forage fish surveys between 1990 – 2015 in the three partially isolated basins of
Lake Champlain. ... 76 Figure 3.4: A) length-at-age of rainbow smelt averaged across 26 years of forage
fish surveys. Lines represent line of best fit, gray background indicate 95% confidence intervals around line of best fit. B) average length of
age-1 rainbow smelt per year in each Lake Champlain basin. ... 77 Figure 3.5 Total catch-per-unit-effort (CPUE) of rainbow smelt in each Lake
Champlain basin for each year. Error bars represent standard error. Inset plot indicates the across-year CPUE for each basin (colors), lines indicate
median values. ... 78 Figure 4.1: Locations of lake whitefish samples (dots), approximate locations of
historic major fishing grounds (hashed boxes) and causeways (black lines). Major basins discussed in text are denoted using brackets. ... 104 Figure 4.2: Pairwise genetic distance estimates (G’ST) and 95% confidence
intervals between 2008 and 2015 Inland Sea samples (IS), and among all sites sampled for whitefish in Lake Champlain: Burlington Bay (BB), Grand Isle (GI), Malletts Bay (MB), South Lake (SL), and Missisquoi Bay (Miss). Comparisons with confidence intervals including zero
(dotted line) were not considered to be significant. ... 105 Figure 4.3: Genetic clustering of all whitefish sampled in Lake Champlain using
discriminant analysis of principal components (top) and Bayesian STRUCTURE analysis with k = 3 (bottom). Each individual dot in the DAPC bi-plot represents a single genotyped individual and the color of the dot indicates the site the where the individual was sampled. The STRUCTURE barplot is a graphical representation of individual membership coefficient to each cluster (vertical bars). Colors represent different estimated clusters of a single admixed individual. Vertical black
bars indicate breaks in sampled populations (x-axis). ... 106 Figure 4.4: Time series of simulated average number of alleles (An) and
observed heterozygosity (Ho) following a reduction of effectve population size from either 10,000 or 2,000 by 50%, 75% or 90% (line types). The simulated reduction in population size began after ten years (dotted line) and then population size was maintained at the reduced level for 120 years
xi
Figure 5.1: Sampling sites (black dots) for tessellated darters collected from Lake Champlain and three Lake Champlain tributaries (Missisquoi River, Indian Brook, and Lewis Creek). Three types of potential barriers to darter dispersal are indicated in inset maps: fall lines (solid lines), dams
(broken lines) and causeways (double line with hash marks). ... 139 Figure 5.2: Average observed (HO) and expected (HE) heterozygosity, and
allelic richness for tessellated darters collected from Lake Champlain, Indian Brook, Lewis Creek and the Missisquoi River as a function of upstream distance from Lake Champlain. Each dot represents a single
sample location. ... 140 Figure 5.3: Two types of cluster analysis of tessellated darters sampled from
18 sites. (A) barplot of STRUCTURE results for the most likely number of clusters (k = 3). Each bar represents a single individual with color representing the relative likelihood an individual is from a given colored cluster. (B) Clustering of darters along the most descriptive discriminant function of a DAPC. Colored peaks refer to specific sampling locations in the drainages Lewis Creek (oranges), Lake Champlain and Missisquoi
River (reds and blues), and Indian Brook (beige). ... 141 Figure 5.4: Average change (downstream to upstream) in observed (HO) and
expected (HE) heterozygosity, allelic richness (AR) between sites within drainages for tessellated darters collected on either side of five barrier
1
CHAPTER 1: HABITAT FRAGMENTATION LITERATURE REVIEW 1.1. Habitat fragmentation as a global issue
How species’ and population diversity is distributed across landscapes has been a key question in ecology for more than a century, and has led to research that describes the effect of both natural and man-made barriers on species distributions and genetic structure (Forman, 1995). As human populations continue to increase, so does habitat fragmentation, degradation, and loss (With & Crist, 1995; Ewers & Didham, 2006). Fragmentation impairs ecosystems by changing ecosystem services, promoting dispersal of exotic species, and damaging core habitat (Trombulak & Frissell, 2000; Broadbent et al., 2008). Additionally, fragmented populations are often subject to reduced gene flow among sub-populations, which can weaken species’ ability to react to changes in their environment (Macarthur & Wilson, 1967; Templeton et al., 1990). As a result, species in fragmented landscapes are often at a higher risk of extinction than species in contiguous landscapes (Fahrig, 2002). For these and other reasons, fragmentation is considered one of the root causes of increasing rates of species extinctions worldwide (Fahrig, 1997; Henle et al., 2004). Therefore, an important step in both conservation of endangered species and management of natural resources is to understand how different forms of habitat fragmentation influence species at the population level.
To evaluate how habitat fragmentation has influenced species assemblages and populations, researchers have developed and utilized a variety of observational, experimental, and modeling techniques (Haddad et al., 2015; Williams et al., 2016; Yeager et al., 2016). Experimental manipulations of patch size can identify how
fragmentation influences community richness and abundance (e.g., Kareiva, 1987). However, meta-analyses of these experiments show a lack of consistency in results, emphasizing the variation in species- and landscape-specific responses to fragmentation (Debinski & Holt, 2000). Simulations of habitat fragmentation have often been used to construct null models to compare to observed data and predict how systems might be impacted by future fragmentation (e.g., Sisk, Haddad & Ehrlich, 2013). Two types of models common in habitat fragmentation research are extinction-colonization (EC) and birth-immigration-death-emigration (BIDE) models, and whereas they differ in their approach, both find that extinction rates increase with fragmentation (Fahrig, 2002). More recently, landscape models that combine geographic data with genetic and species natural history data have been used to identify barriers and potential corridors within landscapes (Rees et al., 2008; Elliot et al., 2014). Finally, the design, interpretation, and parameterization of fragmentation experiments and models would not be possible without observational, field-based fragmentation research that describes how habitat
fragmentation has impacted hundreds of different species, from plants to insects, large mammals, and fish (e.g., Gerlach & Musolf, 2000; Ramalho et al. 2014; Hansen et al., 2014; Couchoux, Seppä & van Nouhuys, 2016).
In terrestrial systems, habitat fragmentation exists in many different forms, including urbanization, deforestation, and road construction. Fragmentation by roads and deforestation negatively impacts animal movements and seed and pollen dispersal (Gerlach & Musolf, 2000; Ramalho et al., 2014). Additionally, species richness and community composition often differ between fragmented and un-fragmented habitats
3
(Quinn & Harrison, 1988). However, the size and direction of this effect often differs. While some studies find decreased species richness is associated with fragmentation, others find the exact opposite (Debinski & Holt, 2000; Haddad et al., 2015). One fairly consistent trend, however, is that increased fragmentation leads to decreased population size and increased rates of local extinction (Saccheri et al., 1998; Fahrig, 2002). Another consistent finding is that habitat fragmentation often has indirect, negative effects on species, such as changes in soil temperature and salinity near roads affecting nearby plant growth, and increased active and passive harassment of wildlife (Trombulak & Frissell, 2000).
In aquatic systems, fragmentation is largely a consequence of dams and their impact on fish movement, habitat connectivity, and habitat loss due to changes in hydrology and sediment transport (Ligon, Dietrich & Trush,1995; Bessert & Orti, 2008; Wang et al., 2010). In the U.S. alone there are an estimated 75,000 dams (Graf, 1999) and many of them pose significant barriers to a range of fish species, obstructing movement and limiting access to suitable habitat. Worldwide, the number of dams continues to rise and as of 2015 an estimated 48% of global rivers are at least moderately impacted by
fragmentation and flow regulation (Grill et al., 2015). While many species are impacted, dams and other instream barriers have the most impact on highly migratory fishes such as salmonids, sturgeon, and lamprey that have upstream spawning habitat (Hall, Jordaan & Frisk, 2011). Dams are still one of the largest threats to anadromous Pacific salmon stocks and central to anadromous Atlantic salmon (Salmo salar) recovery efforts (Roni et al., 2002; Brown et al., 2013). While commercially harvested species such as salmon are
most often cited when discussing instream barriers, habitat fragmentation has contributed to diminished populations of almost all anadromous species from forage fish such as alewife (Alosa pseudoharengus), blueback herring (Alosa aestivalis) and American shad (Alosa sapidissima) to game fish such as striped bass (Morone saxatilis; Beasley & Hightower, 2000; Kocovsky, Ross & Dropkin, 2009). For most of these species,
however, dams do not fragment populations, but instead decrease the available spawning and nursery habitat by preventing upstream and downstream migration and damaging existing spawning habitat through sedimentation and altered flow (Ligon, Dietrich & Trush,1995; Sheer & Steel, 2011).
Migratory fish species may be most directly affected by instream barriers but non-migratory species are also affected. For many stream residents, barriers can damage habitat and limit gene flow isolating once-contiguous dendritic populations (Clemento et al., 2009). One common impact of new barriers is a decrease in species diversity both above and below the barrier due to a loss in habitat complexity (Ligon, Dietrich & Trush,1995; Wang et al., 2010). When a new barrier is built, the area above the barrier often transitions to a more lentic state, leading to the extirpation of many lotic species while areas below the barrier are also affected by flow regulation affecting seasonal flood cycles crucial to many species’ life histories (Agostinho, Pelicice & Gomes, 2008). However, of importance is that the impact of the barriers themselves on community diversity is often small in comparison to other environmental factors, such as river size, flow, and land use (Cumming, 2004; Wang et al., 2010). Additionally, as in terrestrial environments, the effect of habitat fragmentation in aquatic systems is species-specific,
5
which makes the prediction of a species’ sensitivity to habitat fragmentation difficult (Ewers & Didham, 2006).
What to do about aquatic habitat fragmentation is complicated by the conservation benefits of dams and other barriers. One of the best examples of conflict between
negative and positive impacts are dams in the Laurentian Great Lakes watershed. At least 12,000 dams exist in the Great Lakes watershed including many small, out-of-use dams that could be removed (Januchowski-Hartley et al., 2013). Even small, out-of-use barriers limit up-stream movement of many species of fish, resulting in diminished species
richness above barriers (Dodd et al., 2003). Additionally, many endangered or threatened species use Great Lakes tributaries for reproduction (e.g., adfluvial lake sturgeon,
Acipenser fulvescens) or as their primary habitat (e.g., northern madtom, Noturus stigmosus; Auer, 1996; Lane, Portt & Minns, 1996). However, in the mid-1970s
managers began using low-head barriers as a method to prevent spawning by invasive sea lamprey (Petromyzon marinus; Hunn and Youngs, 1980). Using barriers to limit sea lamprey access to spawning habitat has been a successful form of control and additional lamprey-control barriers have been added to some streams (Lavis et al., 2003). Therefore, making management decisions about aquatic habitat fragmentation requires information about how multiple species and preferably the entire community will be impacted by the addition or removal of fragmentation.
Relative to terrestrial and riverine systems, lakes are generally not subject to fragmentation. Fragmented lakes provide a novel system to draw parallels between aquatic and terrestrial system in meta-analyses. Unlike lotic systems which are
1-dimensional and movement is largely limited to upstream or downstream, lentic systems, like terrestrial environments, are more 2-dimensional whereby fish are free to choose multiple routes to the same destination. One human impact in lake systems akin to terrestrial fragmentation is causeways. Most causeways connect islands to the mainland across marine ecosystems (e.g., connecting Venice, Singapore, and Bahrain to the
mainland), or are used to reclaim land or protect land from tidal flooding (e.g., the system of polder dykes and Zuiderzee Works in the Netherlands), but are uncommon in
freshwater lakes. When present, causeways divide lentic environments and could limit the movement of aquatic species (Fechhelm, 1999; Fechhelm et al., 1999). Movement across most causeways is generally still possible through one or more openings built into the causeway to allow some water flow or boat passage. Therefore, causeways may limit gene flow similar to roads, deforestation, or other landscape-altering practices where some passage between patches is still possible. However, no studies have evaluated if causeways limit gene flow, which makes lake causeways a novel area of research.
As human populations increase, so does habitat fragmentation and degradation (With & Crist, 1995; Ewers & Didham, 2006). While many aspects of the impact of habitat fragmentation are still debated, the negative effects on natural communities are well established, and the idea that habitat fragmentation leads to increased rates of extinction is widely accepted (Wilcox & Murphy, 1985; Fahrig, 2003). Therefore, a better
understanding of the consequences of watershed-wide habitat fragmentation is needed to inform management and conservation decisions about barrier creation and removal in watersheds throughout the world.
7
1.2. Genetic consequences of habitat fragmentation
Genetic diversity is required for evolution of species, and is positively correlated with population and individual fitness (Reed & Frankham, 2003). Loss of genetic diversity through inbreeding generally leads to decreased fitness and increased inbreeding depression (Saccheri et al., 1998; Vrijenhoek, 1998; Perrin & Mazalov, 2000). Because habitat fragmentation often reduces population size and increases spatial isolation, fragmentation is generally hypothesized to erode genetic variation and lead to increased rates of genetic drift and population sub-structuring. However, the influence of habitat fragmentation in population genetics is varied, and often species-specific (Henle et al., 2004). Nonetheless, maintenance of genetic diversity has been recognized by the International Union for Conservation of Nature (IUCN) as a conservation priority (McNeely et al., 1990), and understanding how human activities, such as those that lead to habitat fragmentation, affect genetic structure and diversity is important to protect and conserve native species.
In terrestrial environments, habitat fragmentation has had inconsistent effects on population genetics. Genetic diversity of plant populations is often reduced with
increased fragmentation and reduced population size; however, the effects can be small, and gene flow among sub-populations is often still common (Young, Boyle & Brown, 1996). Studies of terrestrial animals have also found variable effects of habitat
fragmentation on population structure and diversity. Whereas most studies still find a relationship between genetic diversity and population size, many species appear to be robust against the hypothesized impact of habitat fragmentation on increasing inbreeding
and decreasing genetic diversity (Mitrovski et al., 2007). When fragmentation limits access to dispersal pathways, however, populations do generally show signs of increased genetic sub-structuring (Gerlach & Musolf, 2000; Barr et al., 2015). Additionally, erosion of diversity and sub-structuring is often higher in specialists, and populations that were small prior to fragmentation (Harrison & Bruna, 1999; Holderegger & Di Giulio, 2010).
The effects of fragmentation on the population genetics of aquatic species are also variable (Blanchet et al., 2010). However, barriers to gene flow are easier to identify in aquatic systems, making causative studies more feasible than in terrestrial systems. Freshwater environments are naturally very fragmented (e.g., dendritic rivers systems, isolated small ponds and lakes), and populations living in these systems are often isolated from one another with only a single possible dispersal route (Campbell Grant, Lowe & Fagan, 2007). This natural fragmentation is thought to be partially responsible for the disproportionate level of species diversity present in freshwater versus marine habitats (Dias et al., 2013). Populations in river systems are especially vulnerable to habitat fragmentation, and can be subject to high levels of local extinction, especially when migration is unidirectional or if the system is small (Fagan, 2002). Therefore,
construction of new barriers magnifies the effects of existing patterns of isolation and restricted dispersal present in most freshwater fish populations.
As in terrestrial environments, increased fragmentation in aquatic systems is predicted to lead to decreased genetic diversity and increased population genetic sub-structuring. Several studies have shown that noticeable changes in population structure and genetic diversity of fish species separated by dams can occur within less than 100 years (e.g.,
9
Neraas & Spruell, 2001; Wofford, Gresswell & Banks, 2005). For example, as a result of several dams built in the Sense river basin of Switzerland, bullhead (Cottus gobio) had diminished genetic diversity in headwater regions consistent with a lack of upstream dispersal (Junker et al., 2012). Similarly, European chub (Squalius cephalus) showed higher genetic structure in streams with large in-stream barriers than in an adjacent un-fragmented stream (Gouskov & Vorburger, 2016). While a degree of population sub-structuring in freshwater systems is natural, further decreased population connectivity is an additional stressor to many populations already negatively affected by habitat
degradation, overfishing, and other anthropogenic impacts and is therefore a conservation and management concern (Coleman et al., 2018).
Evaluating the genetic diversity and structure of populations continues to be an important tool in conservation and management of fish populations (Vrijenhoek, 1998; Schwartz, Luikart & Waples, 2007). For example, following the collapse of lake trout populations in the Great Lakes in the mid-1900s, the genetic diversity of the remnant populations in Lake Superior has decreased and shows signs of genetic bottlenecks; therefore,
conserving genetic diversity is central to lake trout (Salvelinus namaycush) recovery efforts (Guinand et al., 2003). Genetic data have been used to define or redefine
management units for commercial fishing (VanDeHey et al., 2009). In Lake Michigan, genetic assessment of commercially fished lake whitefish (Coregonus clupeaformis) showed that lake whitefish landed in each management unit were comprised of multiple genetic stocks suggesting that all spawning stocks need to be considered when setting catch limits (Andvik et al., 2016). For endangered or threated species, quantifying genetic
structure can help maximize time and resources by identifying populations of concern for conservation (Aben et al., 2016; Li et al., 2016). In the Missouri River, dams caused increased isolation by distance and decreased genetic diversity in endangered blue sucker (Cycleptus elongates) populations (Bessert & Orti, 2008). As information of genetic diversity and structure becomes increasingly efficient and affordable to acquire, population genetic analysis has become an essential step in the development of management and conservation plans (Begg & Waldman, 1999; Mace, 2004).
More recently, genetic research has focused on understanding how landscapes influence the connectivity of populations (Manel et al., 2003; Storfer et al., 2007; Balkenhold & Landguth, 2011). Landscape genetic research often attempts to evaluate multiple
landscape pressures concurrently through the use of models and simulations (Hand et al., 2014). The predictive capability of models has been used to identify what the effects of barriers may be in the future (Landguth et al., 2014). Though powerful, these modern techniques have drawbacks, often sacrificing field research for laboratory and
computational work (Richardson et al., 2016). This has led to a recent call for more field-based research that combines null model techniques with traditional genetic sampling across a range of taxa and landscapes (Richardson et al., 2016).
Universally, the small and isolated populations created by habitat fragmentation are at an increased risk of diminished genetic diversity, increased population sub-structuring, and increased risk of inbreeding depression. While not all species have the same levels of sensitivity to these effects, the ability to predict which species are sensitive is an important part of conservation and natural resources management (Henle et al., 2004;
11
Ewers & Didham, 2006). As modern molecular techniques make collecting and analyzing population genetic data more efficient and affordable, understanding the genetic structure of populations has become central to species conservation and management (Schwartz, Luikart & Waples, 2007).
1.3. Habitat fragmentation in the Lake Champlain basin
Lake Champlain has a long history of fragmentation. Geologically, the Champlain Valley has experienced extensive change over the last 20,000 years. During this time, Vermont experienced glaciation, reversals in lake outflow direction, large fluctuations in lake size, and changes in salinity when, for a 1,500 to 2,000-year period, the region was connected to the Atlantic Ocean (Cronin et al., 2008; Marsden & Langdon, 2012). Following European colonization in the 1700s, many dams and weirs were built in the Vermont tributaries of Lake Champlain, and causeways were constructed in the lake by the mid-1800s. The causeways divide the lake into four distinct basins and may be partially responsible for large differences in productivity and water quality among basins (Myer & Gruendling, 1979; LCBP, 2015).
The Lake Champlain drainage basin has a distinct fall line that runs north to south, parallel to the lake on the Vermont side (Figure 1.1). Following the last glaciation, the area that is now considered the Lake Champlain valley was inundated, allowing for many species, such as many fishes and unionid mussels, to colonize above the fall line (Smith, 1985; Langdon, Ferguson & Cox, 2006). Following a decrease in lake level
natural barrier to many species of fish and shaped stream species assemblages seen today (Marsden & Langdon, 2012). Presently, the fall line is approximately 46 m in elevation and partially eroded but major waterfalls or cascades can be easily identified in most tributaries that cross the fall line.
During the 1800s, dams were built on most of the major tributaries to Lake Champlain, including the Great Chazy, Little Chazy, Salmon, Little Ausable, Ausable, Boquet, Winooski, Lamoille, and Missisquoi rivers and Otter Creek. Though many of the smaller weirs and mill dams have been removed, 463 dams remain in the Lake Champlain
watershed and over 800 remain in the entire state (Bushman, 2016). Dams built on two of the largest tributaries to Lake Champlain, the Missisquoi and Winooski rivers, were built below the natural fall line and cut off many species of fish such as Atlantic salmon, walleye (Sander vitreus), and lake sturgeon (Acipenser fulvescens) from their historic spawning habitat (Marsden & Langdon, 2012). Additional dams throughout the
watershed have impacted the populations of these and many fish including redhorses and other suckers (Catostomidae) and lake whitefish.
Dams in Lake Champlain are a controversial subject and have had both positive and negative effects on natural populations. Hydroelectric dams in the Winooski River, one of the largest tributaries to Lake Champlain, are known barriers to Atlantic salmon, and while most of the dams have fish passage systems, they still appear to have a negative impact on recruitment. A recent assessment suggested that only 65% of stocked salmon smolts were successful in finding downstream passage; less than half of downstream passage was through the bypass indicating mortality could be an issue (Nyqvist et al.,
13
2017). Barriers in the Richelieu River that connects Lake Champlain to the St. Laurence River and ultimately the Atlantic Ocean have also been reported to impact native species. The two dams on the Richelieu River and the lock at St. Ours, Quebec are thought to have prevented American eels (Anguilla rostrate) from reaching Lake Champlain where they were once abundant (Verreault, Mingelbier & Dumont, 2012). Dams in the Lake Champlain basin have also played an important role in protecting some native species. Dams provide refuge habitat for many species from exotic species such as limiting range expansions of zebra mussels thereby protecting unionid mussels (Marsden & Hauser, 2009). Additionally, dams serve as an important management tool used to limit spawning habitat for nuisance sea lamprey populations which have had a negative influence on lake trout and Atlantic salmon recovery efforts (Marsden et al., 2003). Finally, many dams have historical or cultural value to communities in Vermont, making dam removal a sensitive issue to some stakeholders (Fox, Magilligan & Sneddon, 2016). Given the complex combination of negative and positive properties of dams in the Lake Champlain basin, understanding what affect they have on natural communities is important to make informed decisions about barrier removal or construction.
Since the mid-1800s, construction of nine major causeways has progressively divided Lake Champlain into relatively isolated regions (Northeast Arm, Malletts Bay, Carry Bay, The Gut, Missisquoi Bay, and the northern section of the northwest arm; Figure 1.1; Table 1.1). The causeways range from 300 m to 5.25 km long; all have narrow openings (24 to 250 m) to allow passage of boat traffic (Marsden & Langdon 2012). The openings are generally shallow (2-8 m deep) and therefore may be inaccessible to cold-water fish
species during lake stratification when surface waters are warm (Table 1.2). Causeways on either side of Carry Bay and the Gut (which separate the Northeast Arm from the Main Lake) are relatively shallow and become stagnant and heavily vegetated in the summer because of the restricted flow. These seasonal changes may exacerbate the existing barrier to fish movement by lowering the habitat suitability for fish that prefer cold, oligotrophic parts of the lake. While causeways are predicted to be only partial barriers to fish movement, little is known about which species of fish pass through openings. One of the only studies that has discussed fish movement through causeway openings was conducted on tagged sea lamprey and indicated that lamprey were able to cross through causeway openings, likely while attached to host fish (Howe, Marsden & Bouffard, 2006). Although causeways provide many services such as recreational
opportunities, vehicle transit, and nursery habitat for endangered turtles, causeways have been a point of contention in Vermont. Public concern that the Missisquoi Bay causeway could be partially responsible for the high nutrient levels that cause algal blooms in Missisquoi Bay led to the widening of the Missisquoi Bay causeway opening in 2004 despite scientific research indicating a larger opening would have almost no influence on water circulation within the bay (Watzin, 2006). While common in Lake Champlain, causeways, especially those that significantly divide a lake into parts, are not a common feature in most lakes and therefore very little is known about the environmental impact of causeways on lake hydrology or fish movement.
The environmental impact of causeways has been evaluated in only a few other systems. The large causeway built for the Southern Pacific Railway that crosses Great Salt Lake in
15
Utah has been shown to prevent water mixing among lake basins. This division has resulted in differences in hydrology, salinity, and species assemblages on either side of the causeway (Post, 1977). Salinity was also different on either side of a 15-km long causeway across Urmia Lake in Iran (Zeinoddini, Tofighi & Vafaee, 2009). Species assemblage changes were also seen 30 years after the construction of a causeway across the Petitcodiac River estuary, in New Brunswick, zooplankton communities represented those of a disturbed environment and many of the larvae of anadromous fish previously abundant in the estuary were absent, suggesting the causeway may have blocked fish passage into the estuary (Aube, Locke & Klassen, 2005). Similar to dams, however, the impact of what on fish movement is inconsistent; for example, a mark-and-recapture study of Arctic cisco (Coregonus sardinella) around a causeway built near Pruhoe Bay, Alaska found that the causeways had no effect on adult Arctic cisco movement but may limit juvenile movement (Craig & Griffiths, 1981; Fechhelm et al., 1999). Despite these examples, studies of fragmentation in lakes remain limited, and most focus primarily on how shoreline development impacts fish distribution (Scheuerell & Schindler, 2004), rather than the impact they have on movement and dispersal. However, all studies do suggest that causeways can have a significant environmental impact and therefore should be included in the habitat fragmentation literature.
The long history and diversity of habitat fragmentation in the Lake Champlain basin makes it an excellent location to study the effects of aquatic barriers on fishes. My
dissertation uses the Lake Champlain system to fill major gaps in fragmentation literature associated with lake habitat fragmentation by assessing the population genetic structure
of multiple species across lake causeways and evaluating the how different barriers influence the population structure of a species that lives in both lentic and lotic environments. These aims were accomplished by using a combination of genetic, demographic, historic, and environmental data.
17
Figure 1.1: Location of Lake Champlain and major features discussed in text. Short dashed line indicates the approximate location of the natural fall line. Brackets indicate the approximate designation of the three primary basins of Lake Champlain isolated by causeways. Causeways are denoted as black lines and labeled in the map, exact locations of dams and fall lines in the three rivers sampled in Chapter 5 are denoted by triangles, and stars respectively.
^ ^ ^ # # # 0 5 10 20Kilometers
¯
Missisquoi River Indian Brook Lewis Creek Vermont New York Quebec Outer Malletts Sandbar Gut E. Carry Bay Gut W. Isle La Motte Alburg Bridge Missisquoi Rouses Pt. Main Lake Northeast Arm Malletts BayTable 1.1: Descriptions of all major causeways present in Lake Champlain. Data from Marsden and Langdon 2012 and field measurements.
Causeway Date Constructed Number of Openings Length (m) Length of opening(s) (m) Average depth (m) Sandbar Causeway 1850 1 1281 19 1.3 Rouse's Point 1851 1 1738 965 3.5* Isle La Motte 1882 1 520 19 3.3 Gut W. Causeway 1886 1 1984 57 4.9 Alburg Bridge 1886 1 464 277 7.7 Gut E. Causeway 1892 1 492 58 3.9 Outer Malletts Causeway 1899 2 5091 80 4.0*
Carry Bay Causeway 1899 2 1319 85 6.0
Missisquoi Bay 1938 1 1251 255 4.0*
19
Table 1.2: Mean and standard deviation (SD) of temperature data (°C) collected in nine of the 11 causeway openings in Lake Champlain. Names correspond to causeways shown in in Figure 1.1.
month 1 2 3 4 5 6 7 8 9 10 11 12
Outer Malletts S. Mean 0.9 0.9 1.6 4.8 11.6 17.8 23.4 23.9 21.5 13.0 7.8 3.5 SD 0.8 0.5 1.2 2.1 3.2 3.0 1.5 1.2 2.4 3.0 1.9 2.4
Outer Malletts N. Mean 1.1 1.0 1.6 4.6 11.2 17.5 22.6 24.1 21.4 13.5 8.3 4.2 SD 0.9 0.4 0.9 2.1 2.9 2.8 1.5 0.9 1.9 2.7 1.9 2.2 Sandbar Mean 0.8 0.9 1.6 4.8 11.5 17.4 23.4 23.9 20.1 12.8 7.5 2.2 SD 0.4 0.4 1.3 2.2 3.7 3.3 2.3 2.0 2.9 3.2 2.3 2.0 Gut E. Mean 1.3 1.1 1.6 4.2 9.5 15.8 22.3 23.9 21.6 14.6 9.1 4.5 SD 0.8 0.5 1.0 1.9 2.6 2.6 1.6 0.8 1.7 2.8 1.5 2.1 Gut W. Mean 1.7 1.4 2.1 5.5 11.5 17.0 21.5 22.9 22.3 17.6 12.6 5.8 SD 0.7 0.4 1.1 2.1 3.3 2.3 1.4 1.0 2.2 5.1 6.5 5.4
Alburg Bridge Mean 1.5 2.5 2.3 6.5 12.6 18.9 23.2 24.3 21.5 12.9 6.7 2.8 SD 0.6 0.4 1.2 2.5 2.0 2.3 1.4 0.9 1.9 3.6 1.8 1.6
Carry S.W. Mean 1.3 1.3 2.0 6.1 11.8 18.2 22.6 24.3 21.3 13.1 7.8 3.5 SD 0.5 0.5 1.1 2.4 2.6 2.5 1.5 0.6 1.9 3.0 1.7 2.0
Isle La Motte Mean 1.1 1.2 2.0 6.0 11.8 18.1 21.1 NA 18.2 10.7 7.2 3.4 SD 0.4 0.3 1.0 2.6 3.0 2.5 1.0 NA 0.9 2.3 2.1 2.1
Missisquoi Mean 1.7 2.8 2.3 6.6 14.0 20.4 23.9 24.7 20.8 12.1 6.3 2.5 SD 0.6 0.5 1.1 2.8 2.6 2.4 1.2 1.0 2.2 3.2 2.0 1.7
CHAPTER 2: LACK OF POPULATION GENETIC STRUCTURE OF SLIMY
SCULPIN IN A LARGE, FRAGMENTED LAKE1
2.1. Abstract
Most of what is known about sculpin population structure comes from research in
streams; however, slimy sculpins (Cottus cognatus) are also a common benthic species in deep lakes. In streams, sculpins are considered to be a relatively inactive species, moving only small distances and characteristically have high levels of genetic structure. I
examined population genetic structure of slimy sculpinacross multiple barriers and over distances up to 227 km in Lake Champlain (USA, Canada) and Lake Ontario (USA, Canada) to determine if lake populations of sculpin are also highly structured. I predicted that slimy sculpin populations in Lake Champlain would be structured by six causeways as well as by distance, Lake Ontario populations would be structured only by distance, and differences between the lakes would be large relative to within-lake differences. I
examined microsatellite variation among 200 slimy sculpins from Lake Champlain and 48 slimy sculpins from Lake Ontario to evaluate patterns of population connectivity and structure. Slimy sculpins were genetically distinct between lakes there was no evidence of population sub-structuring within either lake but. I conclude that sculpin form a single, panmictic population of in Lake Champlain and another potentially panmictic population in Lake Ontario, with no indication of genetic isolation by distance. Our results contrast
1 Euclide P.T., Flores N.M., Wargo M.J., Kilpatrick C.W. & Marsden J.E. (2017) Lack of genetic
21
with data from sculpin in streams, suggesting distance and habitat fragmentation exert little influence on population connectivity of benthic fish in lakes. One possible
explanation for this could be the comparatively large population size of sculpins in lakes compared to streams or a difference in dispersal strategies between lake and stream populations.
2.2. Introduction
Patterns of genetic variation across a species’ range generally result from historic, extrinsic factors such as physical isolation due to glaciation or changes in climate
(Hewitt, 1996; Petit et al., 2003), whereas genetic structure of populations across smaller spatial scales are often the result of contemporary environmental conditions such as habitat availability or fragmentation. Among freshwater aquatic habitats, lotic waters are particularly susceptible to anthropogenic change (e.g., channelizing, siltation,
dewatering) and fragmentation (e.g., construction of dams, weirs, and roads with poorly placed culverts; Templeton et al., 1990; Dynesius & Nilsson, 1994; Ligon, Dietrich & Trush,1995; Graf, 1999). The combination of the naturally complex structure of lotic systems with high amounts of anthropogenic disturbance often leads to high levels of population isolation and genetic structure of species living in streams and rivers (e.g., Bessert & Orti, 2008; Gouskov & Vorburger, 2016). In contrast, large lentic systems often have less habitat complexity, especially offshore lake regions, and little habitat fragmentation. Understanding how environmental heterogeneity in lakes may influence population genetic structure is nonetheless central to understanding recent evolutionary change and species’ vulnerability to anthropogenic alterations.
Determining relationships between environmental and genetic variation is particularly important for fish species that inhabit both lentic and lotic habitats, despite differences in flow, habitat complexity, connectivity, and habitat predictability (Ryder & Pesendorfer, 1989). Lentic and lotic populations of the same fish species can differ in dispersal and genetic structure, and are often genetically distinct from one another. For example, home ranges of 21 fish species in lakes were found to be 19 – 23 times larger than 25 fish species in rivers by Minns (1995), indicating movement patterns differ between lotic and lentic habitats. Additionally, patterns of genetic differentiation have been found between lentic and lotic populations of sticklebacks and cyprinids (McKinnon & Rundle, 2002; Collin & Fumagalli, 2011).
Though sculpins (Cottidae) are widely distributed in lakes and streams, little is known about their genetic structure in lentic systems. Based primarily on lotic research, sculpin are generally considered to be sedentary, and disperse only short distances. For example, mottled sculpins (Cottus bairdi) in a small tributary in North Carolina showed patterns of genetic isolation by distance across 5.6 km, and the estimated migration rates between sites separated by less than 300 m were small (Lamphere & Blum, 2012). Mottled sculpin sampled in tributaries of eastern Lake Michigan also showed strong patterns of genetic structure even across short distances (Homola et al., 2016). Assessment of sculpin behavior and ecology also suggests that sculpin do not move long distances. Mottled sculpin implanted with PIT tags had a maximum displacement distance from the tagging location of about 511 m over one year, and more than 74% of individuals moved less than 100 m from where they were tagged during a one-year study (Breen et al., 2009).
23
Similarly, slimy sculpins (Cottus cognatus) in Little River, New Brunswick, had
detectable differences in stable isotope composition among sites separated by less than 10 km, suggesting slimy sculpin have small home ranges (Gray, Cunjak & Munkittrick, 2004). Otolith microchemistry of slimy sculpin also indicated that individuals generally move less than 10 km from their natal location throughout their lifetime (Clarke, Telmer & Shrimpton, 2015). Few studies, however, have examined sculpin movement or genetic structure in lentic systems. In situbehavioral studies of slimy sculpin in lakes are
challenging because they prefer depths greater than 25 m and cold water (less than 15ºC; Otto & Rice, 1977; Brandt, 1986). Lakes generally have lower habitat complexity and have few or no barriers akin to dams to limit dispersal, thus I predict that population connectivity and genetic structure of sculpin may be different in lakes than in streams.
To better understand sculpin ecology and population connectivity in lentic systems, I examined the genetic structure of slimy sculpins in two large lakes. Lake Champlain served as our focal system. Lake Champlain is a partially fragmented lake divided into three basins by causeways that may restrict slimy sculpin dispersal, providing a lentic equivalent to a fragmented lotic system (Marsden & Langdon, 2012). I also examined two slimy sculpin populations from Lake Ontario as an outgroup to assess consistency of trends in population structure among lakes, and between lake and stream populations. The two lakes have a similar fish community and trophic status, but Lake Ontario is much larger than Lake Champlain (longest axis is 311 km relative to 193 km in Lake Champlain), lacks habitat fragmentation, and due to its size is more likely to have higher isolation by distance among fish populations. The two lakes have been isolated for
approximately 10,000 years, providing a context for genetic differences resulting from isolation. Examining sculpin in Lake Champlain and Lake Ontario allows us to assess potential genetic differences resulting from isolation between lakes, isolation by distance within lakes, and isolation by fragmentation in two systems with similar environments.
2.3. Methods
2.3.1. Study sites:
Lake Champlain is a long (193 km) and narrow (20 km at the widest point) lake spanning the border of New York and Vermont, USA and Quebec, Canada. The portion of the lake with deep water suitable for slimy sculpin is approximately 110 km long. The lake has a maximum depth of 122 m and an average depth of 19.5 m. Three large islands naturally divide the northern portion of Lake Champlain into eastern and western arms (Figure 2.1). The construction of six causeways built between 1850 and 1900 have linked the islands to the mainland and have isolated the lake further into three major basins: the Main Lake, Malletts Bay, and the Inland Sea (Figure 2.1; Marsden & Langdon 2012). All the causeways have at least one shallow (1-7 m deep) opening that allows some flow of water and passage of boats and fish; Carry Bay and the Island Line causeways each have an additional non-navigable opening. Lake Ontario is 311 km long, 85 km wide, with a average depth of 84 m and a maximum depth of 244 m; apart from a series of islands in the northeastern portion (Bay of Quinte), the lake lacks physical isolating structures.
Slimy sculpin prefer water temperatures less than 10ºC and rarely inhabit temperatures greater than 15ºC; to assess whether causeways would be expected to act as a substantial
25
barrier to sculpin, I measured seasonal changes in water temperature in causeway openings. HOBO® temperature probes were placed on the bottom of all causeways openings except the northwest opening to Carry Bay (Figure 2.1). Temperature was recorded at openings once per hour for 12 months. Slimy sculpins are generally only found in water greater than 25 m deep, therefore depth profiles of all but the Island Line causeway (Figure 2.1) openings were measured using a weighted line from a small boat and depth of the remaining two Island Line causeway openings was estimated using chart data (NOAA Coast Survey 1997).
2.3.2. Fish sampling and genetic analysis
Two hundred slimy sculpin were sampled during August and September 2014 and May, June and July 2015 using benthic trawls at seven sites throughout Lake Champlain (Figure 2.1). Forty-eight slimy sculpin were sampled in October 2016 from two locations approximately 230 km apart in Lake Ontario, NY, one near Fairhaven, New York (43° 29.231'N, -76° 38.053'W) and one near Hamilton, Ontario (43° 20.462'N, 79° 27.736'W). Individuals were euthanized by cooling directly on ice, measured to the nearest
millimeter (total length), and caudal fins were collected following protocols outlined in LaHood et al. (2008) or frozen.
DNA was extracted from fin clips using standard procedures from a DNeasy Blood and Tissue Kit (Qiagen). The concentration of DNA template was verified on a NanoDrop and ranged from 6 – 100 ng/µl of DNA, though most samples contained between 30 and 50ng/µl. Following extraction, polymerase chain reaction (PCR) amplification was conducted for 10 microsatellite loci previously identified for sculpin (Table 2.1). Markers
were multiplexed when possible in 25 µl reactions using 2X Q5 High Fidelity DNA Polymerase Master Mix (New England BioLabs Inc.), and 20 pmol of a fluorescently labeled forward primer and un-labeled reverse primer, and 6 – 100 ng of the DNA template. The general PCR program used was 98°C for 2 min, 30 cycles at 98°C for 30 s at marker-specific annealing temperature (Table 2.1), 72°C for 45 s, followed by a final extension of 72°C for 10 min. Fragment analysis of PCR products was conducted in the University of Vermont Advanced Genome Technologies Core using an Applied
Biosystems 3130 Genetic Analyzer and a ROX 500 size standard and scored using GENEMAPPER software (Applied Biosystems).
2.3.3. Statistical analysis:
Conformance to Hardy-Weinberg equilibrium (HWE) expectations at each locus was estimated using Markov chain Monte-Carlo methods in ARLEQUIN (Excoffier &
Lischer, 2010) with 100,000 step burn-in and 900,000 step determination. Any deviations from HWE were assessed for heterozygote excess or deficiency and significance levels were adjusted using a Bonferroni correction. All loci were assessed for the presence of null alleles with MICRO-CHECKER version 2.2.3 (Van Oosterhout et al., 2004). To quantify the genetic diversity for each locus, the number of alleles per locus was determined and observed (HO) and expected (HE) heterozygosity calculated using GenAlEx (Peakall & Smouse, 2006, 2012). Allelic richness was calculated using rarefaction in FSTAT version 2.9.3.2 (Goudet, 1995). To test whether diversity varied between sites and lakes, mean observed heterozygosity and allelic richness were evaluated for differences between Lake Ontario and Lake Champlain and among Main
27
Lake sites and sites in Malletts Bay and the Inland Sea in Lake Champlain by comparing observed data to 10,000 permutations in FSTAT. As an additional estimate of diversity, effective population size of each sampled location was calculated using a linkage disequilibrium method in NeESTIMATOR (Do et al., 2014) with minimum acceptable allele frequencies of 0.05, 0.02, and 0.01. Following estimation, a minimum allele frequency of 0.02 was chosen because large changes in effective population size were found between a 0.05 and 0.02 minimum allele frequency, suggesting 0.05 may have been too stringent for our dataset.
Possible genetic structure between lakes and among sites was evaluated using pairwise comparisons of FST, and their associated levels of significance were calculated in
ARLEQUIN. First, population structure was evaluated by calculating FST values between Lake Champlain and Lake Ontario. Next, FST values were calculated within each lake to determine if sculpin populations were structured within lakes. To test for a possible Wahlund effect resulting from early stage isolation, differences in HO vs. HE of the total Lake Champlain sculpin population was measured using a Bartlett test executed in R version 3.3.0 using the bartlett.test() function available in the stats package (R Core Team, 2015). To identify statistically significant differences in allelic variance among sites, analysis of molecular variance (AMOVA) was calculated using ARLEQUIN. AMOVAs were run hierarchically, as indicated in Table 1.2 groupings. Sample sites were first grouped by lake, and Lake Champlain slimy sculpin were compared to Lake Ontario slimy sculpin. Next, slimy sculpin from Lake Champlain were analyzed separately, comparing all sampled sites in the Main Lake to sites sampled in the Inland Sea to
determine if causeways could explain differences in allele frequencies. The site in Malletts Bay was excluded because it was the only site sampled in the basin.
To assess whether populations are isolated by distance, Lake Champlain and Lake Ontario were analyzed separately. In Lake Champlain, a pairwise FST matrix was compared against a pairwise matrix of geographic distance using a Mantel’s test to determine whether differences in genetic variation among slimy sculpin sample locations correspond to geographic distance measured as the shortest possible route by water between two sites. Mantel tests were conducted in IBDWeb using 10,000 permutations (Jensen, Bohonak & Kelley, 2005). Pairwise genetic distance was estimated between the two Lake Ontario sites to evaluate whether similar levels of isolation by distance occur in Lake Ontario and Lake Champlain. Because only two sites were sampled in Lake Ontario I was unable to run a Mantel test, however I expected the FST between sites in Lake Ontario to be similar to FST between the two furthest sites in Lake Champlain if the effect of isolation by distance is similar in both lakes.
To further examine how slimy sculpin populations were structured among and within lakes, discriminate analysis of principle components (DAPC) and Bayesian
STRUCTURE analysis were used to identify clusters of individuals representing
populations (Pritchard et al., 2000; Jombart, 2008; Jombart, Devillard & Balloux, 2010). DAPC is a multivariate analysis that maximizes genetic differentiation between groups while minimizing within-group variation. The relationship between sample sites was evaluated hierarchically; DAPC was first run using the complete dataset to visualize the relationship between all samples sites in Lake Ontario and Lake Champlain, then using
29
only individuals from Lake Champlain. All DAPCs were conducted in R version 3.3.0 using the ADEGENET version 2.0.1 (Jombart, 2008; R Core Team, 2015). Bayesian STRUCTURE analysis was also run hierarchically, first on the total dataset and
subsequently on only Lake Champlain individuals. STRUCTURE was run 10 times for each value of k = 1 – 10 with settings of 500,000 replicates and an initial burn-in of 100,000 replicates. The most likely number of clusters (k) was then assessed using ∆K estimated in STRUCTURE HARVESTER (Evanno, Regnaut & Goudet, 2005; Earl & vonHoldt, 2012) and the most likely estimates of k were consolidated into a single best estimate using CLUMPP (Jakobsson & Rosenberg, 2007).
2.4. Results
2.4.1. Habitat suitability:
Average depth of each causeway opening at mean lake level (29.1 m above sea level) varied among causeways, ranging from less than 1.0 m at the Sandbar causeway to just over 7.0 m at the Alburg Passage causeway. However, even when adjusted to the maximum reported lake level of 31.6 m the depth of all openings was less than 10.0 m. Temperature in causeway openings ranged from near 0.0 ºC in January and February when sensors became frozen in ice to 22 – 25 ºC during July and August. For causeway openings with at least 365 days of available temperature data (N = 4), temperature was above the adult sculpin avoidance temperature of 15 ºC for 37 ± 2% of the year and above the preferred temperature of 9 ºC for 53 ± 3% of the year (Otto & Rice, 1977).
Genetic diversity differed slightly between lakes but was consistent within lakes. Locus Cco14 exhibited inconsistencies in allele scoring and was therefore removed from analysis. No loci showed signs of null alleles. All loci except locus Cott213 were polymorphic at all sites with 5 to 25 alleles per locus. All loci at all sites were in HWE following a sequential Bonferroni correction. Observed (HO) and expected (HE)
heterozygosity was moderate for all sites (average = 0.59 and 0.58, respectively; Table 2.2). Observed heterozygosity was significantly higher (p = 0.03) in Lake Champlain (0.62) than in Lake Ontario (0.51) but consistent among sites within each lake. Mean allelic richness of loci was higher (p = 0.01) in Lake Champlain (5.9) than in Lake Ontario (5.2). Allelic richness was similar among all sites within Lake Champlain, ranging from 5.6 at Sunset Isle to 6.2 at Inland Sea North. No significant differences in allelic richness were found among Main Lake (5.8), Malletts Bay and Inland Sea populations (6.0; p = 0.53). Effective population size was moderate to high for all populations and the upper limit of the confidence interval always included infinity. Effective population sizes of Hamilton and Fairhaven sites in Lake Ontario were estimated to be 140.1 and 101.5 individuals. Within Lake Champlain, effective
population sizes tended to be higher at Main Lake sites than Malletts Bay or the Inland Sea. Barber Point, Shelburne Bay and Sunset Isle exhibited the highest effective population sizes in the Main Lake (Ne = ∞), followed by Grand Isle (Ne = 223.1). Malletts Bay and the Inland Sea North and South sites had more moderate estimated effective population sizes (Ne = 226.3, 139.4, and 433.1, respectively).
31
Sculpin in Lake Ontario were genetically distinct from sculpin in Lake Champlain. Pairwise FST values between Lake Ontario and Lake Champlain populations were large (0.065 - 0.118) relative to within-lake pairwise comparisons (Table 2.3). When
populations in Lake Champlain were compared to populations in Lake Ontario, 10.4% of allele frequency variation occurred between lakes (AMOVA p < 0.001) while 89.7% of the variation occurred within individual populations. Both DAPC and a delta k analysis of STRUCTURE indicated the presence of two clusters, offering further evidence of between-lake population structure (Figure 2.2).
2.4.4. Within-lake genetic structure:
Evidence of weak to no genetic differentiation was found among sampled populations within Lake Champlain and Lake Ontario. Pairwise estimates of FST were small (0.00 - 0.016; Table 2.3). Only two comparisons had FST values significantly greater than zero, though both corresponded to values less than 0.02. Additionally, there was no indication of a reduction of heterozygosity across loci characteristic of a Wahlund effect (Bartlett test p = 0.91). When populations in the Main Lake were compared to populations in the Inland Sea, less than 1% (AMOVA p = 0.53) of allele frequency variation occurred between basins while 99.8% of the variation occurred within individual populations. Subsequent runs of STRUCTURE and DAPC examining substructure within Lake Champlain did not reveal any further clustering, suggesting the presence of a single panmictic population (Figure 2.2).
No correlation was observed between waterway distance (the shortest distance by water between two sites) and pairwise FST in Lake Champlain (r2 = 0.08; p = 0.82; Figure 2.3)
indicating that populations of slimy sculpin were not isolated by distance. Additionally, pairwise FST was zero between Fairhaven and Hamilton in Lake Ontario, similar to pairwise FST among sites in Lake Champlain. However, Fairhaven and Hamilton are separated by more than 220 km, about four times the maximum distance between sites in Lake Champlain, indicating a lack of isolation by distance in Lake Ontario.
2.5. Discussion
Our findings indicate that, although slimy sculpin in Lake Champlain and Lake Ontario have comparable genetic diversity to slimy and mottled sculpin in streams and rivers (Huff, Miller & Vondracek, 2010; Lamphere & Blum, 2012), they exhibit little to no within-lake genetic structure even across numerous barriers and distances up to 227 km (Breen et al., 2009; Lamphere & Blum, 2012). The lack of any observed genetic structure indicates that sculpins in Lake Champlain and Lake Ontario represent single panmictic populations. The relatively large genetic differences observed between lakes Ontario and Champlain were expected, considering that the lakes have been isolated since the last glacial retreat approximately 10,000 years ago (Rayburn, Franzi & Knuepfer, 2007). Although Lake Ontario and Lake Champlain remain connected by the St. Lawrence River, this route is unlikely to provide enough connectivity to maintain a genetically homogeneous population; transit between the lakes would entail a 360-km downstream trip in the St. Lawrence River, followed by 130 km of upstream dispersal through the Richelieu River, or vice versa.
Low genetic structure is usually a feature of highly connected populations with high mobility and capacity for dispersal (Muths et al., 2013; Thompson et al., 2015).